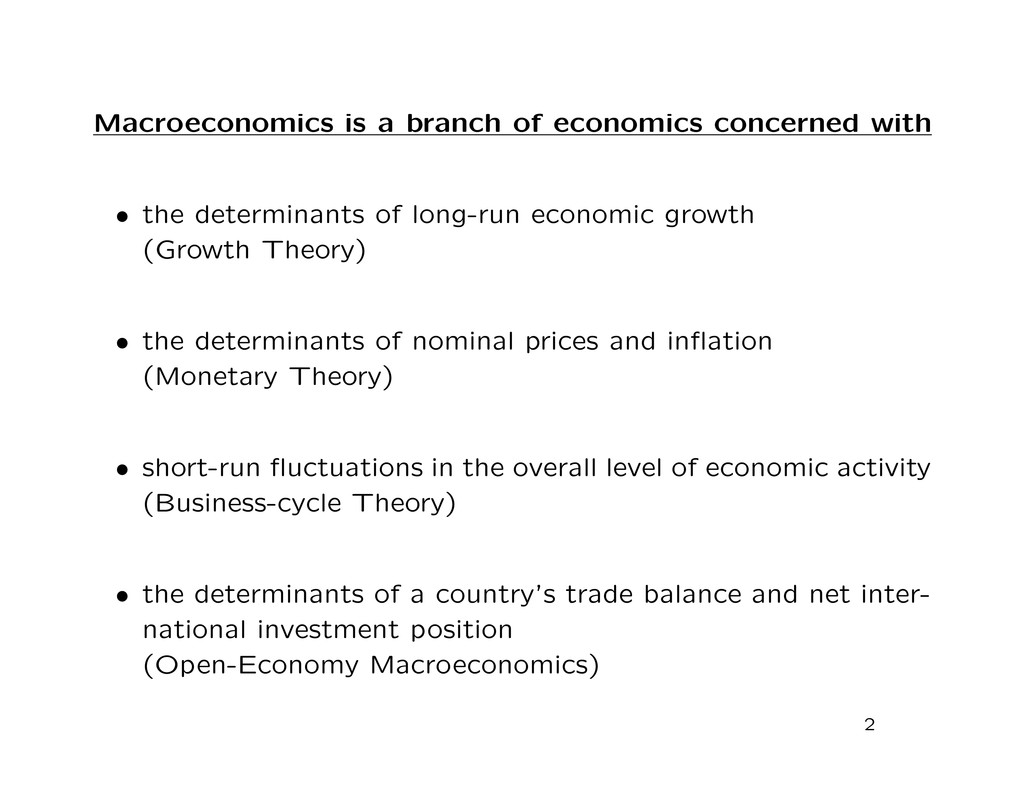
determinants of long-run economic growth (Growth Theory) • the determinants of nominal prices and inflation (Monetary Theory) • short-run fluctuations in the overall level of economic activity (Business-cycle Theory) • the determinants of a country’s trade balance and net inter- national investment position (Open-Economy Macroeconomics) 2
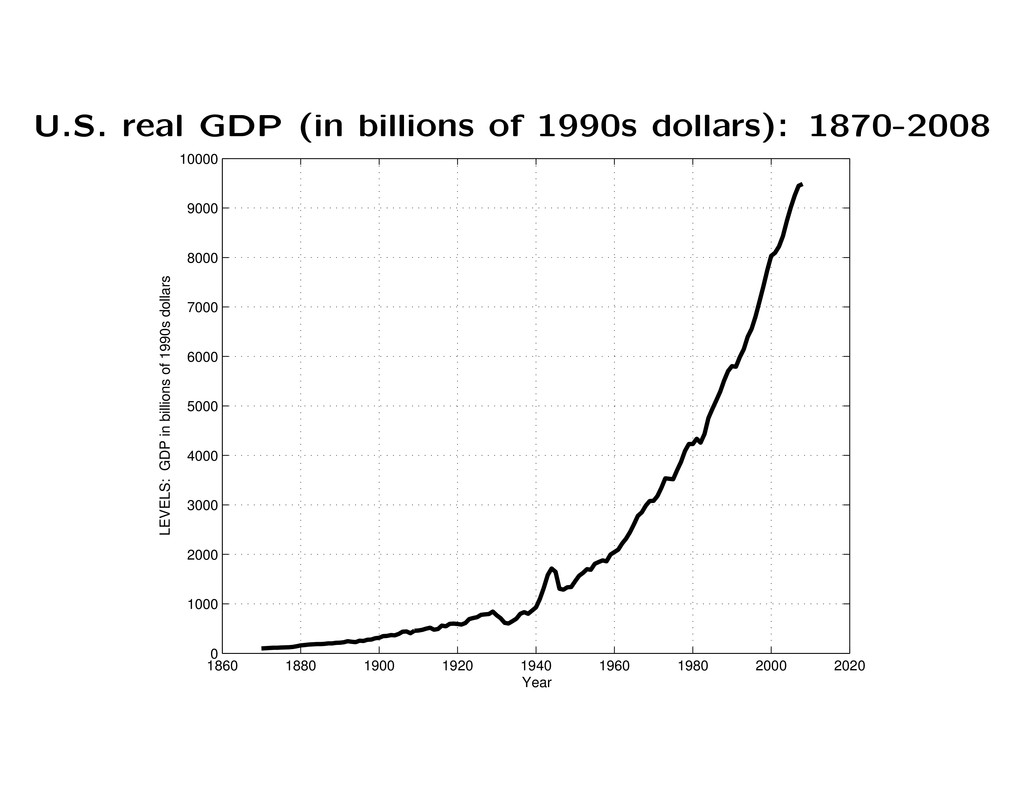
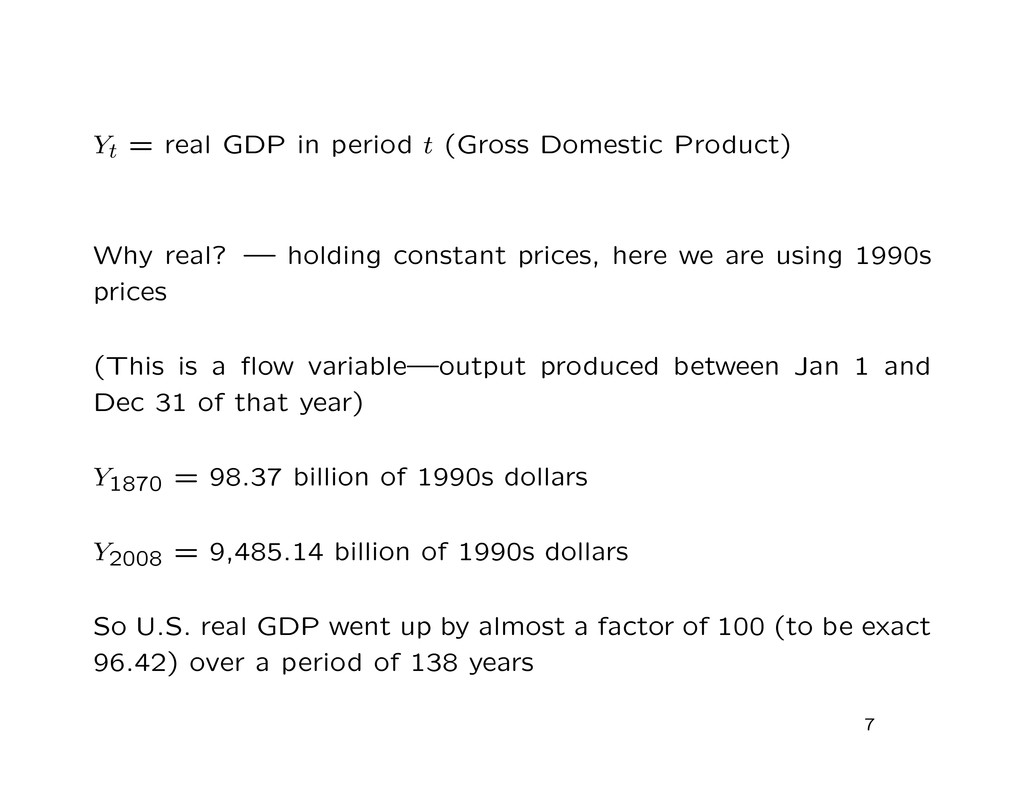
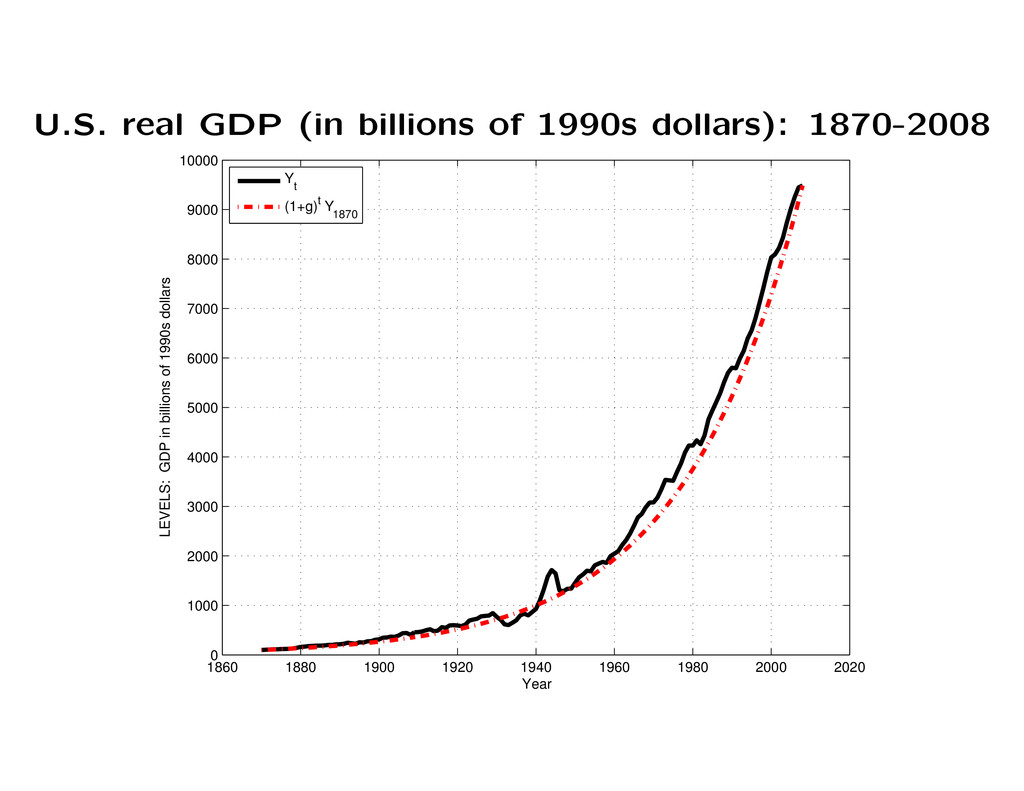
Why real? — holding constant prices, here we are using 1990s prices (This is a flow variable—output produced between Jan 1 and Dec 31 of that year) Y1870 = 98.37 billion of 1990s dollars Y2008 = 9,485.14 billion of 1990s dollars So U.S. real GDP went up by almost a factor of 100 (to be exact 96.42) over a period of 138 years 7
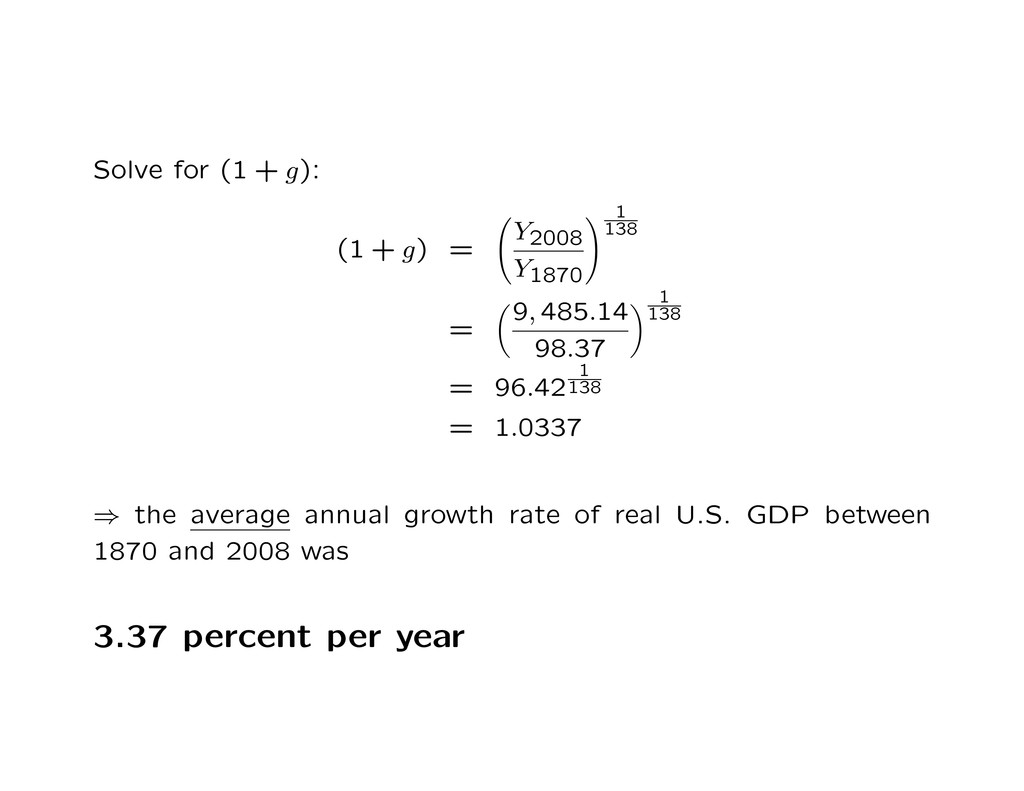
Y1870 1 138 = 9, 485.14 98.37 1 138 = 96.42 1 138 = 1.0337 ⇒ the average annual growth rate of real U.S. GDP between 1870 and 2008 was 3.37 percent per year
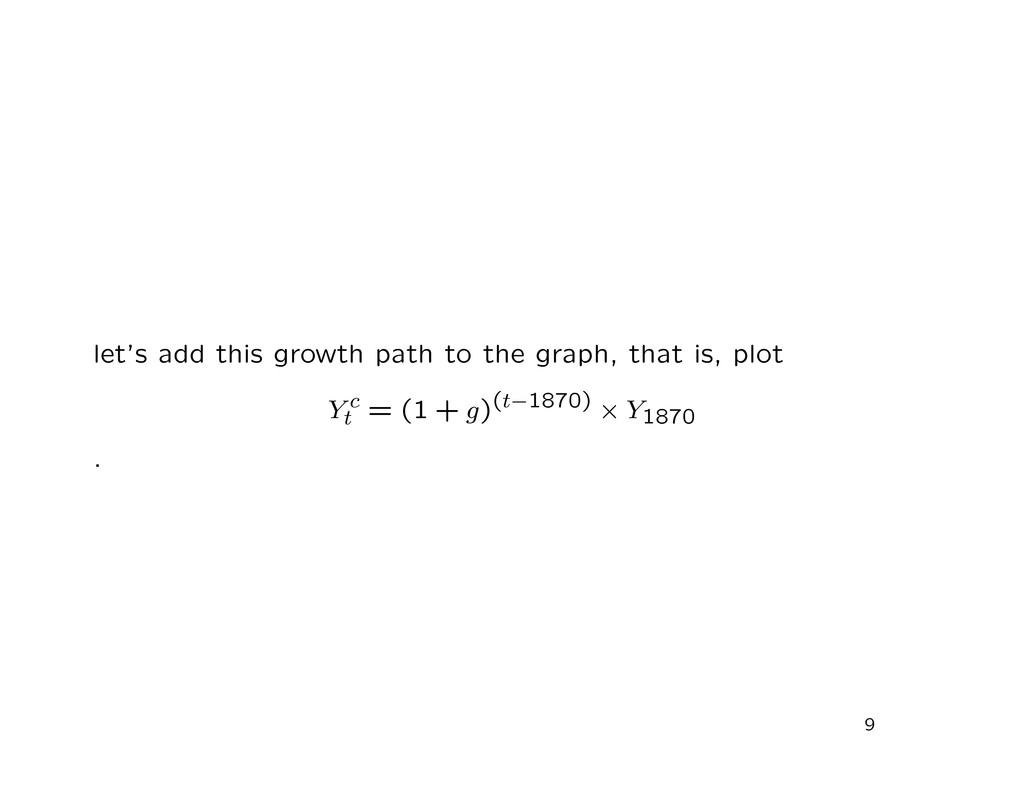
1880 1900 1920 1940 1960 1980 2000 2020 0 1000 2000 3000 4000 5000 6000 7000 8000 9000 10000 LEVELS: GDP in billions of 1990s dollars Year Y t (1+g)t Y 1870
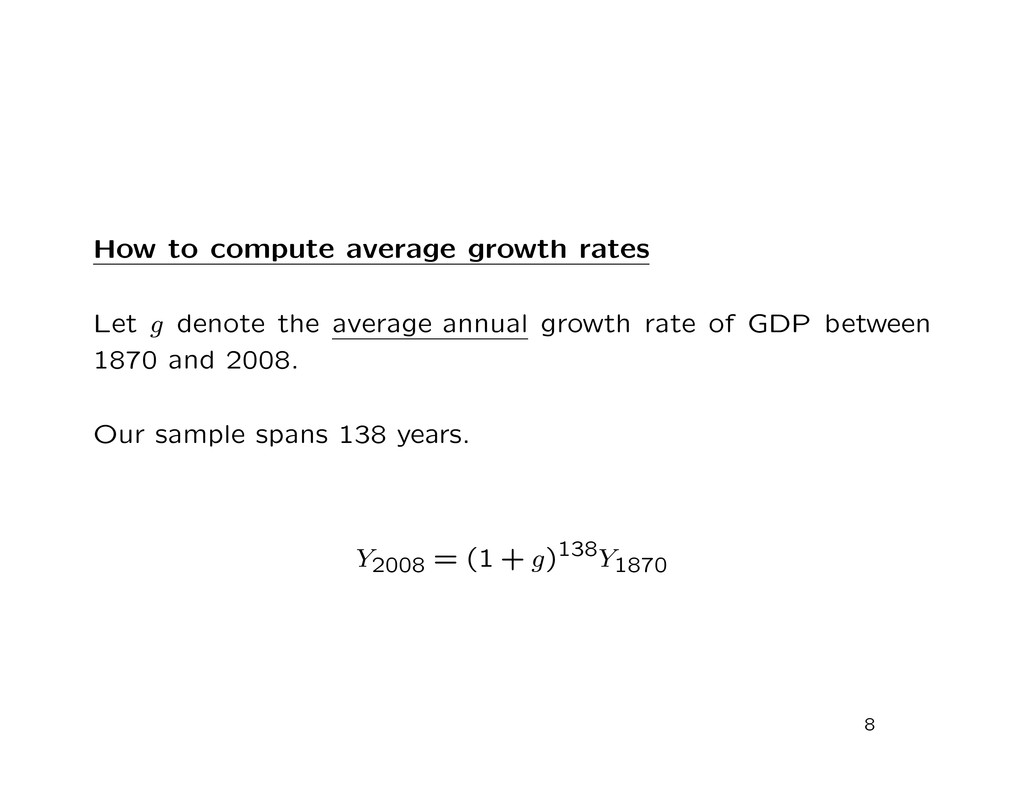
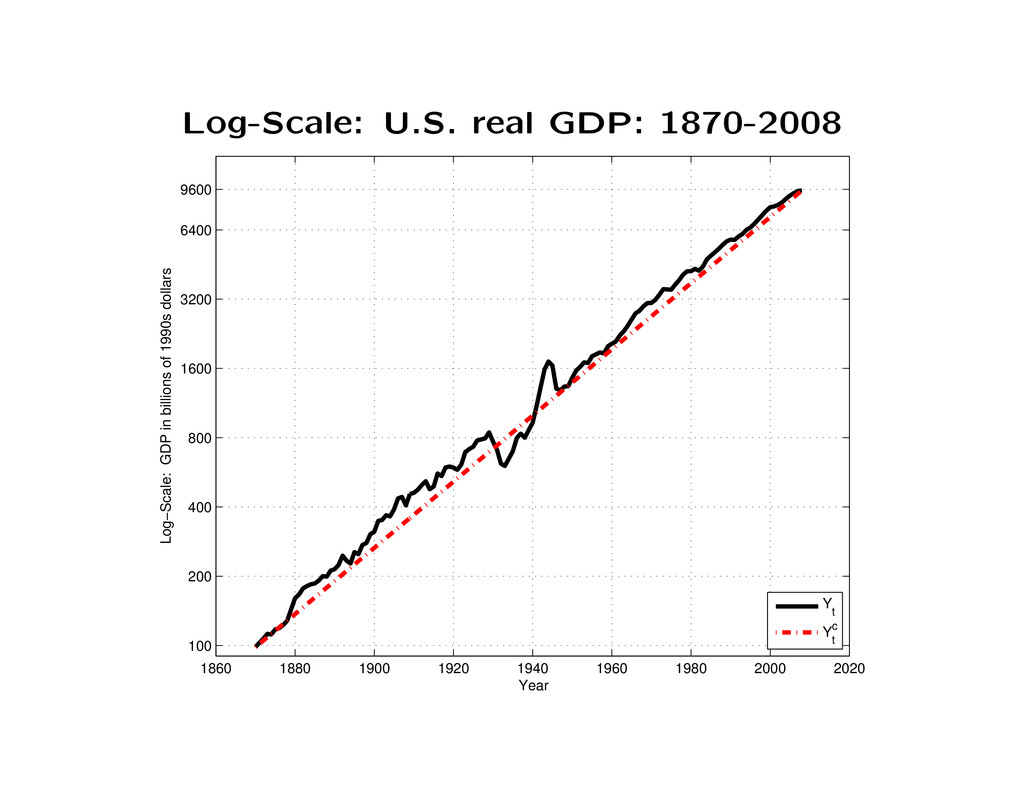
make it easy to see that something is growing at a constant rate. Similarly, the graph makes it very hard to see that real GDP grew by a factor of 96 over the sample. For this reason, economists like to plot variables that grow over time (i.e., variables that have a trend) on a natural log scale. Let’s first look at a plot of the constant growth path in logs and then discuss why it is so much more intuitive. 11
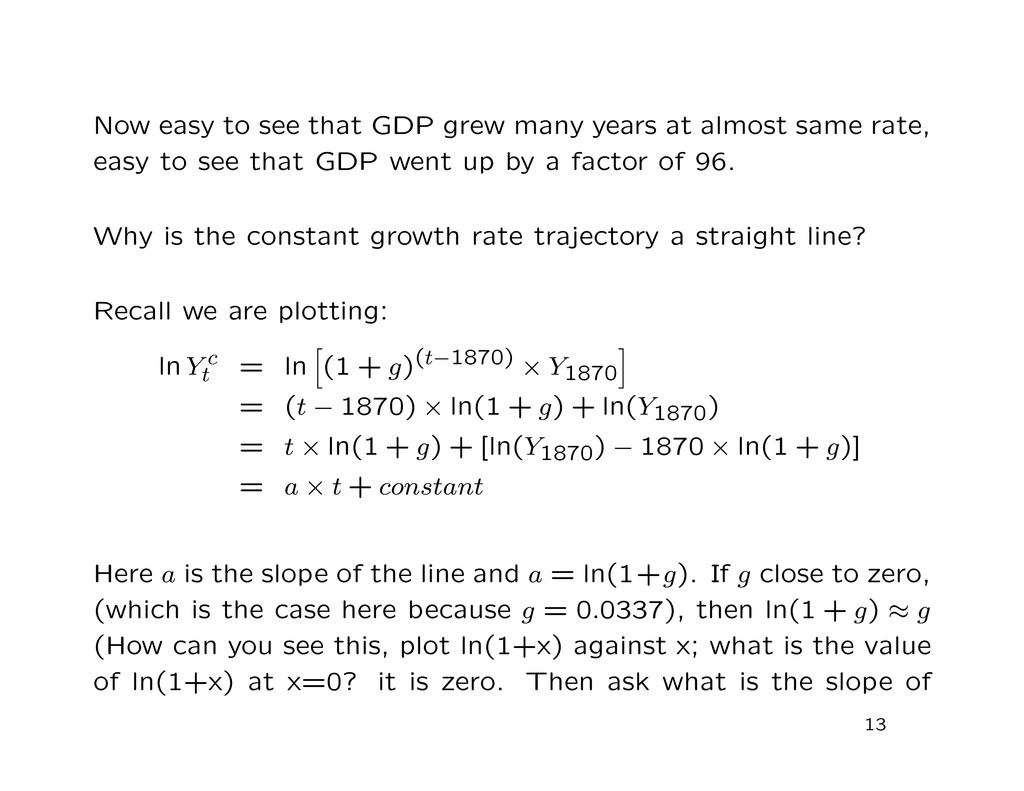
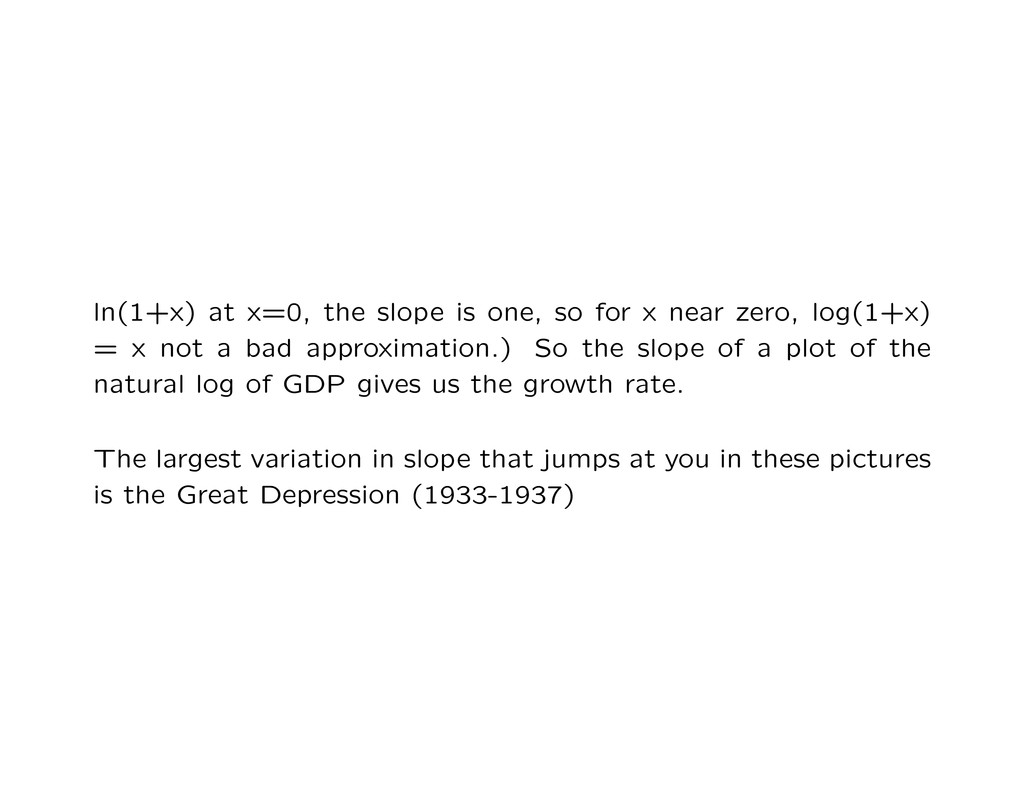
almost same rate, easy to see that GDP went up by a factor of 96. Why is the constant growth rate trajectory a straight line? Recall we are plotting: ln Y c t = ln (1 + g)(t−1870) × Y1870 = (t − 1870) × ln(1 + g) + ln(Y1870) = t × ln(1 + g) + [ln(Y1870) − 1870 × ln(1 + g)] = a × t + constant Here a is the slope of the line and a = ln(1+g). If g close to zero, (which is the case here because g = 0.0337), then ln(1 + g) ≈ g (How can you see this, plot ln(1+x) against x; what is the value of ln(1+x) at x=0? it is zero. Then ask what is the slope of 13
near zero, log(1+x) = x not a bad approximation.) So the slope of a plot of the natural log of GDP gives us the growth rate. The largest variation in slope that jumps at you in these pictures is the Great Depression (1933-1937)
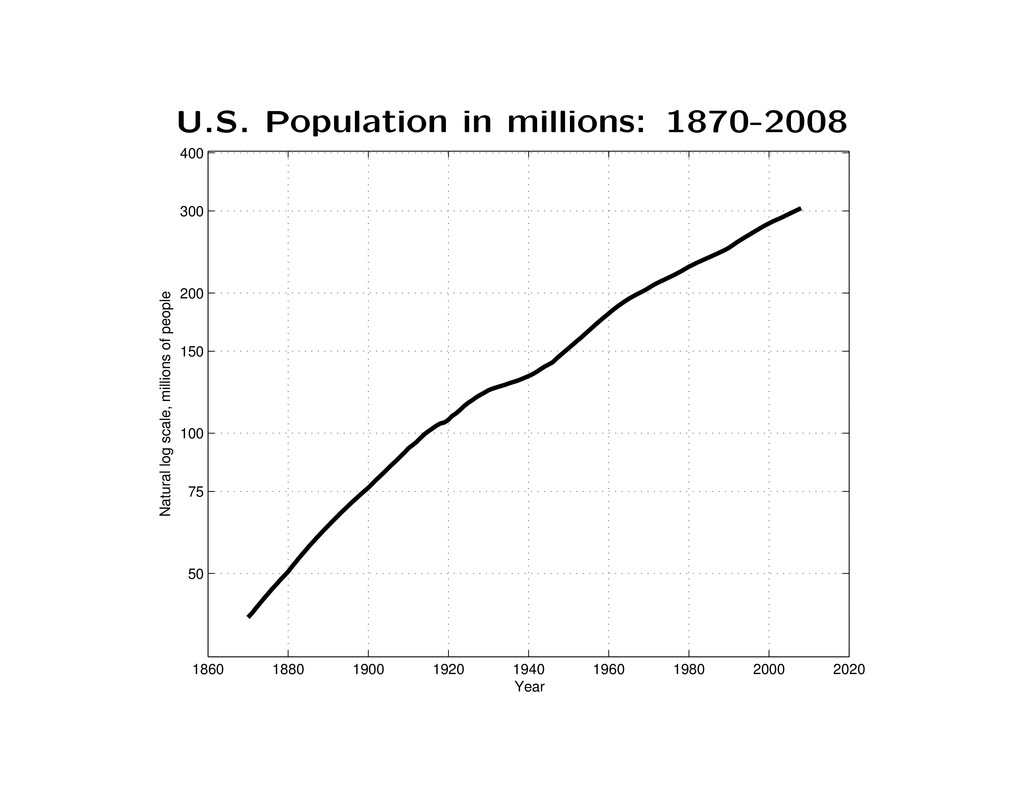
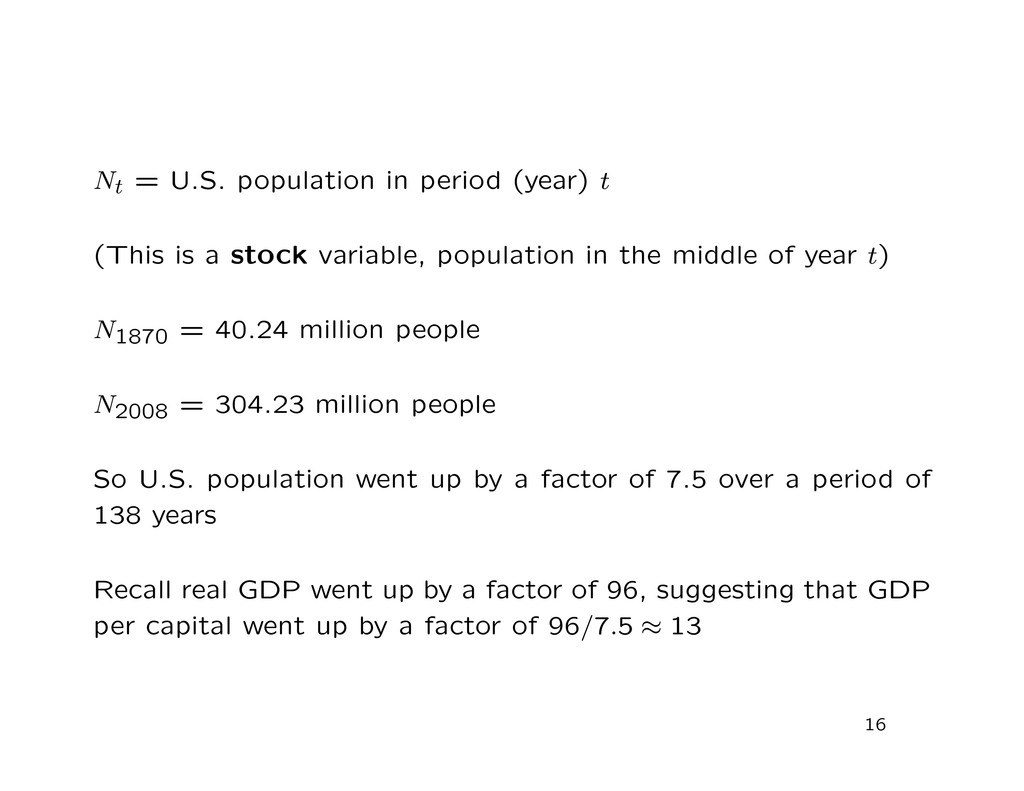
a stock variable, population in the middle of year t) N1870 = 40.24 million people N2008 = 304.23 million people So U.S. population went up by a factor of 7.5 over a period of 138 years Recall real GDP went up by a factor of 96, suggesting that GDP per capital went up by a factor of 96/7.5 ≈ 13 16
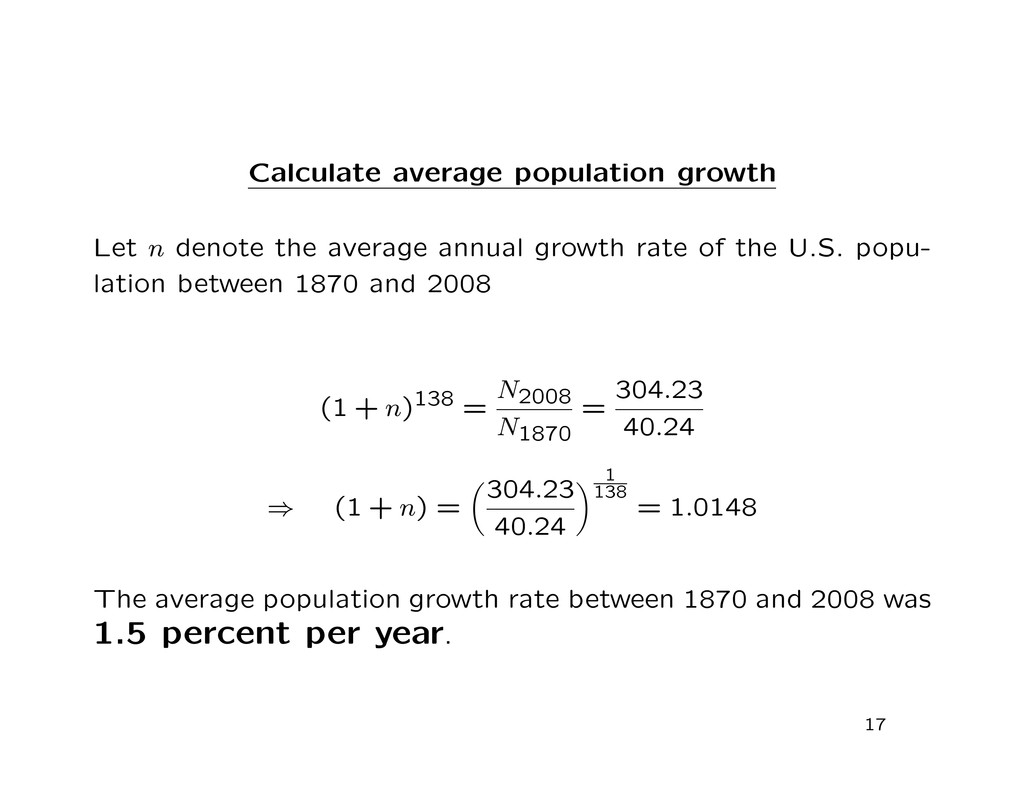
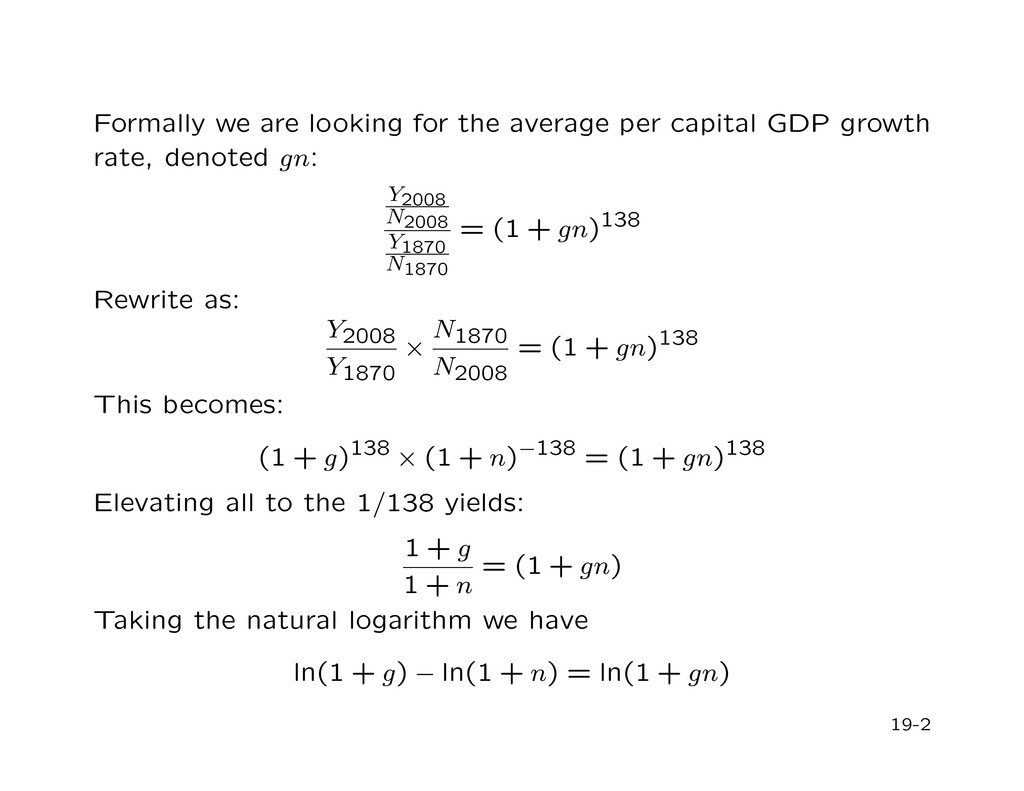
growth rate of the U.S. popu- lation between 1870 and 2008 (1 + n)138 = N2008 N1870 = 304.23 40.24 ⇒ (1 + n) = 304.23 40.24 1 138 = 1.0148 The average population growth rate between 1870 and 2008 was 1.5 percent per year. 17
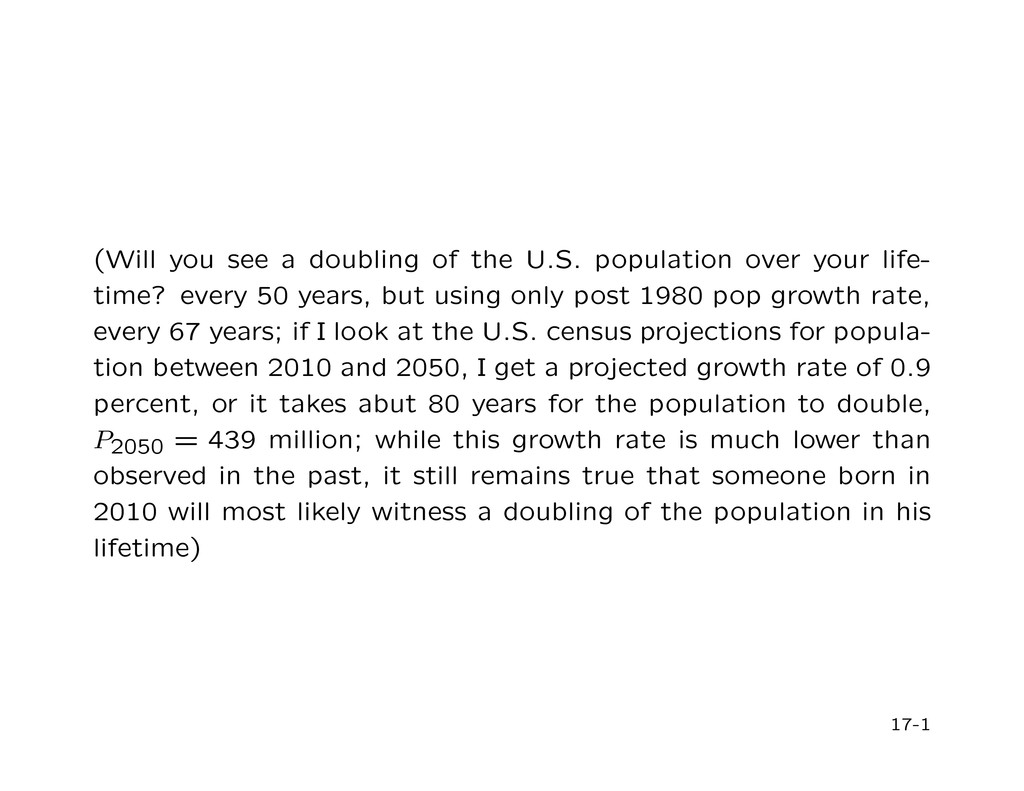
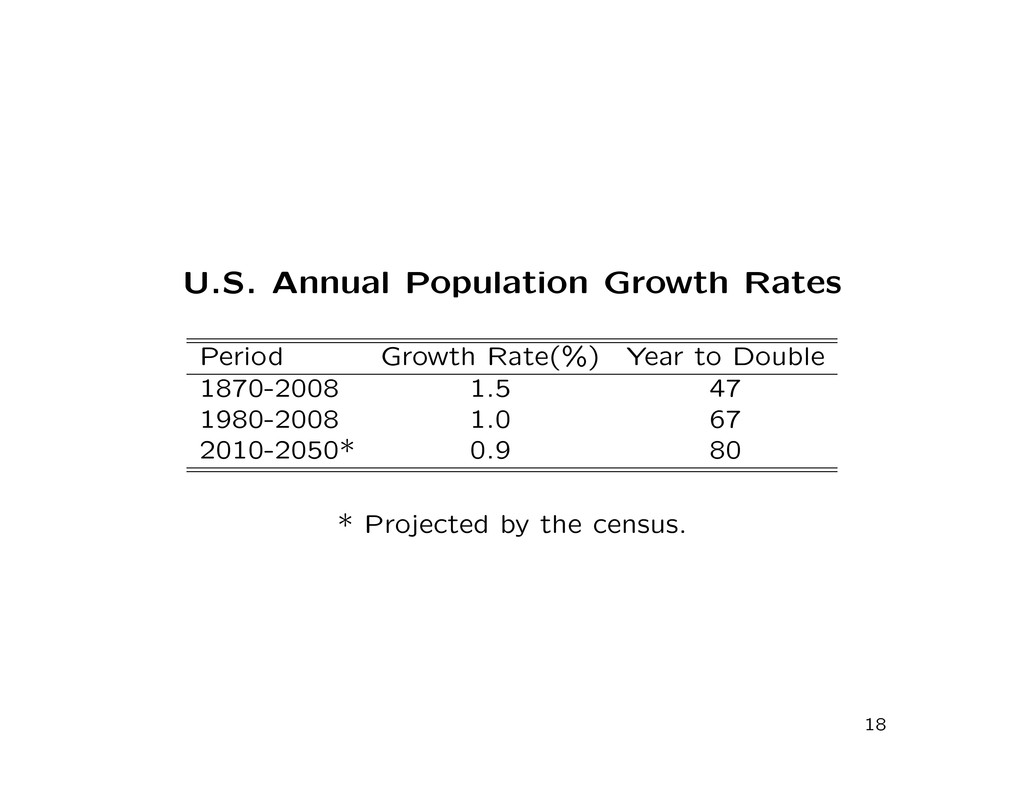
your life- time? every 50 years, but using only post 1980 pop growth rate, every 67 years; if I look at the U.S. census projections for popula- tion between 2010 and 2050, I get a projected growth rate of 0.9 percent, or it takes abut 80 years for the population to double, P2050 = 439 million; while this growth rate is much lower than observed in the past, it still remains true that someone born in 2010 will most likely witness a doubling of the population in his lifetime) 17-1
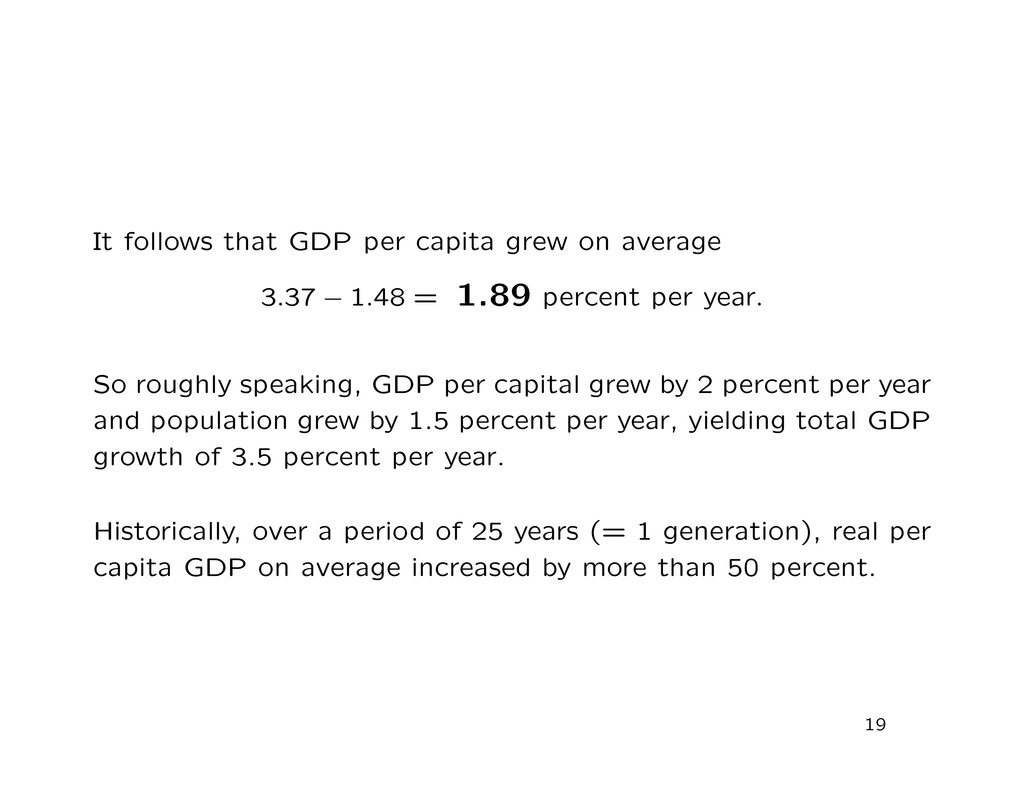
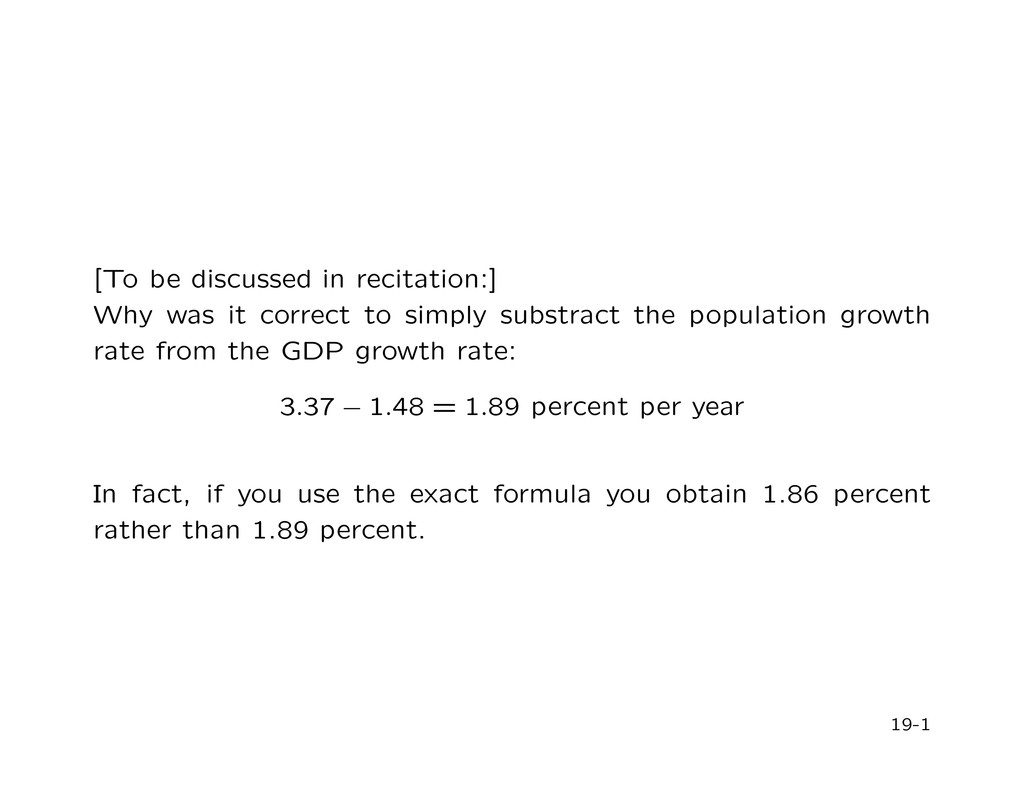
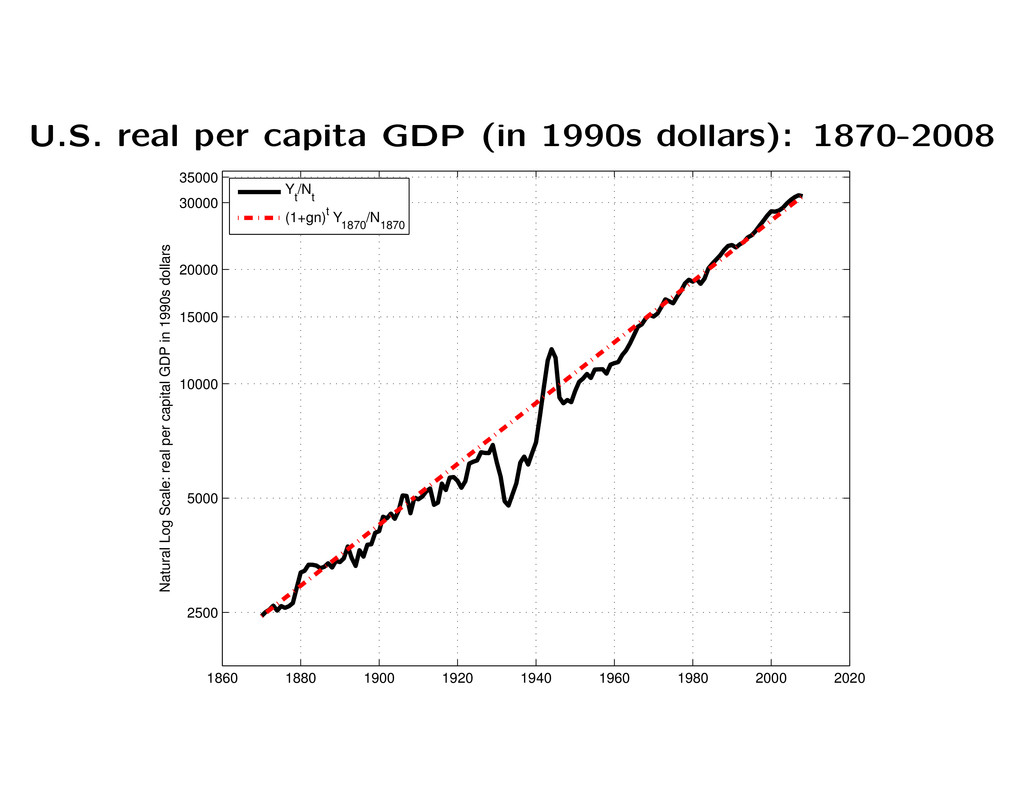
− 1.48 = 1.89 percent per year. So roughly speaking, GDP per capital grew by 2 percent per year and population grew by 1.5 percent per year, yielding total GDP growth of 3.5 percent per year. Historically, over a period of 25 years (= 1 generation), real per capita GDP on average increased by more than 50 percent. 19
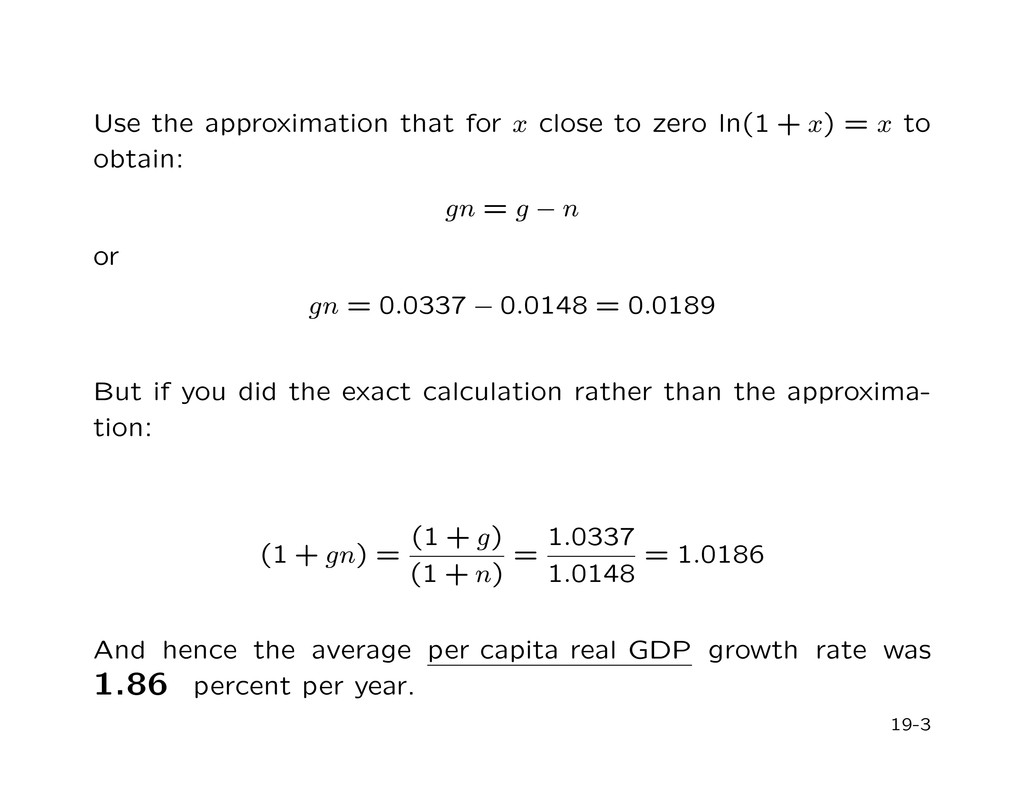
simply substract the population growth rate from the GDP growth rate: 3.37 − 1.48 = 1.89 percent per year In fact, if you use the exact formula you obtain 1.86 percent rather than 1.89 percent. 19-1
+ x) = x to obtain: gn = g − n or gn = 0.0337 − 0.0148 = 0.0189 But if you did the exact calculation rather than the approxima- tion: (1 + gn) = (1 + g) (1 + n) = 1.0337 1.0148 = 1.0186 And hence the average per capita real GDP growth rate was 1.86 percent per year. 19-3
1880 1900 1920 1940 1960 1980 2000 2020 2500 5000 10000 15000 20000 30000 35000 Natural Log Scale: real per capital GDP in 1990s dollars Y t /N t (1+gn)t Y 1870 /N 1870
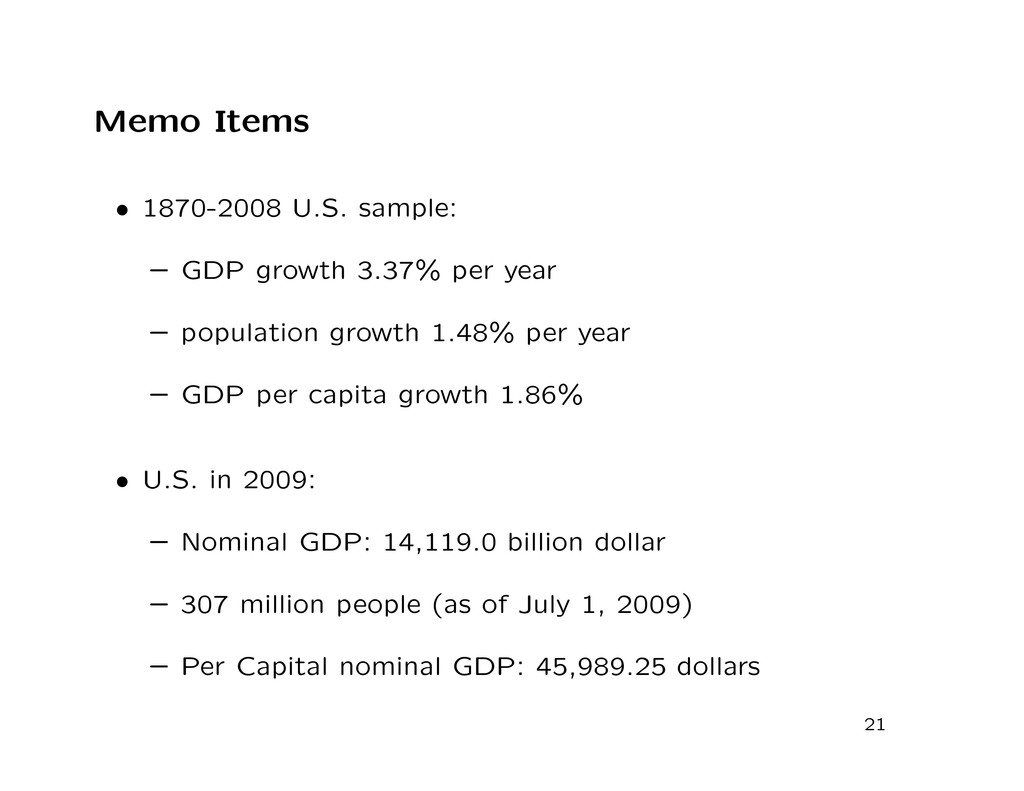
per year – population growth 1.48% per year – GDP per capita growth 1.86% • U.S. in 2009: – Nominal GDP: 14,119.0 billion dollar – 307 million people (as of July 1, 2009) – Per Capital nominal GDP: 45,989.25 dollars 21


 skipperchong
 jmmastey
 stephenakadiri
 kevinliebholz
 marketingsoph
 sabderemane
 mojombo
 colly
 akosma
 productmarketing
 maggiecrowley
 helenjbeal