Upgrade to Pro — share decks privately, control downloads, hide ads and more …

Regression Analysis: The good, the bad and untold

Jalem Raj Rohit
September 01, 2017

Regression Analysis: The good, the bad and untold

Presented at Pydata Delhi 2017

Jalem Raj Rohit

September 01, 2017
Tweet

More Decks by Jalem Raj Rohit

Other Decks in Science

Transcript

  1. INTRODUCTION I am Jalem Raj Rohit. Works on Devops and

    Machine Learning full-time. Contributes to Julia, Python and Go’s libraries as volunteer work, along with moderating the Devops and DataScience sites of StackOverflow
  2. MOTIVATION • Understanding and appreciating the beauty behind the simplicity

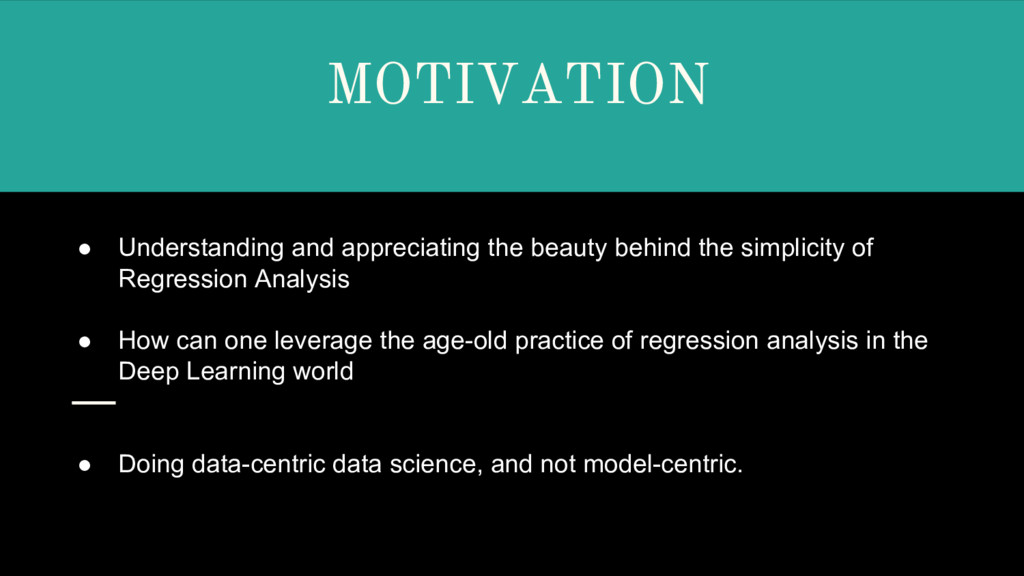
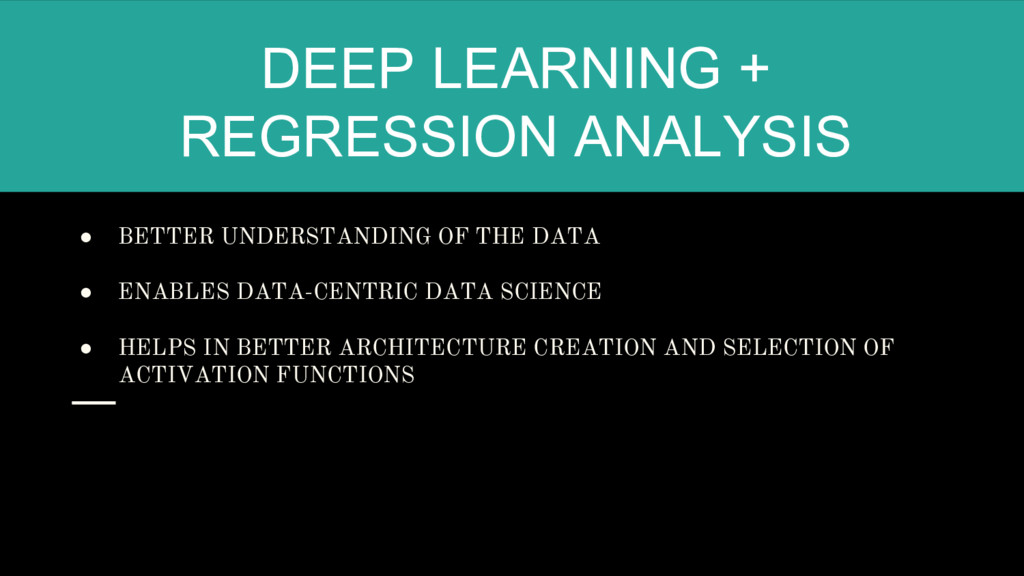
    of Regression Analysis • How can one leverage the age-old practice of regression analysis in the Deep Learning world • Doing data-centric data science, and not model-centric.
  3. WHY NOT MODEL-CENTRIC? • People change, and so do their

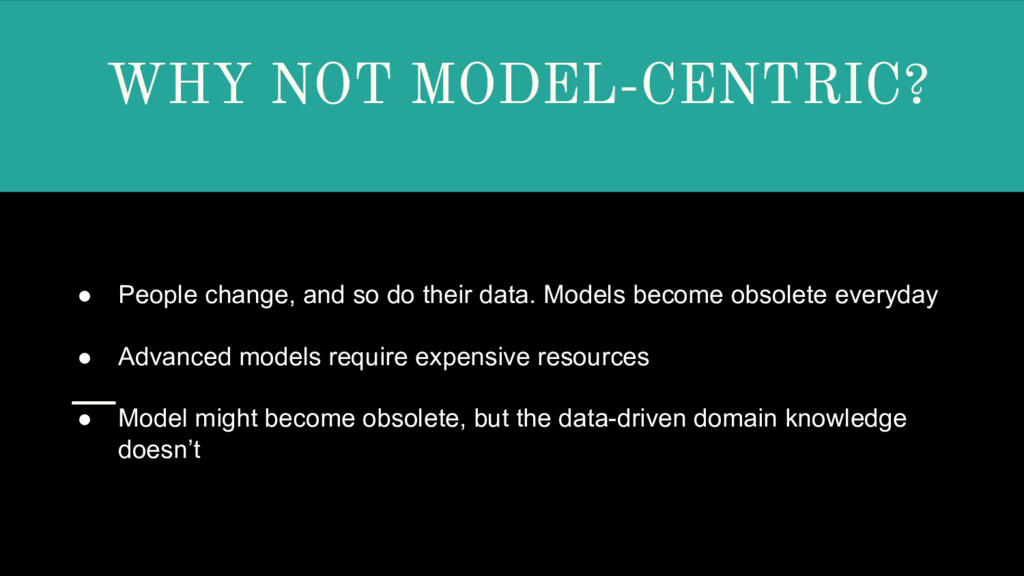
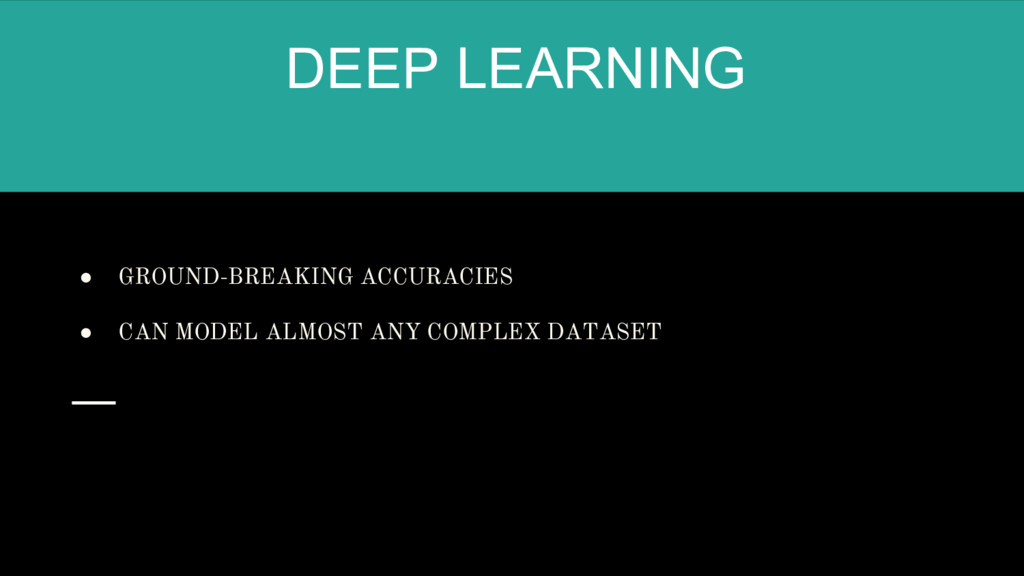
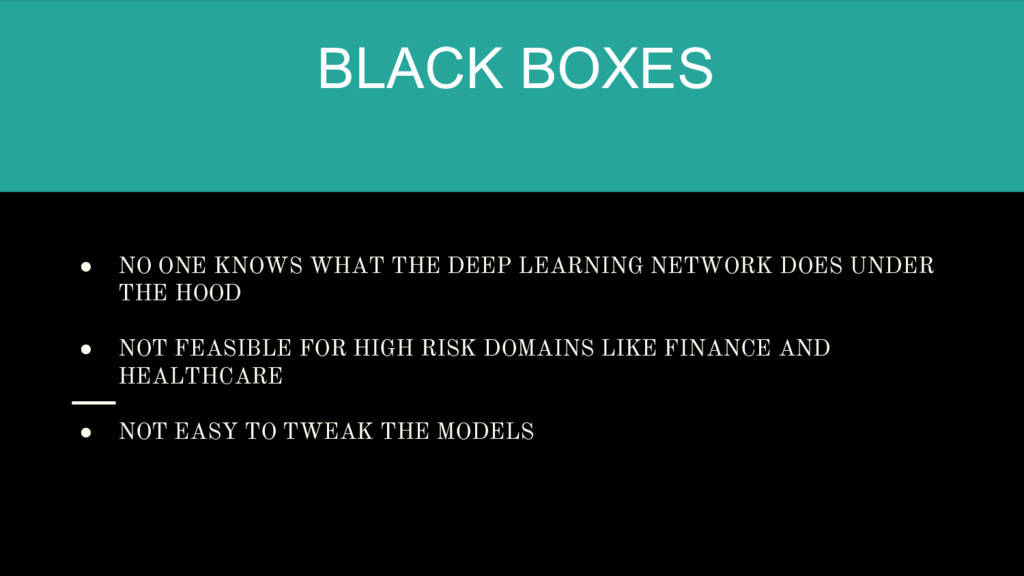
    data. Models become obsolete everyday • Advanced models require expensive resources • Model might become obsolete, but the data-driven domain knowledge doesn’t
  4. • Regression Analysis is a statistical process for estimating the

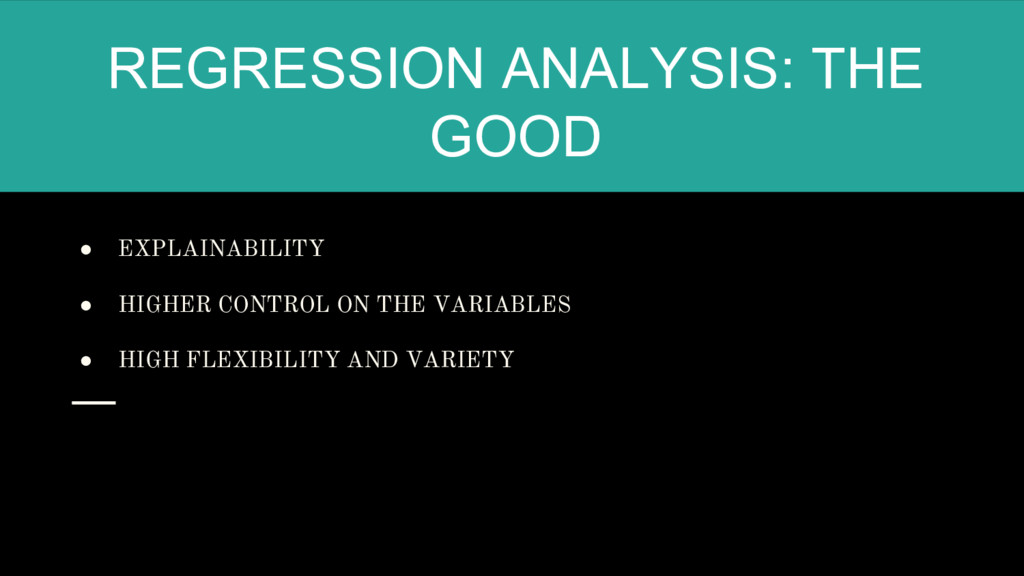
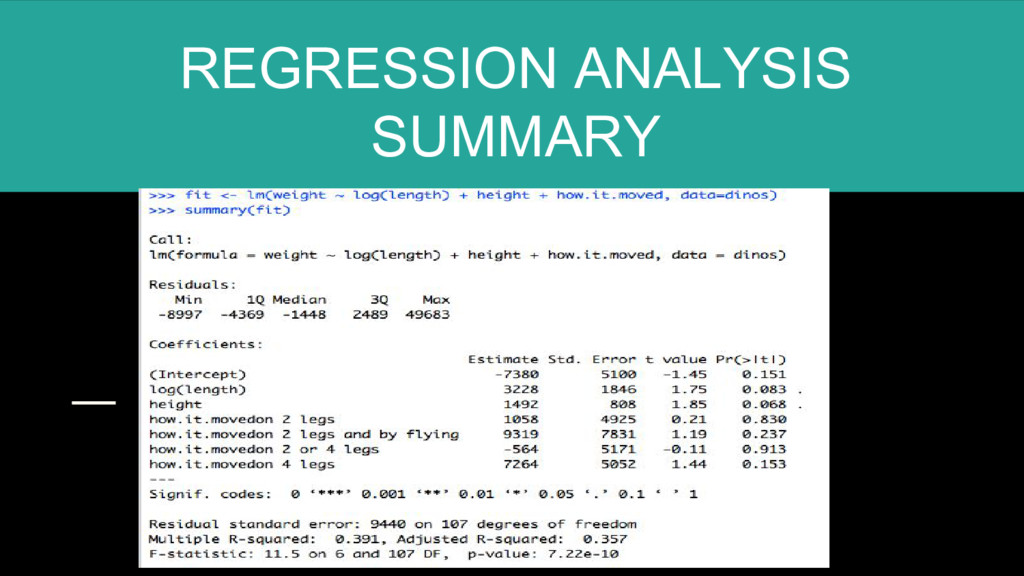
    relationships among variables. • It helps one understand how the typical value of the dependant variable changes when any of the independent variables is varied, while the other independent variables are fixed What exactly is Regression Analysis?
  5. • Regression Analysis is the first step for almost every

    data science problem • Understand the relationship between variables or a set of variables • Thus data-centric BACK IN THE DAYS….
  6. • BLACK BOXES. (Cannot be used in high-risk domains) •

    COMPUTATIONALLY EXPENSIVE SHORTCOMINGS OF DEEP LEARNING
  7. • NO ONE KNOWS WHAT THE DEEP LEARNING NETWORK DOES

    UNDER THE HOOD • NOT FEASIBLE FOR HIGH RISK DOMAINS LIKE FINANCE AND HEALTHCARE • NOT EASY TO TWEAK THE MODELS BLACK BOXES
  8. • EXPLAINABILITY • HIGHER CONTROL ON THE VARIABLES • HIGH

    FLEXIBILITY AND VARIETY REGRESSION ANALYSIS: THE GOOD
  9. • Summary of a regression analysis is very straightforward and

    easily interpretable • It broadly contains 5 statistics EXPLAINABILITY
  10. • It all starts with a null hypothesis • P-value:

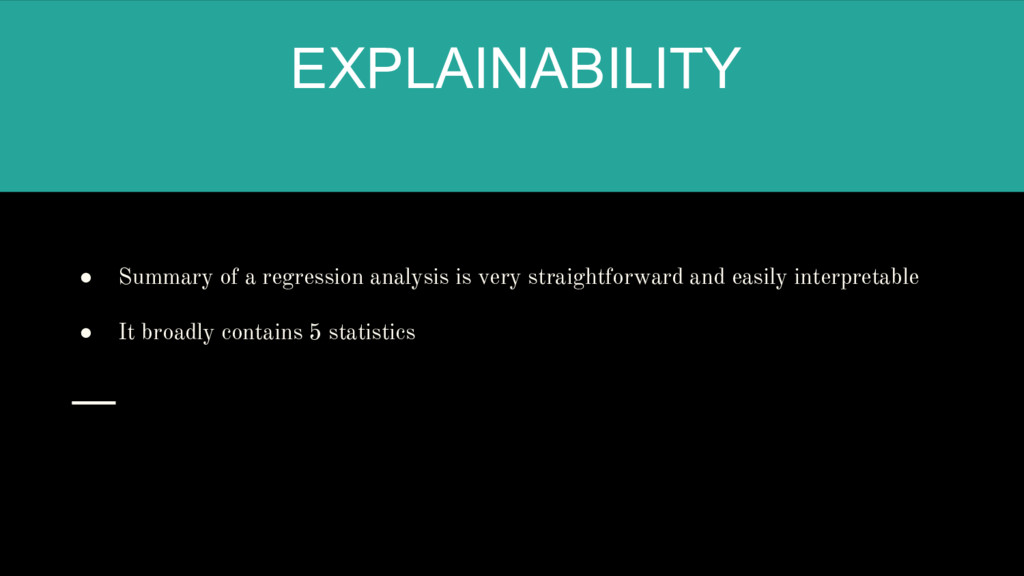
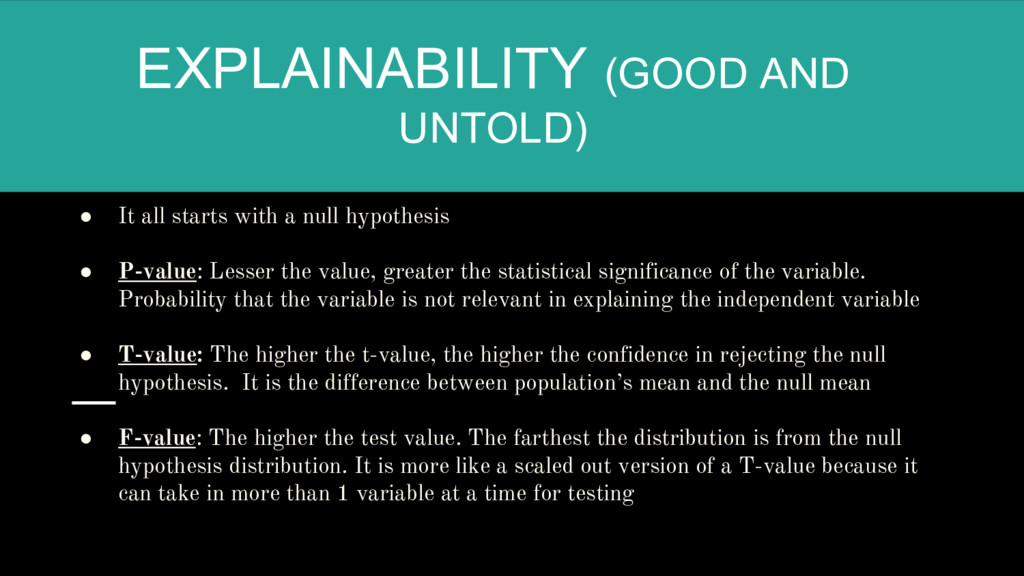
    Lesser the value, greater the statistical significance of the variable. Probability that the variable is not relevant in explaining the independent variable • T-value: The higher the t-value, the higher the confidence in rejecting the null hypothesis. It is the difference between population’s mean and the null mean • F-value: The higher the test value. The farthest the distribution is from the null hypothesis distribution. It is more like a scaled out version of a T-value because it can take in more than 1 variable at a time for testing EXPLAINABILITY (GOOD AND UNTOLD)
  11. • R-squared: Goodness of fit. Depends on the data variance

    between the fitted line and the data • Significance Codes EXPLAINABILITY (contd..)
  12. • Each variable can be tweaked and tested while keeping

    the others constant • Helps understand variable importance and relationship between them HIGHER CONTROL
  13. • Lot of flavours available in regression analysis which include

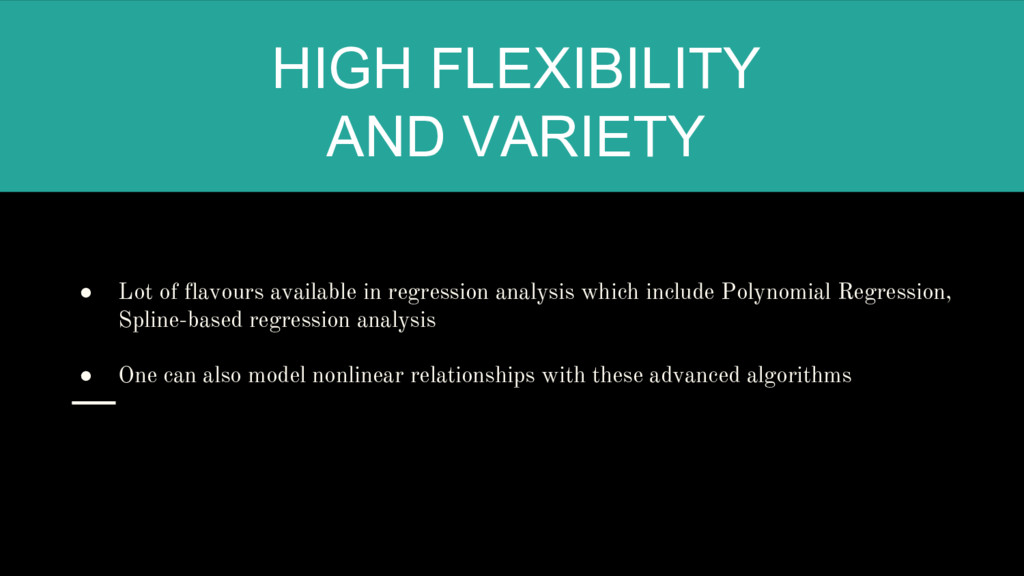
    Polynomial Regression, Spline-based regression analysis • One can also model nonlinear relationships with these advanced algorithms HIGH FLEXIBILITY AND VARIETY
  14. • Very sensitive to outliers • Cannot model extremely complex

    relationships • Data need to be studied properly, before choosing a regression method. An art which needs to be practised for getting good at THE BAD
  15. • BETTER UNDERSTANDING OF THE DATA • ENABLES DATA-CENTRIC DATA

    SCIENCE • HELPS IN BETTER ARCHITECTURE CREATION AND SELECTION OF ACTIVATION FUNCTIONS DEEP LEARNING + REGRESSION ANALYSIS
  16. • REGRESSION ANALYSIS IS NOT A REPLACEMENT FOR PREDICTION ALGORITHMS

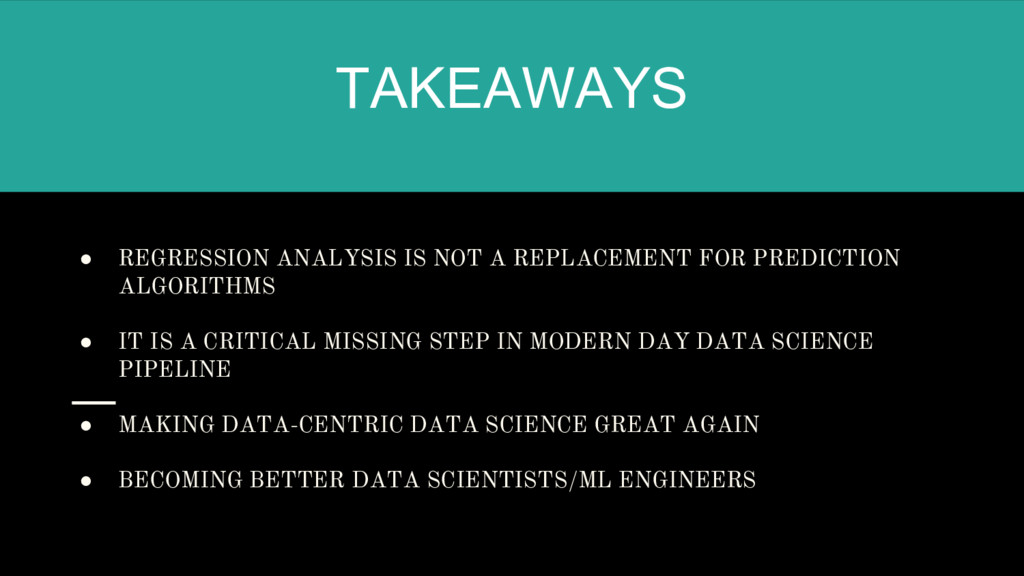
    • IT IS A CRITICAL MISSING STEP IN MODERN DAY DATA SCIENCE PIPELINE • MAKING DATA-CENTRIC DATA SCIENCE GREAT AGAIN • BECOMING BETTER DATA SCIENTISTS/ML ENGINEERS TAKEAWAYS