Upgrade to Pro
— share decks privately, control downloads, hide ads and more …
Speaker Deck
Sign up for free
Menu
Search
Features
All features
Private URLs
Password Protection
Custom URLS
Scheduled publishing
Remove Branding
Restrict embedding
Deck Collections
Notes
Features
All features
Private URLs
Password Protection
Custom URLS
Scheduled publishing
Remove Branding
Restrict embedding
Deck Collections
Notes
Explore
Featured decks
Featured speakers
Programming
Technology
Storyboards
Explore
Featured decks
Featured speakers
Programming
Technology
Storyboards
Pricing
Search
Sign in
Sign up for free
Orange County Vote Margins
Search
Vincent Demonte
May 13, 2025
130
0
Share
Embed
Copy iframe code
Copy JS code
Copy link
Start on current slide
Orange County Vote Margins
A glimpse into the voting margins of Orange County from 1984 to 2024.
Vincent Demonte
May 13, 2025
Featured
See All Featured
What the history of the web can teach us about the future of AI
inesmontani
PRO
2
740
Chasing Engaging Ingredients in Design
codingconduct
0
360
Future Trends and Review - Lecture 12 - Web Technologies (1019888BNR)
signer
PRO
0
3.8k
So, you think you're a good person
axbom
PRO
2
2.2k
The Curse of the Amulet
leimatthew05
3
16k
Connecting the Dots Between Site Speed, User Experience & Your Business [WebExpo 2025]
tammyeverts
11
1.1k
Leading Effective Engineering Teams in the AI Era
addyosmani
9
2.7k
Reflections from 52 weeks, 52 projects
jeffersonlam
356
22k
Paper Plane (Part 1)
katiecoart
PRO
2
12k
The browser strikes back
jonoalderson
0
1.8k
Site-Speed That Sticks
csswizardry
13
1.6k
Context Engineering - Making Every Token Count
addyosmani
9
1.2k
Transcript
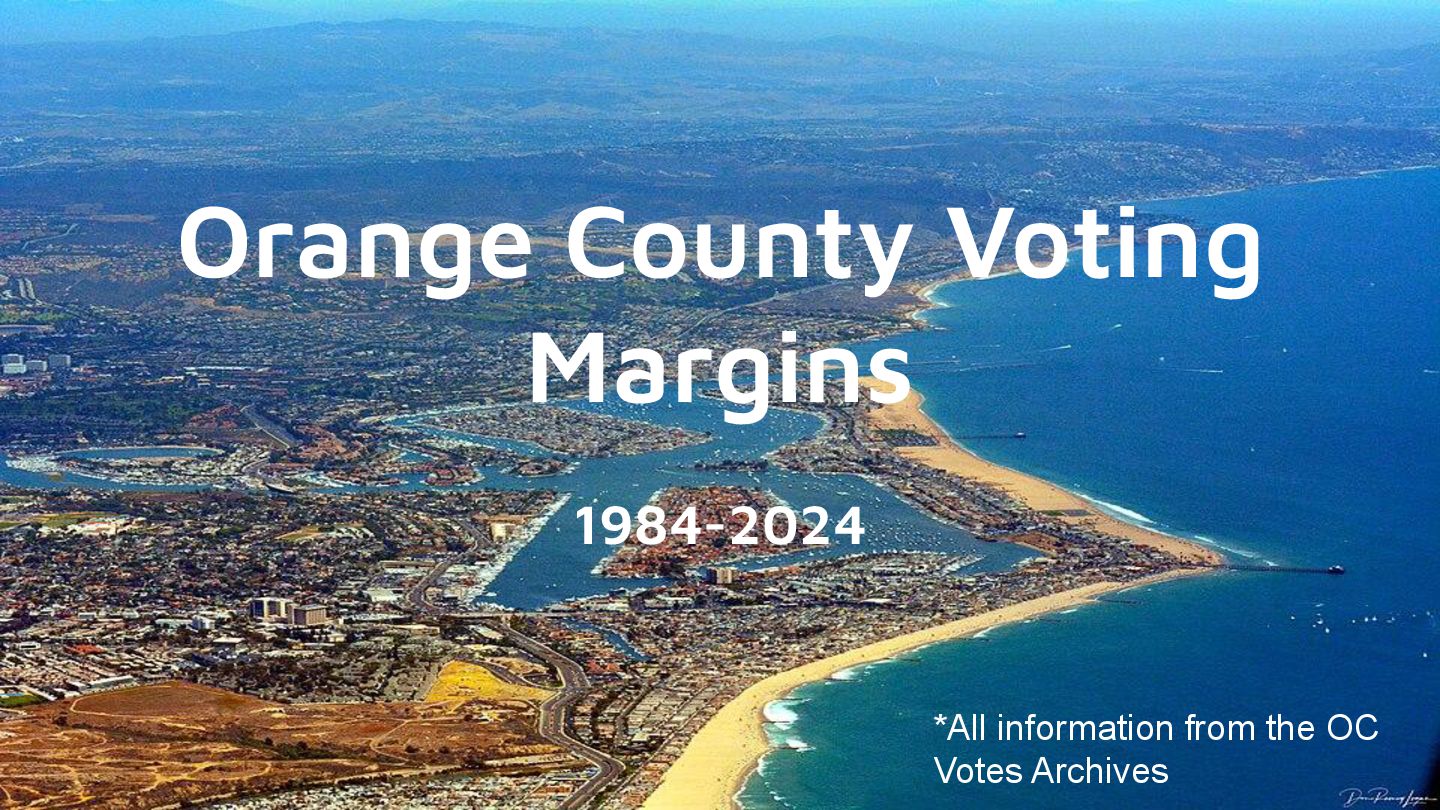
Orange County Voting Margins 1984-2024 *All information from the OC
Votes Archives
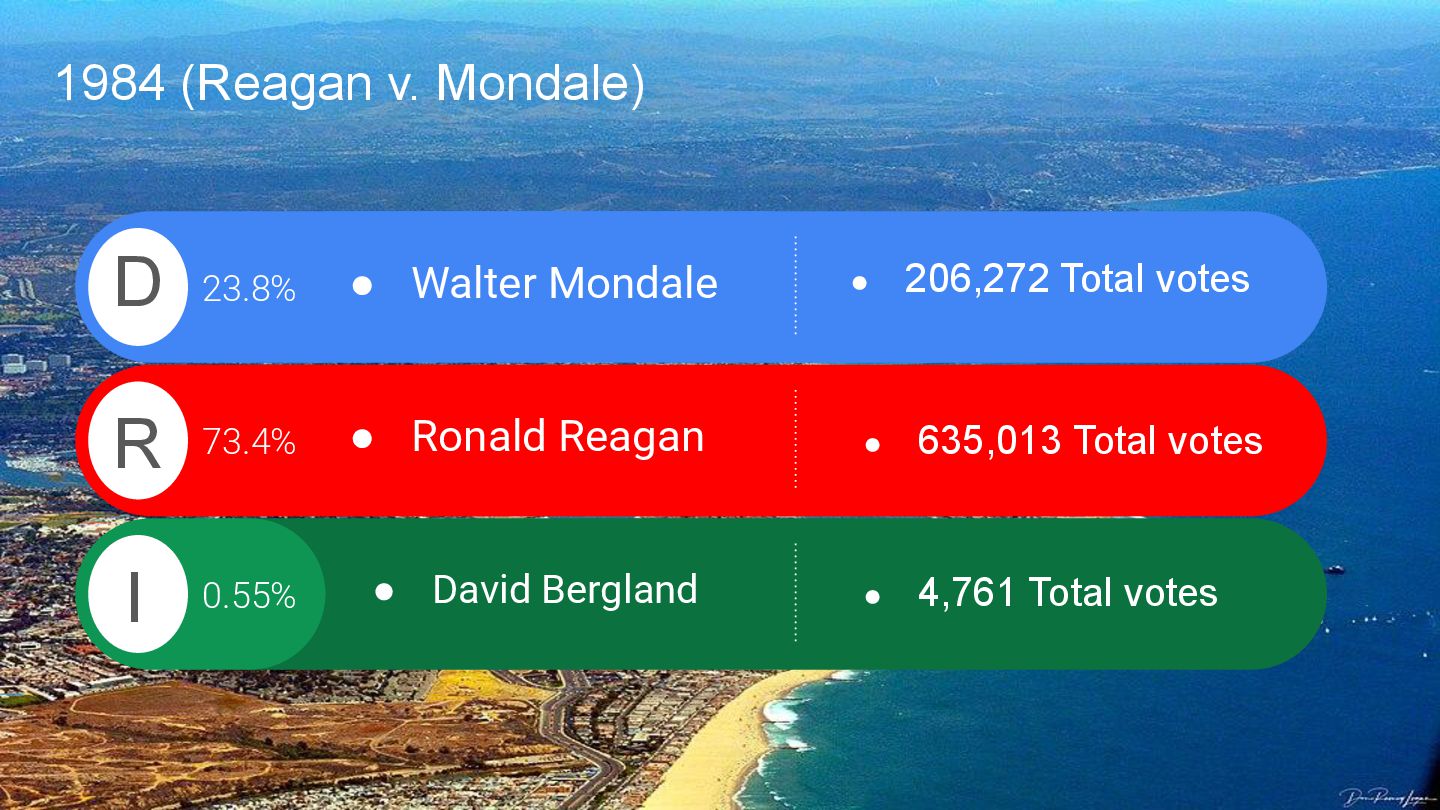
1984 (Reagan v. Mondale) 0.55% • Ronald Reagan 73.4% •
206,272 Total votes • Walter Mondale 23.8% D R I • 635,013 Total votes • David Bergland • 4,761 Total votes
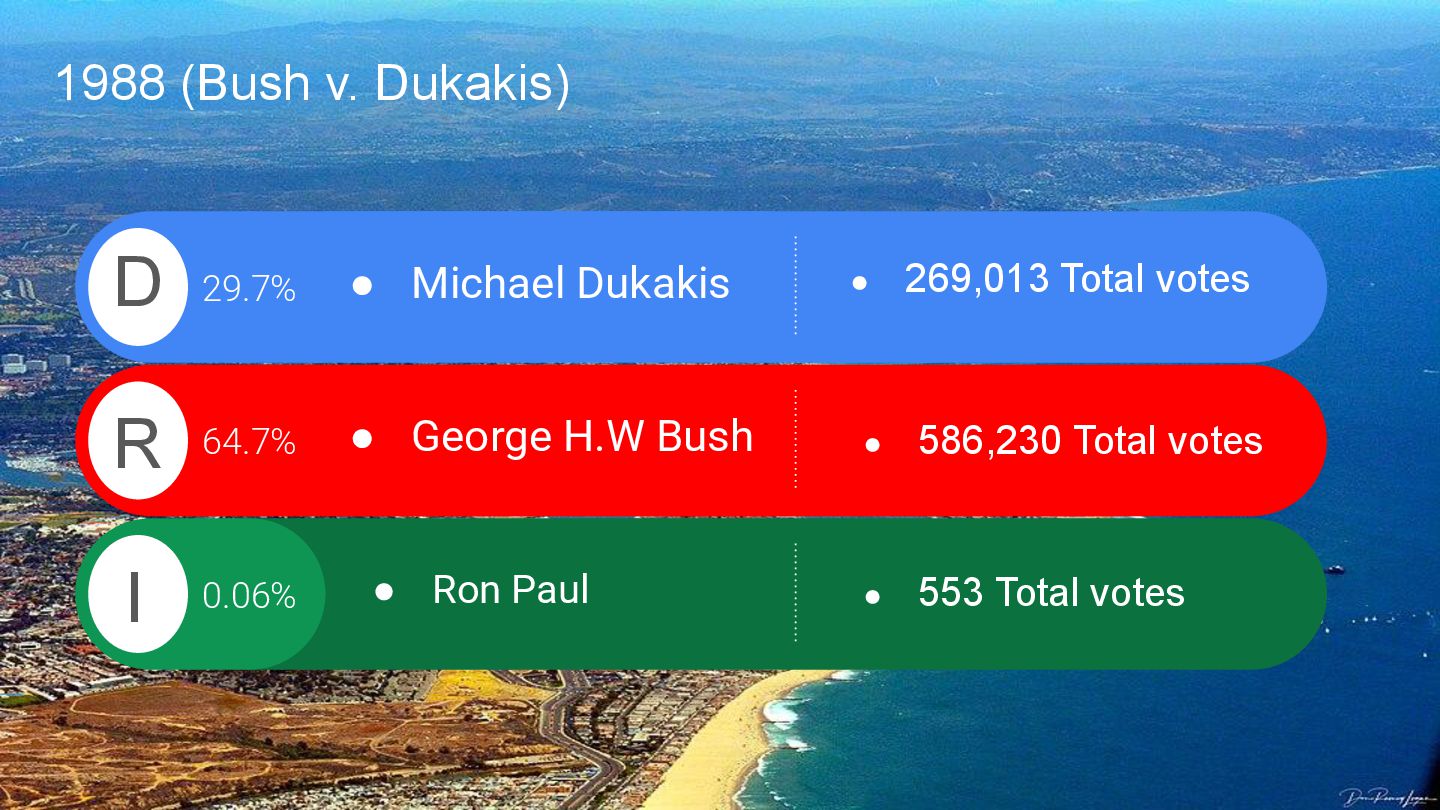
1988 (Bush v. Dukakis) 0.06% • George H.W Bush 64.7%
• 269,013 Total votes • Michael Dukakis 29.7% D R I • 586,230 Total votes • Ron Paul • 553 Total votes
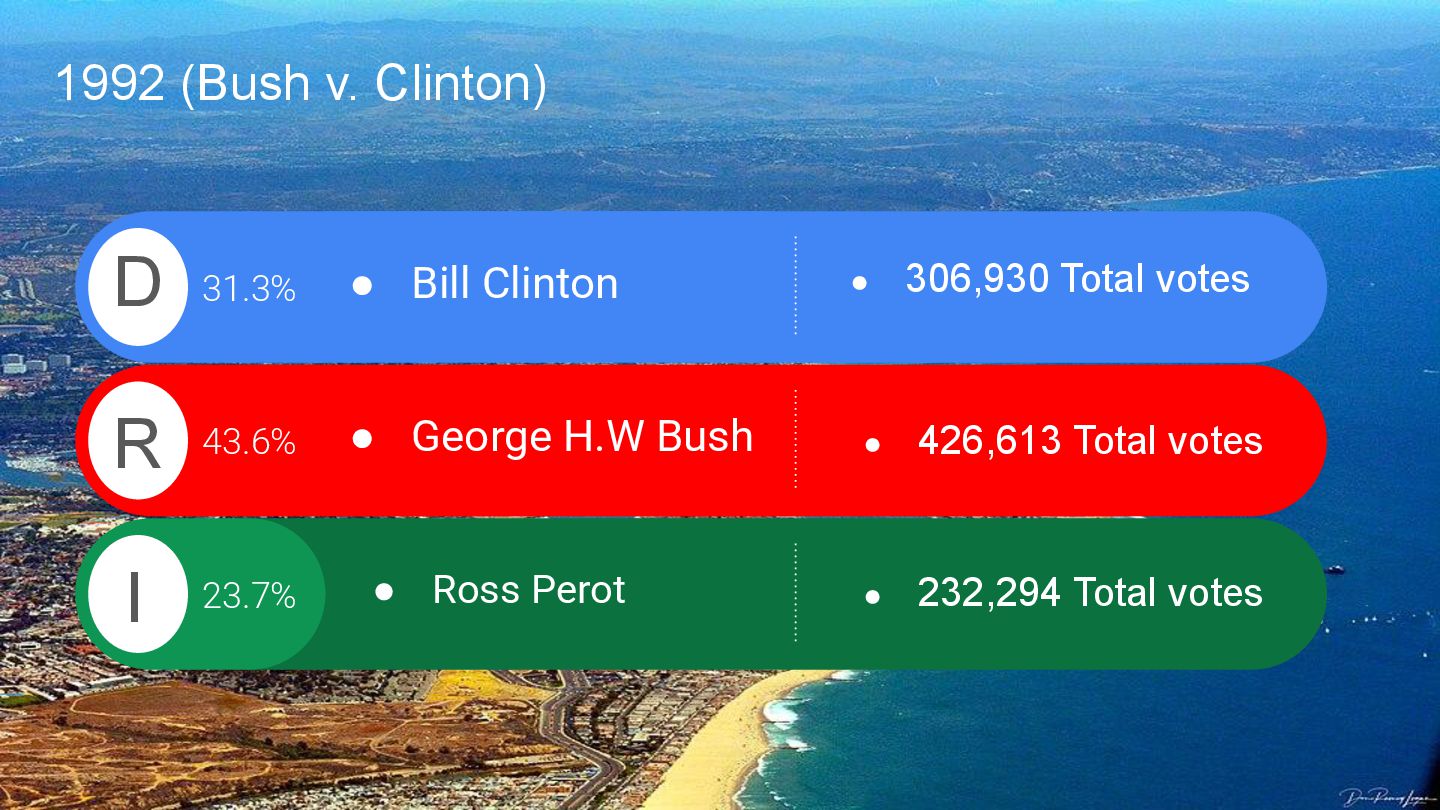
1992 (Bush v. Clinton) 23.7% • George H.W Bush 43.6%
• 306,930 Total votes • Bill Clinton 31.3% D R I • 426,613 Total votes • Ross Perot • 232,294 Total votes
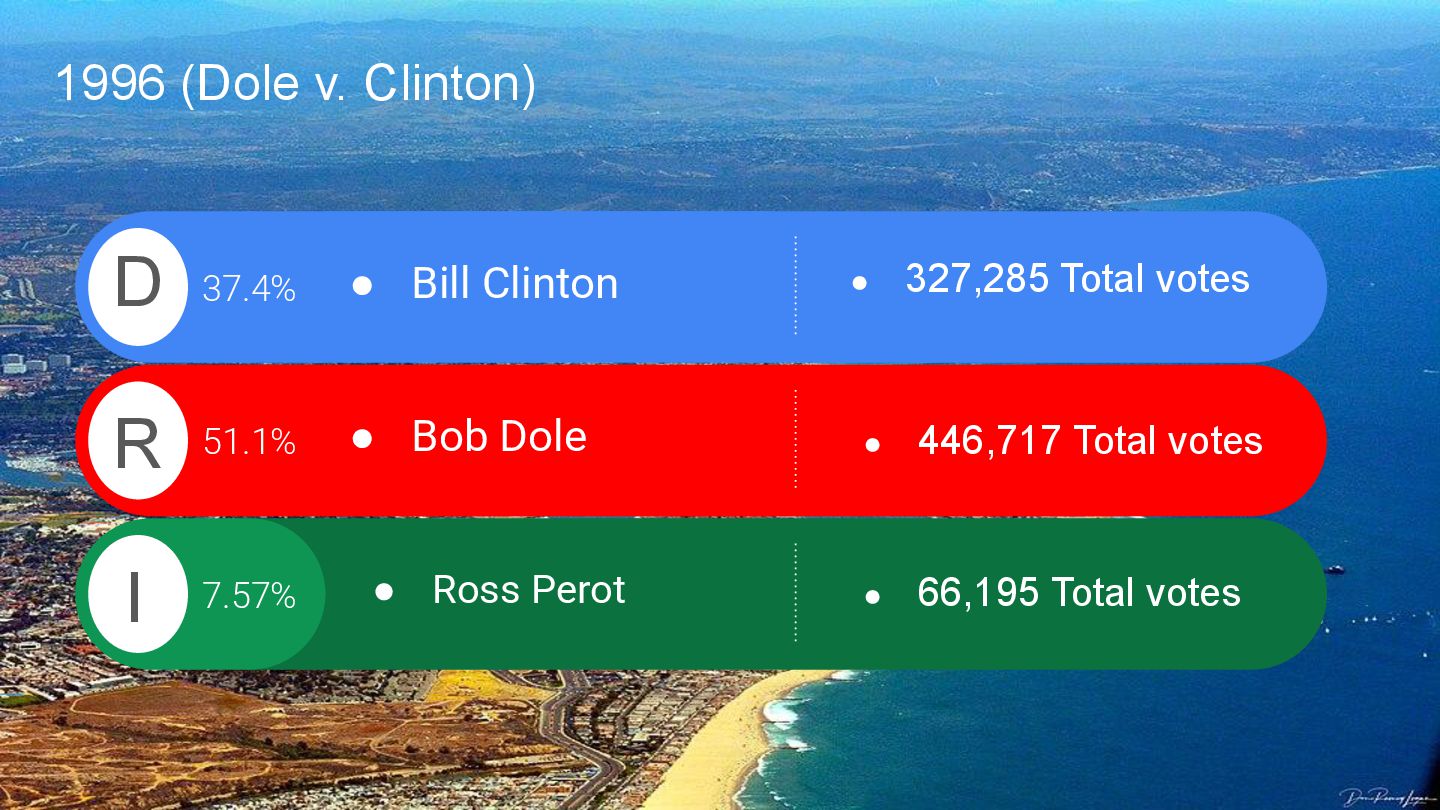
1996 (Dole v. Clinton) 7.57% • Bob Dole 51.1% •
327,285 Total votes • Bill Clinton 37.4% D R I • 446,717 Total votes • Ross Perot • 66,195 Total votes
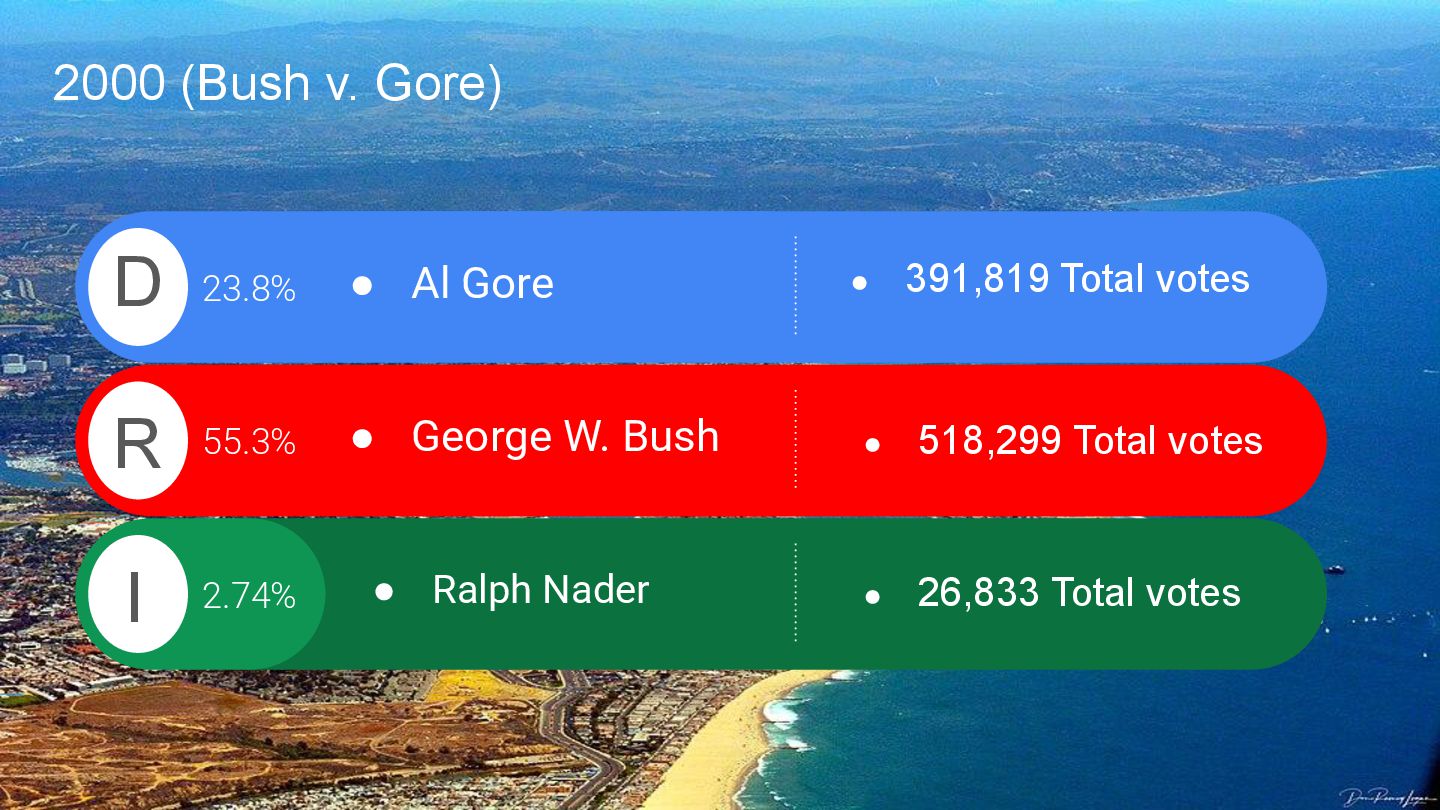
2000 (Bush v. Gore) 2.74% • George W. Bush 55.3%
• 391,819 Total votes • Al Gore 23.8% D R I • 518,299 Total votes • Ralph Nader • 26,833 Total votes
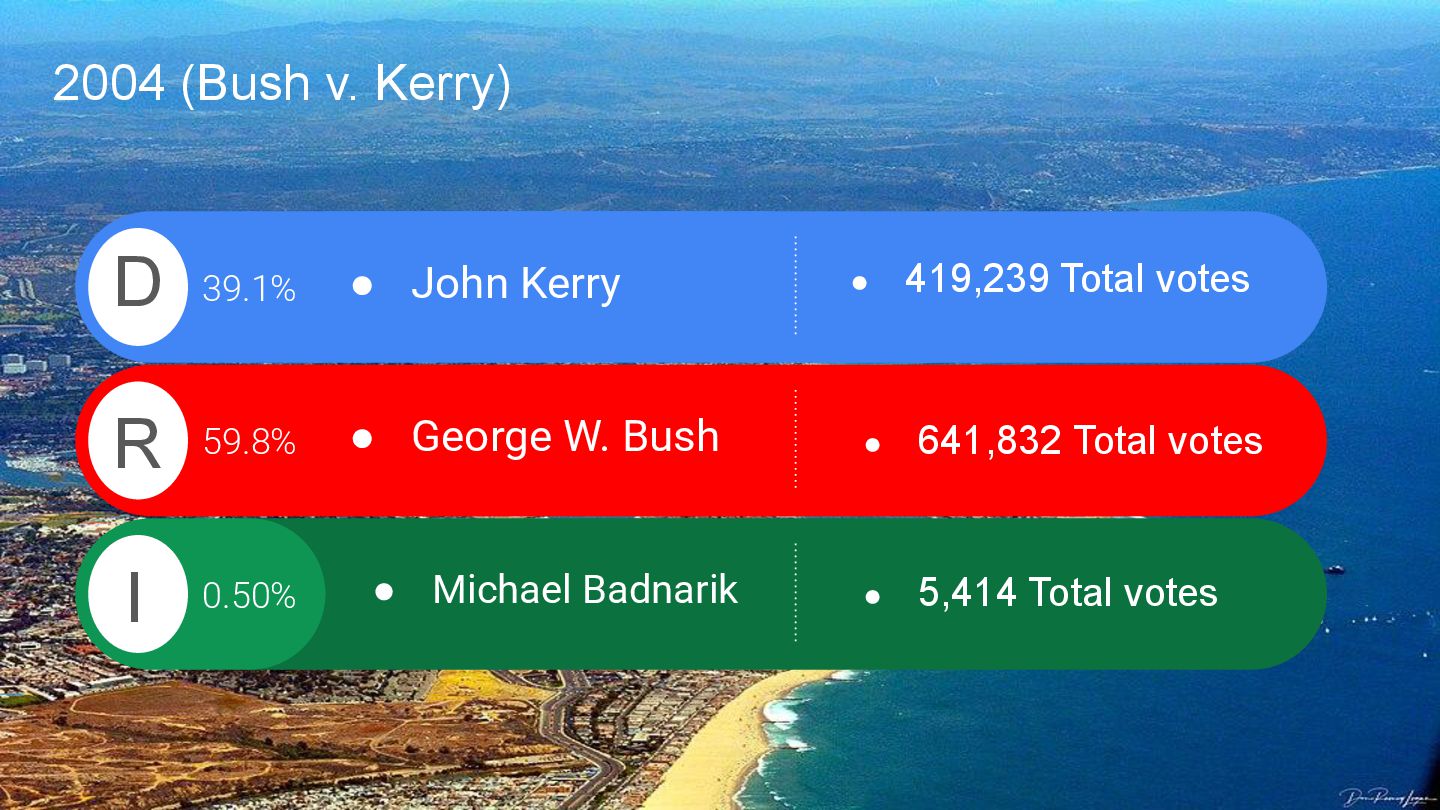
2004 (Bush v. Kerry) 0.50% • George W. Bush 59.8%
• 419,239 Total votes • John Kerry 39.1% D R I • 641,832 Total votes • Michael Badnarik • 5,414 Total votes
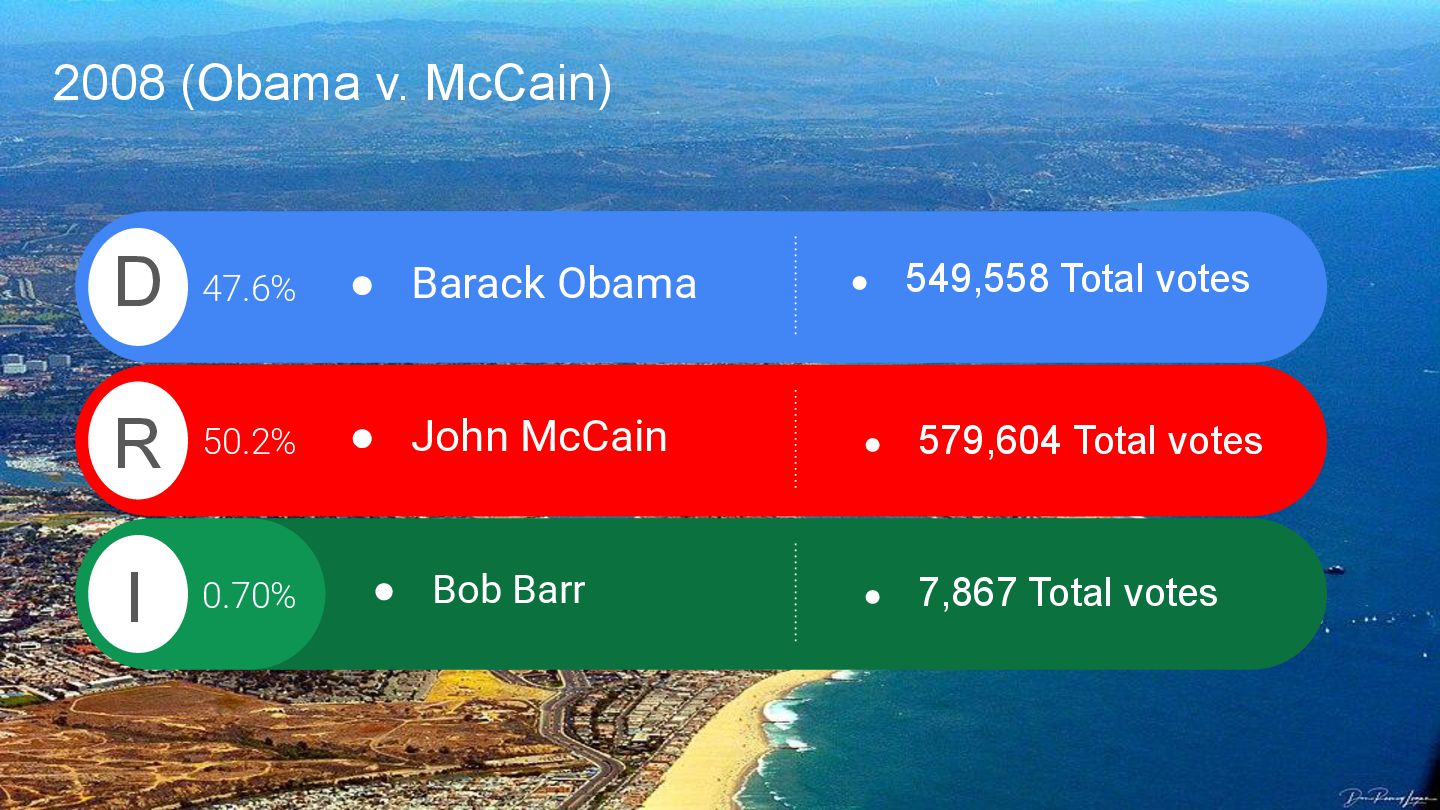
2008 (Obama v. McCain) 0.70% • John McCain 50.2% •
549,558 Total votes • Barack Obama 47.6% D R I • 579,604 Total votes • Bob Barr • 7,867 Total votes
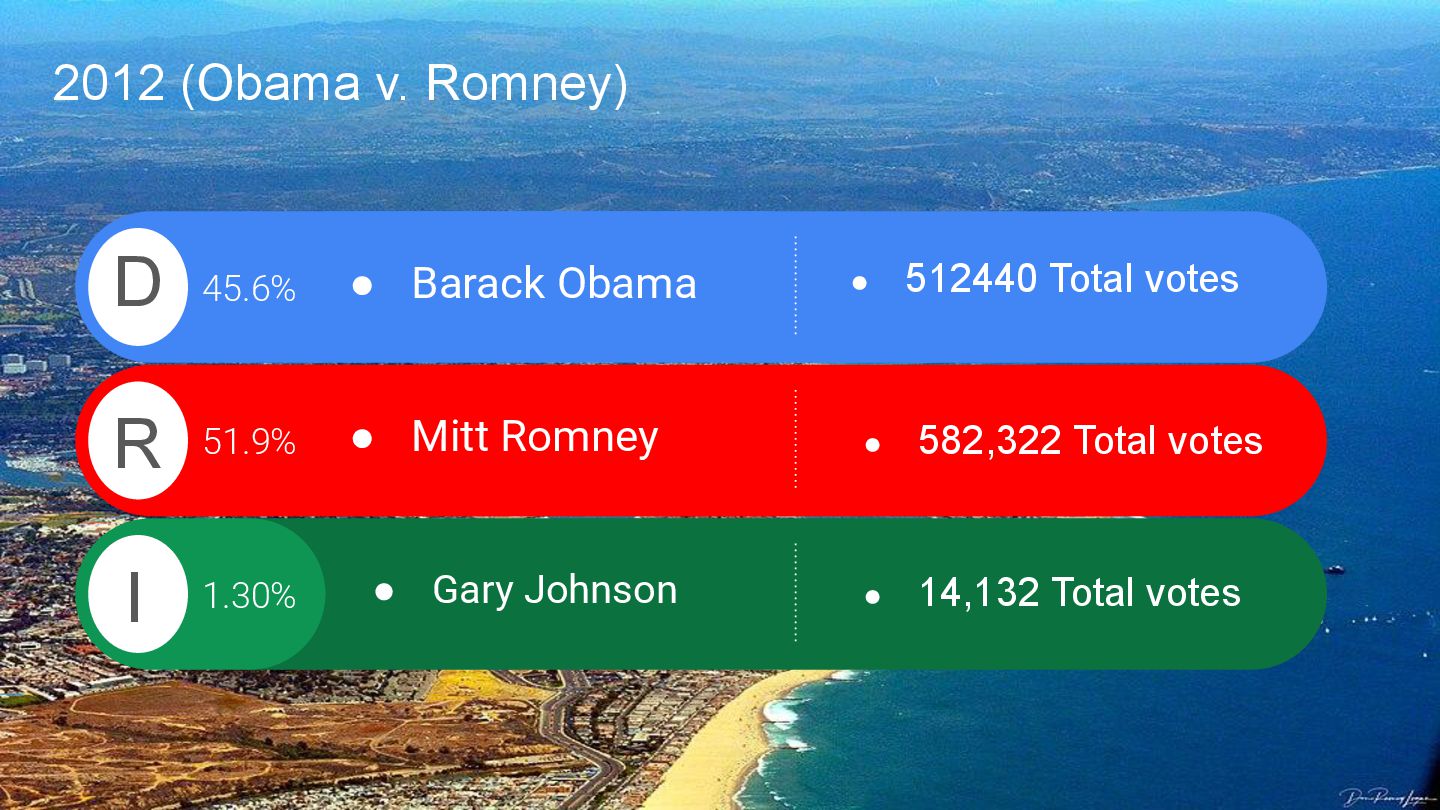
2012 (Obama v. Romney) 1.30% • Mitt Romney 51.9% •
512440 Total votes • Barack Obama 45.6% D R I • 582,322 Total votes • Gary Johnson • 14,132 Total votes
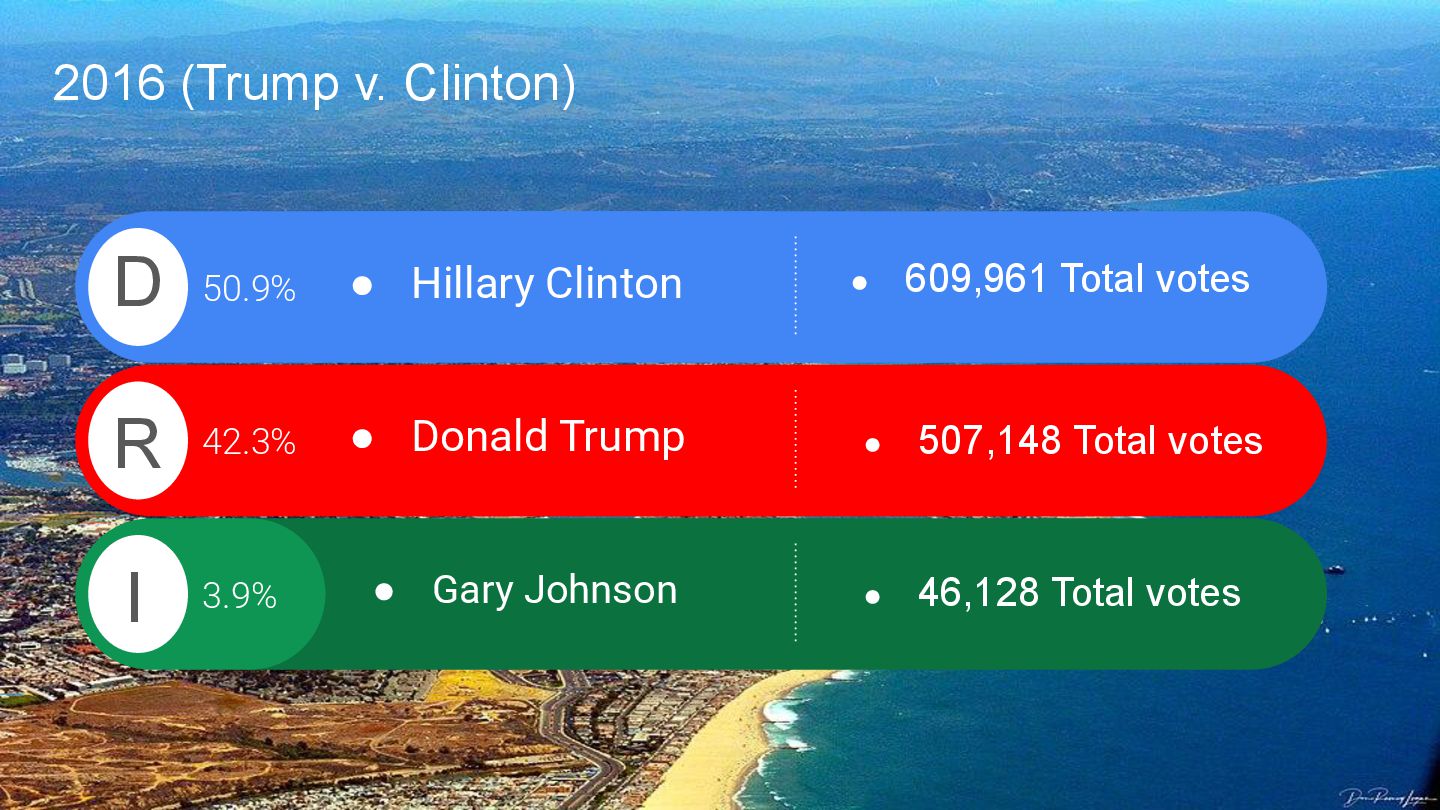
2016 (Trump v. Clinton) 3.9% • Donald Trump 42.3% •
609,961 Total votes • Hillary Clinton 50.9% D R I • 507,148 Total votes • Gary Johnson • 46,128 Total votes
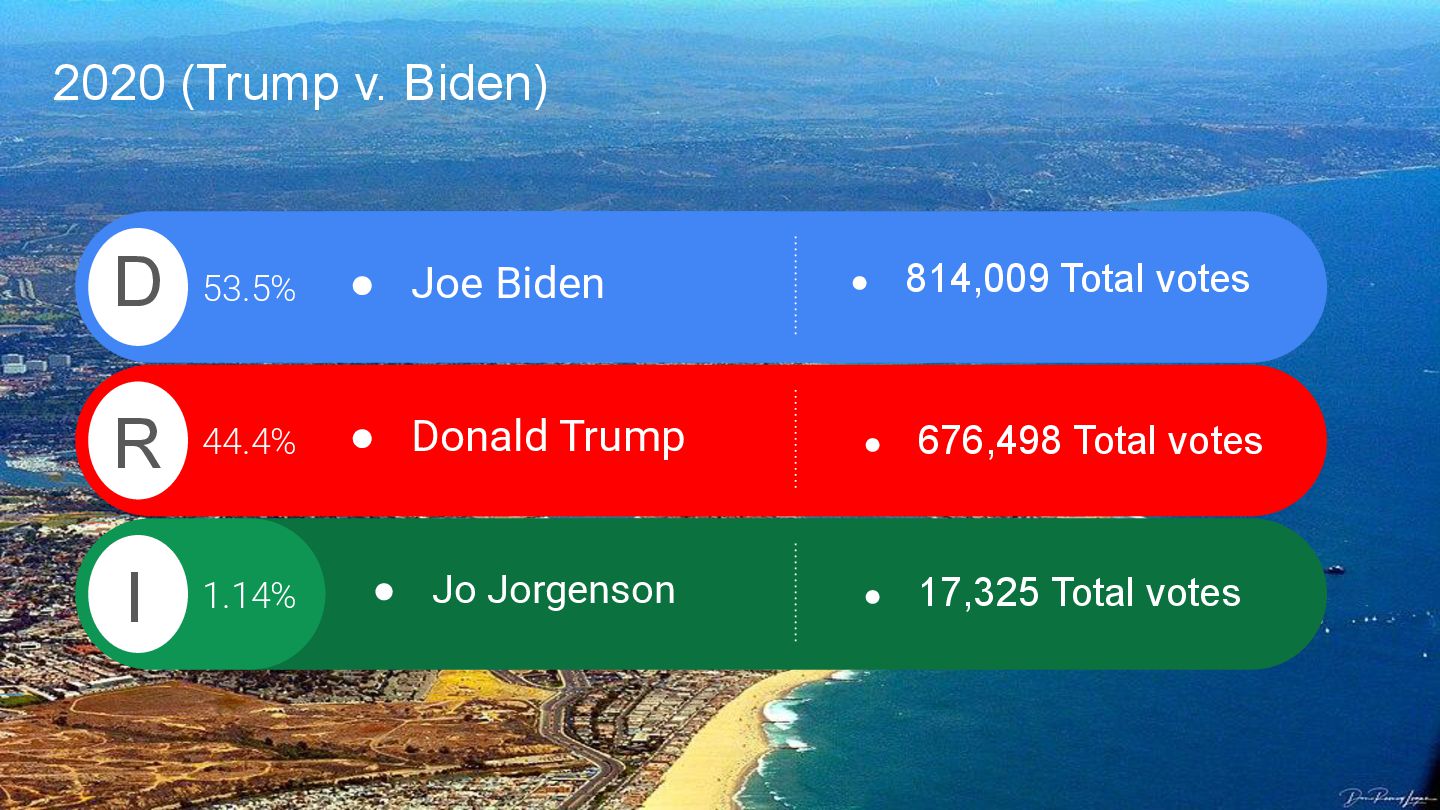
2020 (Trump v. Biden) 1.14% • Donald Trump 44.4% •
814,009 Total votes • Joe Biden 53.5% D R I • 676,498 Total votes • Jo Jorgenson • 17,325 Total votes
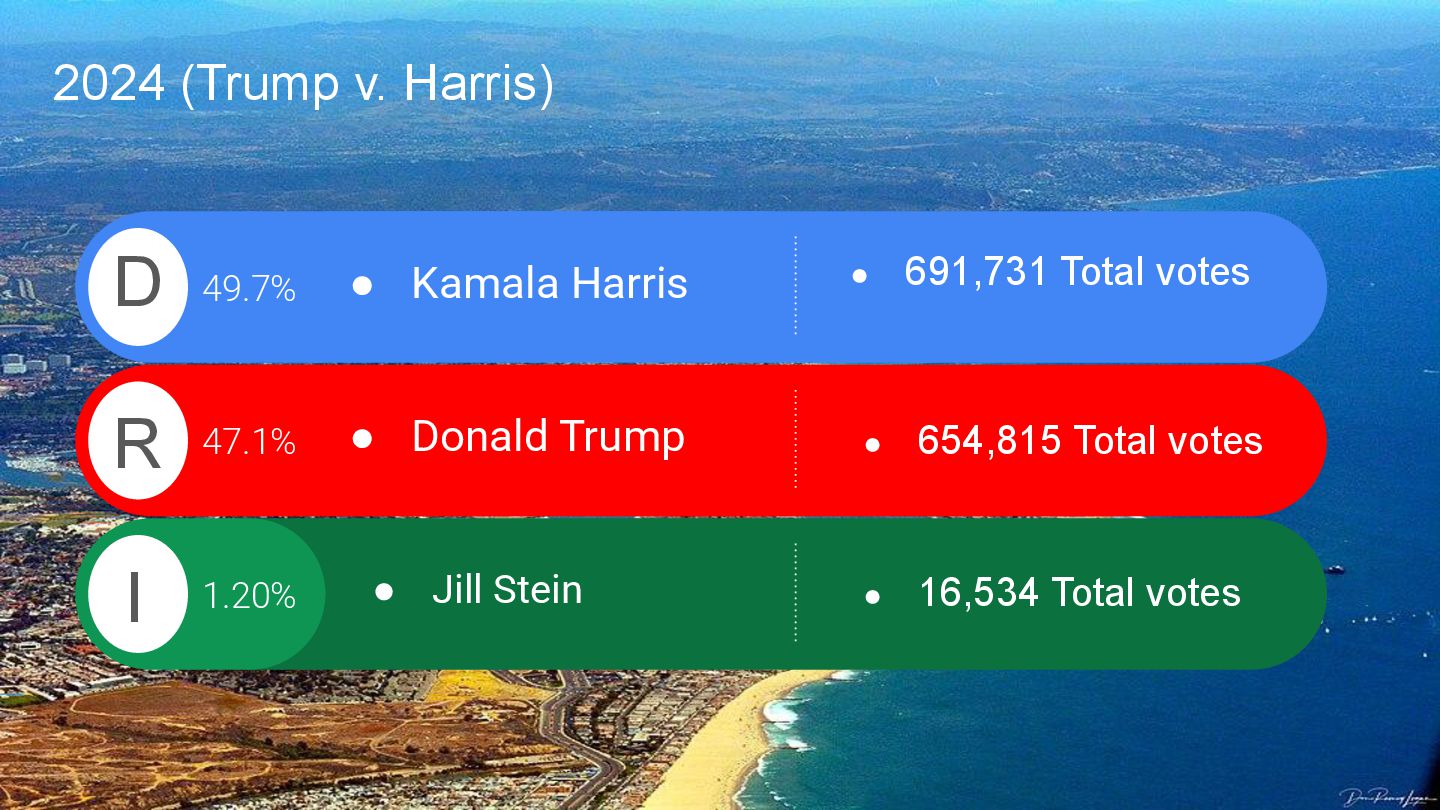
2024 (Trump v. Harris) 1.20% • Donald Trump 47.1% •
691,731 Total votes • Kamala Harris 49.7% D R I • 654,815 Total votes • Jill Stein • 16,534 Total votes


 inesmontani
 codingconduct
 signer
 axbom
 leimatthew05
 tammyeverts
 addyosmani
 jeffersonlam
 katiecoart
 jonoalderson
 csswizardry