A quick Intro. (Hi!). 3. The benefits of Opentelemetry Trace / Log correlation. 4. An Example in Ruby and Sinatra 🙃 5. Surprise Guest Closing Remarks What can you expect from this talk?
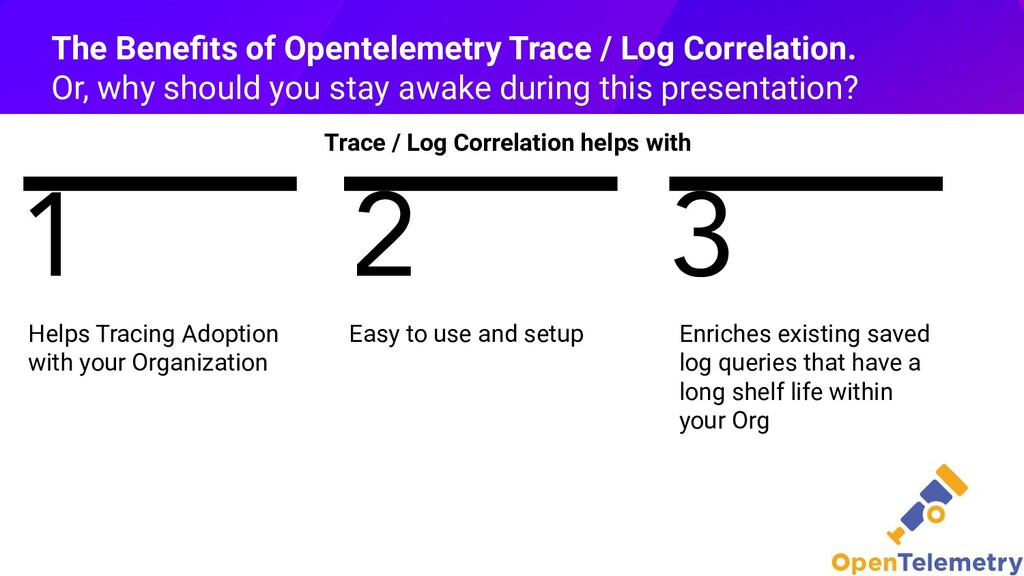
Trace / Log Correlation. Or, why should you stay awake during this presentation? 1 2 3 Helps Tracing Adoption with your Organization Easy to use and setup Enriches existing saved log queries that have a long shelf life within your Org
• While Eng Mgmt/Platform/Observability teams may be convinced of the value of tracing as an observability tool, it can still be hard to convince an IC to change their development habits. • Example: Even something as simple as "Don't add a debug log, add a span event" requires a developer to: i. Grok new terminology (what is a span event? Is it a synonym for an embedded log?) ii. Learn new semantic conventions (What should a span event be named? Do errors/exceptions have special conventions? Which attributes have semantic meaning?) iii. Learn a new API (How do i access the current active Span context? What corner cases should I be aware of? Etc) The Benefits of Opentelemetry Trace / Log Correlation. 1. Tracing Adoption within your Organization
Adoption creates a number of internal and community benefits. ◦ Easier long term migrations and interoperability between libraries, languages, and vendor tooling. ◦ The more orgs that adopt OpenTelemetry increases the likelihood that library authors, cloud providers, etc will choose to add 1st class support for Opentelemetry. ◦ Reduces the number of competing standards an org has to keep track of, or maintain expertise in. • Trace Log Correlation reduces adoption hurdles. Meet developers where they are. ◦ Not everyone is familiar with tracing, but nearly everyone is familiar with logging. ◦ Log / Trace Correlation positions tracing as a complementary tool instead of a replacement tool The Benefits of Opentelemetry Trace / Log Correlation. 1. Tracing Adoption within your Organization - Continued
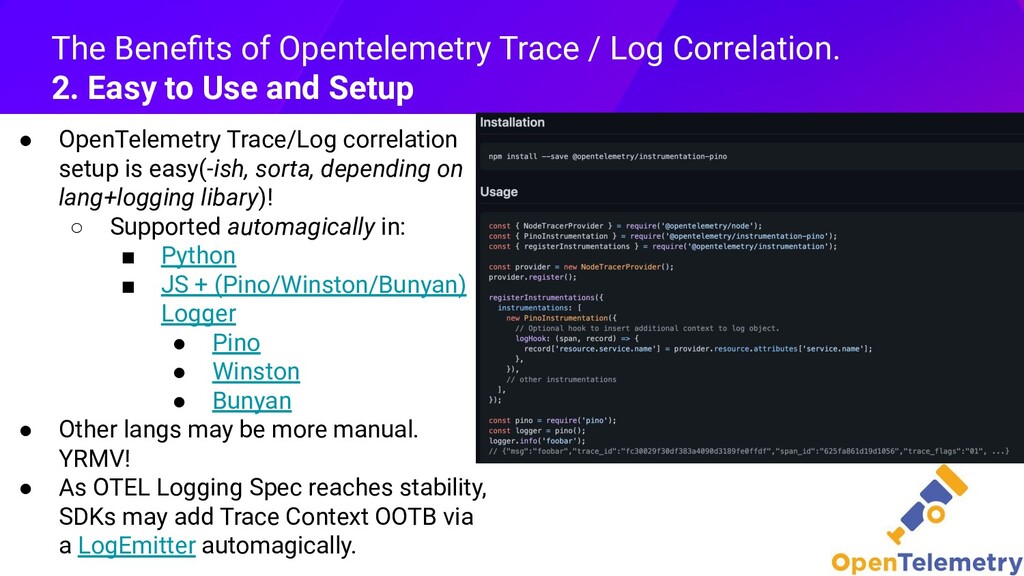
lang+logging libary)! ◦ Supported automagically in: ▪ Python ▪ JS + (Pino/Winston/Bunyan) Logger • Pino • Winston • Bunyan • Other langs may be more manual. YRMV! • As OTEL Logging Spec reaches stability, SDKs may add Trace Context OOTB via a LogEmitter automagically. The Benefits of Opentelemetry Trace / Log Correlation. 2. Easy to Use and Setup
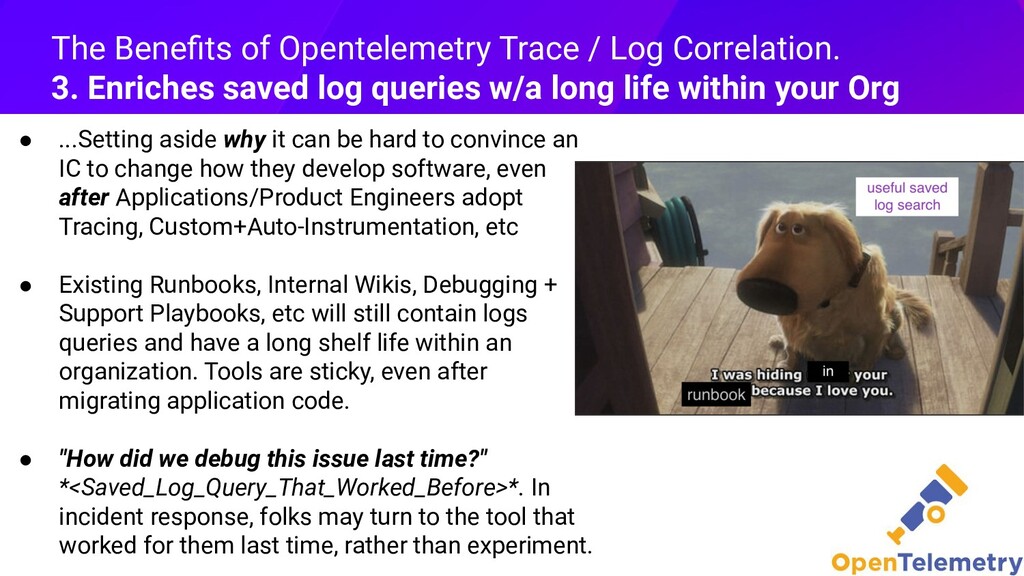
an IC to change how they develop software, even after Applications/Product Engineers adopt Tracing, Custom+Auto-Instrumentation, etc • Existing Runbooks, Internal Wikis, Debugging + Support Playbooks, etc will still contain logs queries and have a long shelf life within an organization. Tools are sticky, even after migrating application code. • "How did we debug this issue last time?" *<Saved_Log_Query_That_Worked_Before>*. In incident response, folks may turn to the tool that worked for them last time, rather than experiment. The Benefits of Opentelemetry Trace / Log Correlation. 3. Enriches saved log queries w/a long life within your Org
◦ Whomst could’ve guessed the root cause was...this super obvious typo! What a magical tool! shutup-and-take-my-money-meme.gif • Production systems are more nuanced than what I can represent in a demo. ◦ All I can do is speak from limited lived experience, and try to create a simplified scenarios that readers/listeners can abstract/apply to their own env and code. • This example is vendor agnostic, you can use many tools for search, storage, and discovery of your Observability data. • Examples may significantly change as OTLP Logging Specification become GA, but it’s not there just yet. (Getting there tho! Hold tight! 🤞) An Example in Sinatra 1. Some caveats about example code
a web framework. ◦ Emits traces to an OpenTelemetry Collector, configured with a vendor exporter ◦ Emits logs to fluent bit ◦ Includes OpenTelemetry-Ruby SDK Auto Instrumentation • The example application repository can be found here ◦ The app generates a bulk report. Specifically, it searches the github API for open issues and pull requests within the open-telemetry organization that match a list of keywords. ◦ It formats the issues into a report. ◦ It is meant to represent a legacy application. There’s some logging of errors, but not much detail. An Example in Sinatra 2. Example Application walkthrough
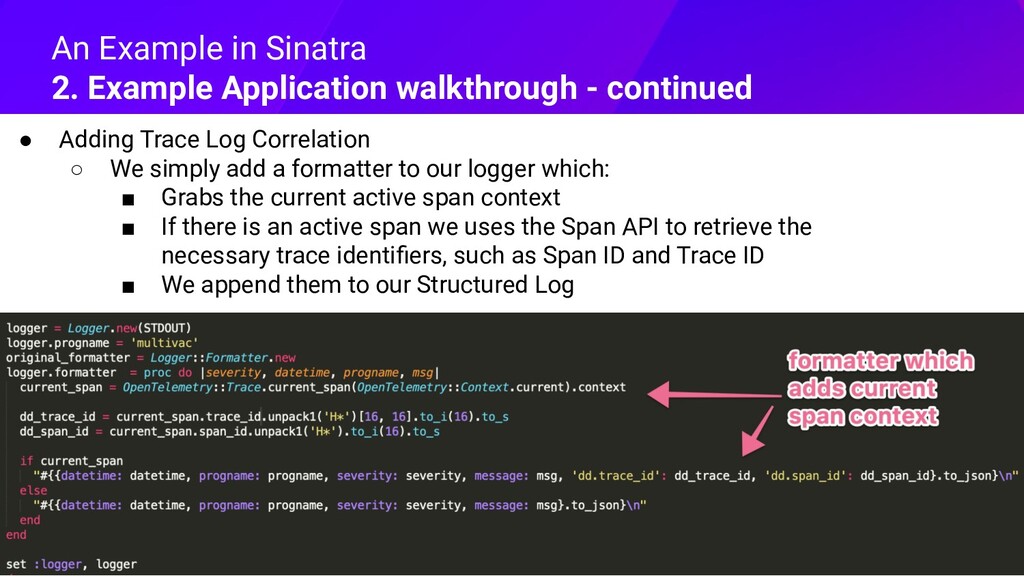
formatter to our logger which: ▪ Grabs the current active span context ▪ If there is an active span we uses the Span API to retrieve the necessary trace identifiers, such as Span ID and Trace ID ▪ We append them to our Structured Log An Example in Sinatra 2. Example Application walkthrough - continued
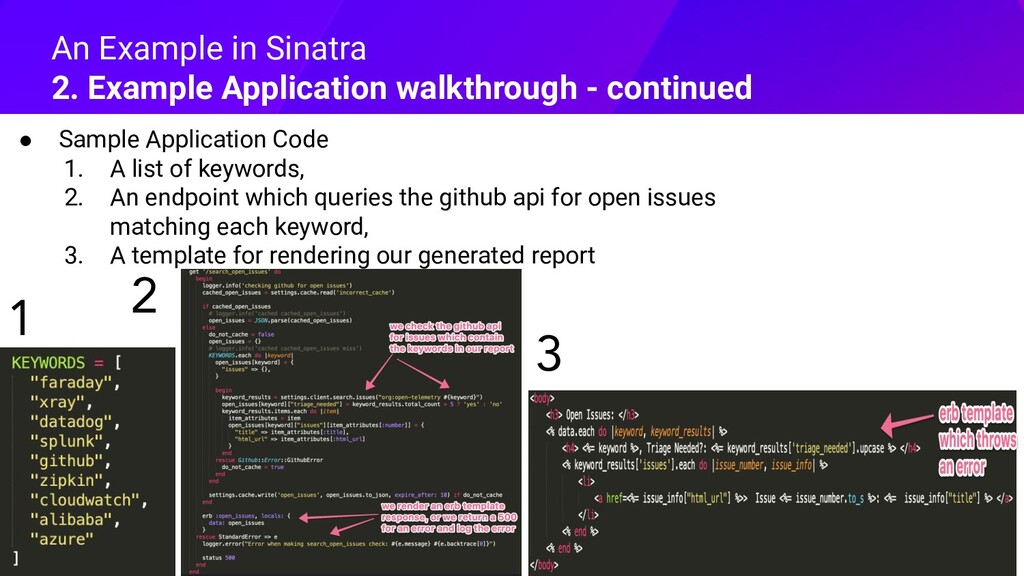
An endpoint which queries the github api for open issues matching each keyword, 3. A template for rendering our generated report An Example in Sinatra 2. Example Application walkthrough - continued 1 2 3
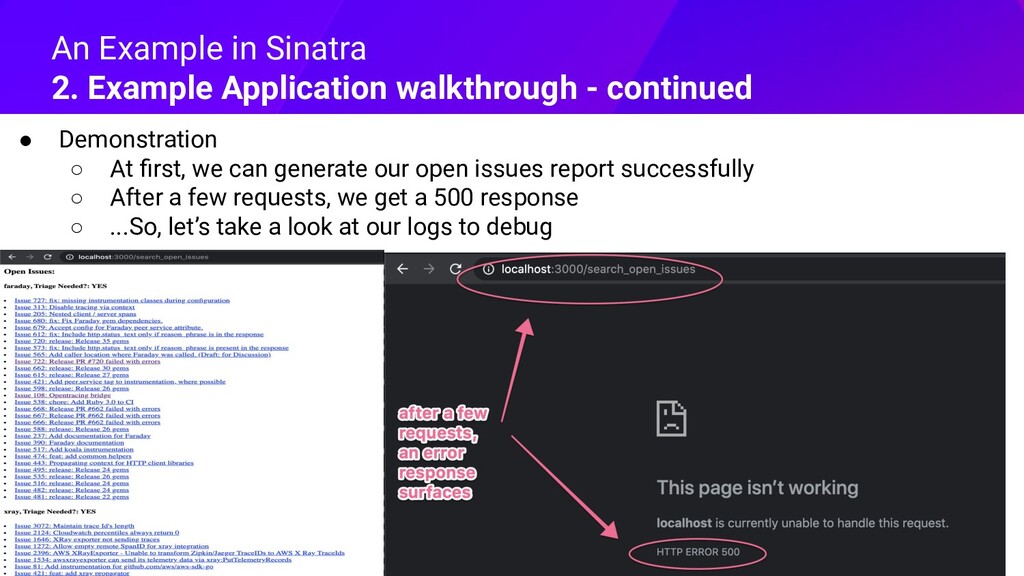
issues report successfully ◦ After a few requests, we get a 500 response ◦ ...So, let’s take a look at our logs to debug An Example in Sinatra 2. Example Application walkthrough - continued
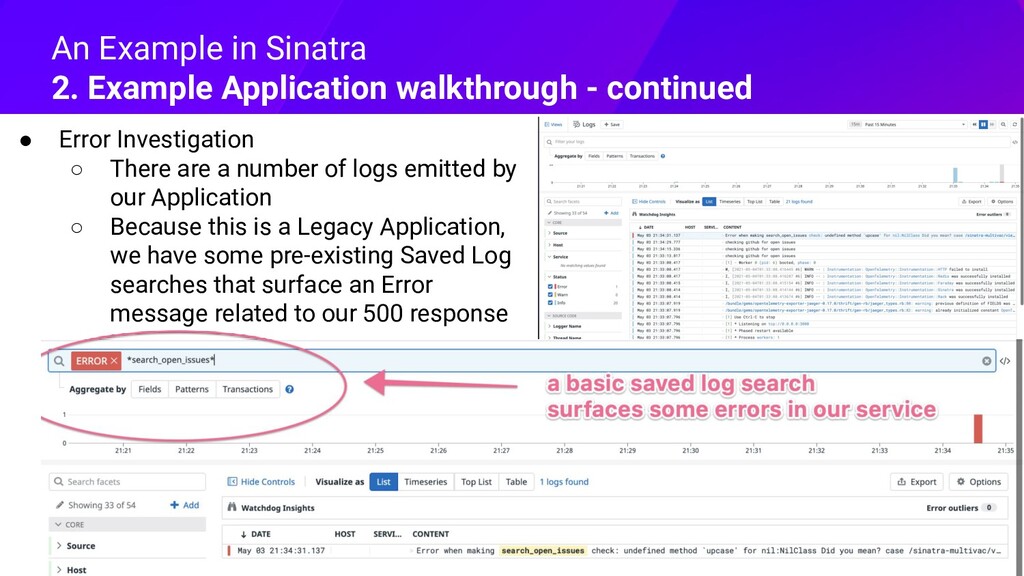
emitted by our Application ◦ Because this is a Legacy Application, we have some pre-existing Saved Log searches that surface an Error message related to our 500 response An Example in Sinatra 2. Example Application walkthrough - continued
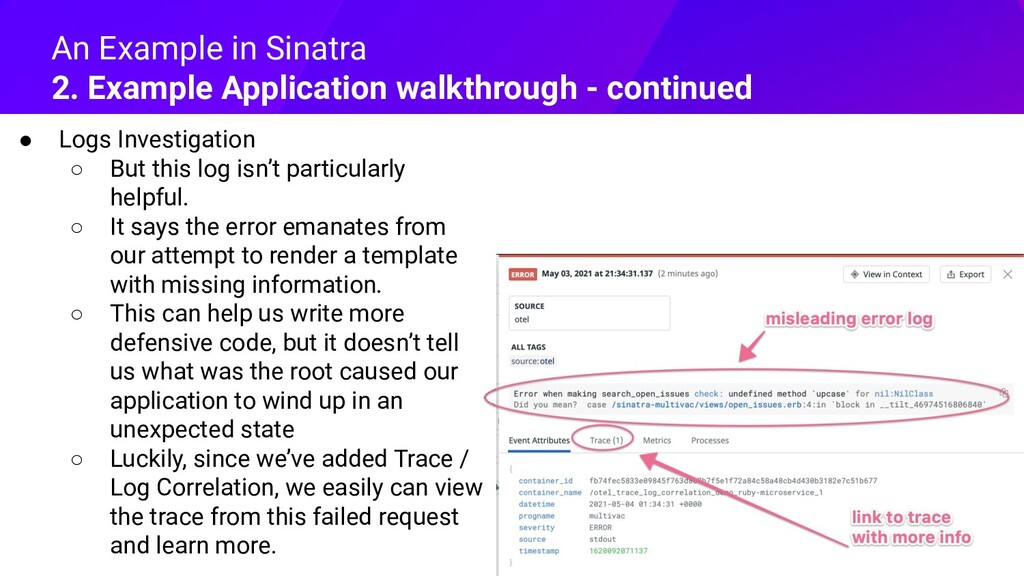
◦ It says the error emanates from our attempt to render a template with missing information. ◦ This can help us write more defensive code, but it doesn’t tell us what was the root caused our application to wind up in an unexpected state ◦ Luckily, since we’ve added Trace / Log Correlation, we easily can view the trace from this failed request and learn more. An Example in Sinatra 2. Example Application walkthrough - continued
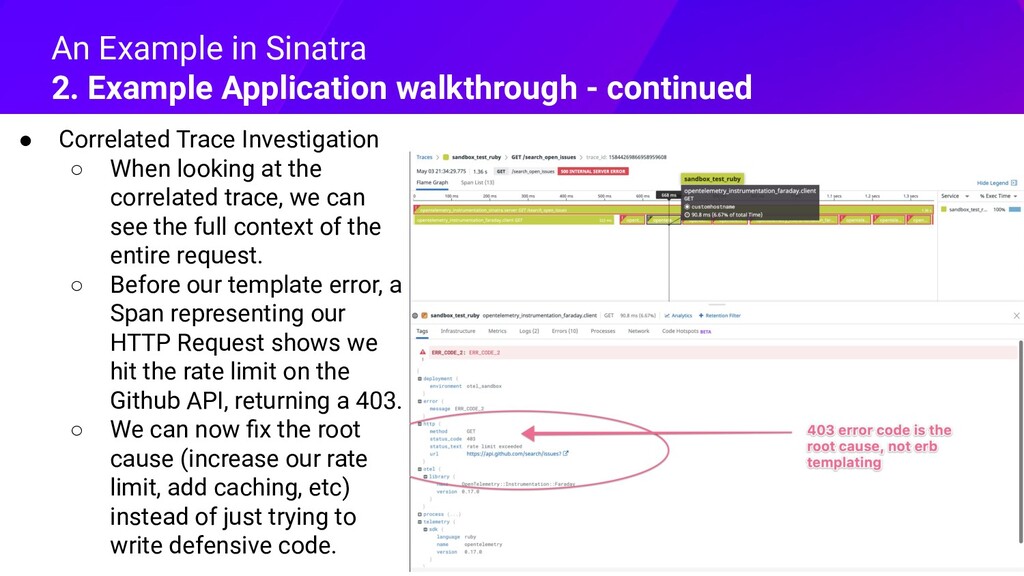
trace, we can see the full context of the entire request. ◦ Before our template error, a Span representing our HTTP Request shows we hit the rate limit on the Github API, returning a 403. ◦ We can now fix the root cause (increase our rate limit, add caching, etc) instead of just trying to write defensive code. An Example in Sinatra 2. Example Application walkthrough - continued
an Observability tool into teams that normally rely on Logs for Observability. • It’s relatively easy to setup, with many language SDKs, and in the future the OTEL Logging Spec, treating it as a 1st Class citizen . • Debugging via searching Logs can be very sticky in an organization, OpenTelemetry Trace / Log Corrrelation provides a path forward for those use cases. • When dealing with a Legacy Application, Logging may not be telling the full picture. Connecting Logs to Traces helps address hidden root causes. Wrap up + Surprise Guest Closing Remarks The surprise guest is, David S Pumpkins, obscure SNL sketch character from 2016.


 koukihosaka
 satomasahiro2005
 ueponx
 kentarofujii
 mhrtech
 jyouryuusui
 teamlab
 yut0naga1_fa
 willnet
 camiha
 takuroabe
 kentapapa
 keavy
 axbom
 vanstee
 helmedeiros
 matthewcrist
 reverentgeek
 marcoroth
 tammyeverts
 uxyall
 leimatthew05
 baasie