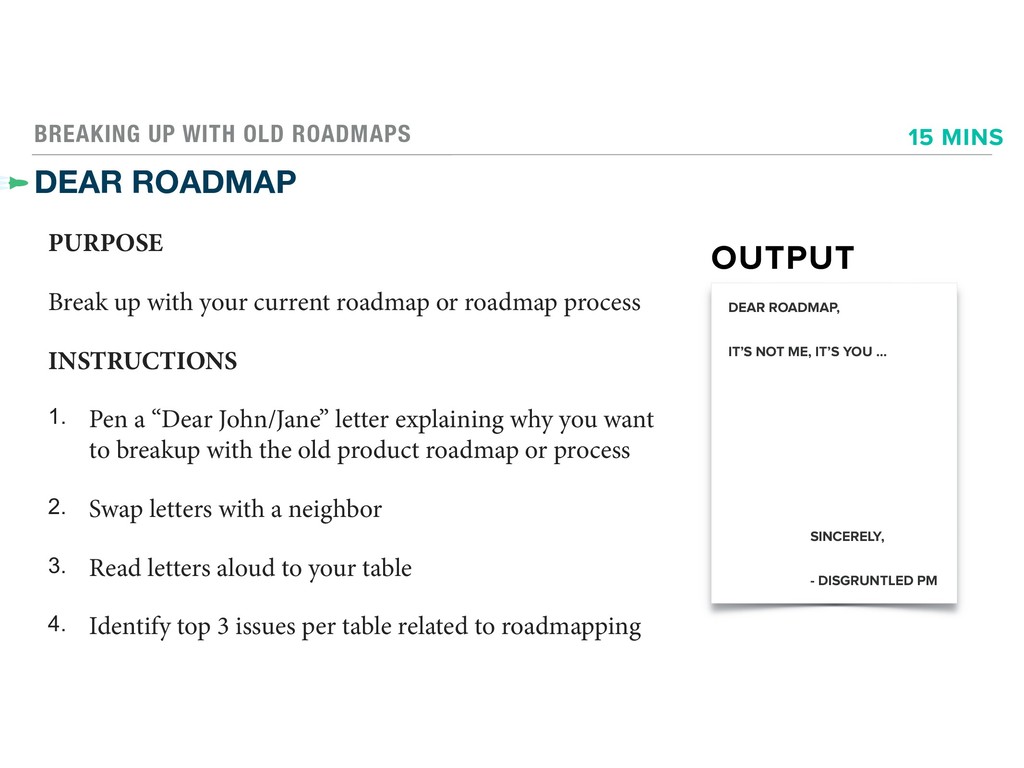
with your current roadmap or roadmap process INSTRUCTIONS 1. Pen a “Dear John/Jane” letter explaining why you want to breakup with the old product roadmap or process 2. Swap letters with a neighbor 3. Read letters aloud to your table 4. Identify top 3 issues per table related to roadmapping OUTPUT DEAR ROADMAP, IT’S NOT ME, IT’S YOU … SINCERELY, - DISGRUNTLED PM 15 MINS
process ‣ Not tied to business strategy ‣ Not enough customer input ‣ Lack of stakeholder alignment ‣ Unclear prioritization ‣ Broken promises ‣ Overly incremental ‣ “Shiny object syndrome” ‣ No clearly defined target ‣ Poor use of data ‣ “Groundhog Day”
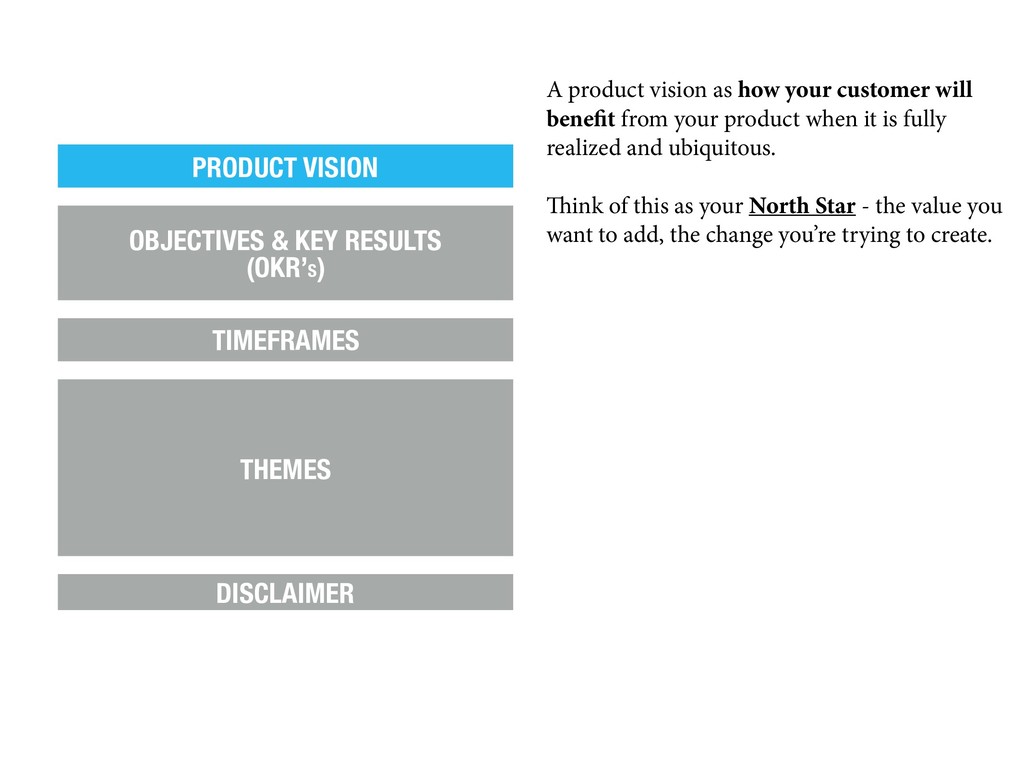
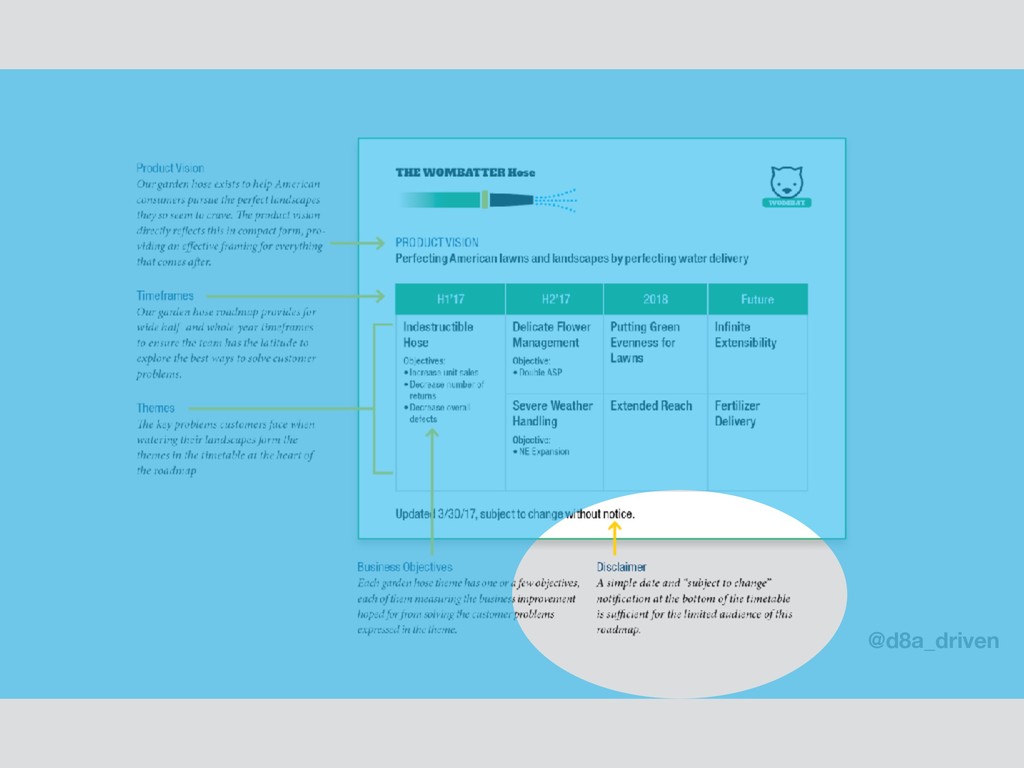
A product vision as how your customer will benefit from your product when it is fully realized and ubiquitous. Think of this as your North Star - the value you want to add, the change you’re trying to create.
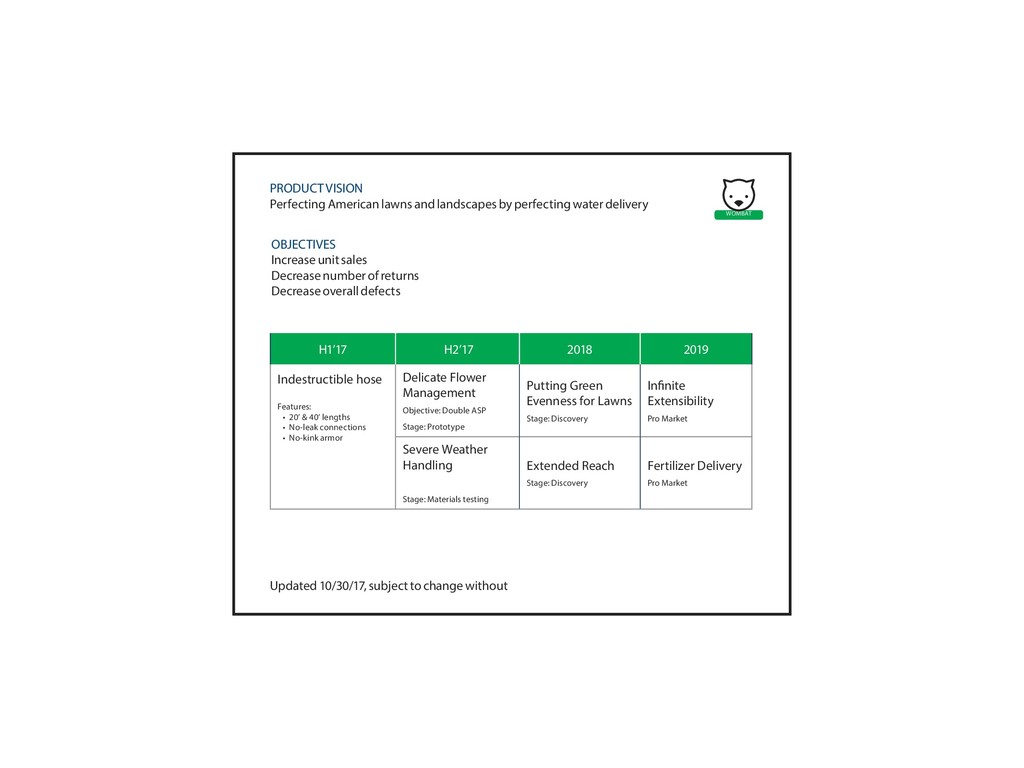
40’ lengths • No-leak connections • No-kink armor Delicate Flower Management Objective: Double ASP Stage: Prototype Putting Green Evenness for Lawns Stage: Discovery Infinite Extensibility Pro Market Severe Weather Handling Stage: Materials testing Extended Reach Stage: Discovery Fertilizer Delivery Pro Market OBJECTIVES Increase unit sales Decrease number of returns Decrease overall defects PRODUCT VISION Perfecting American lawns and landscapes by perfecting water delivery Updated 10/30/17, subject to change without WOMBAT
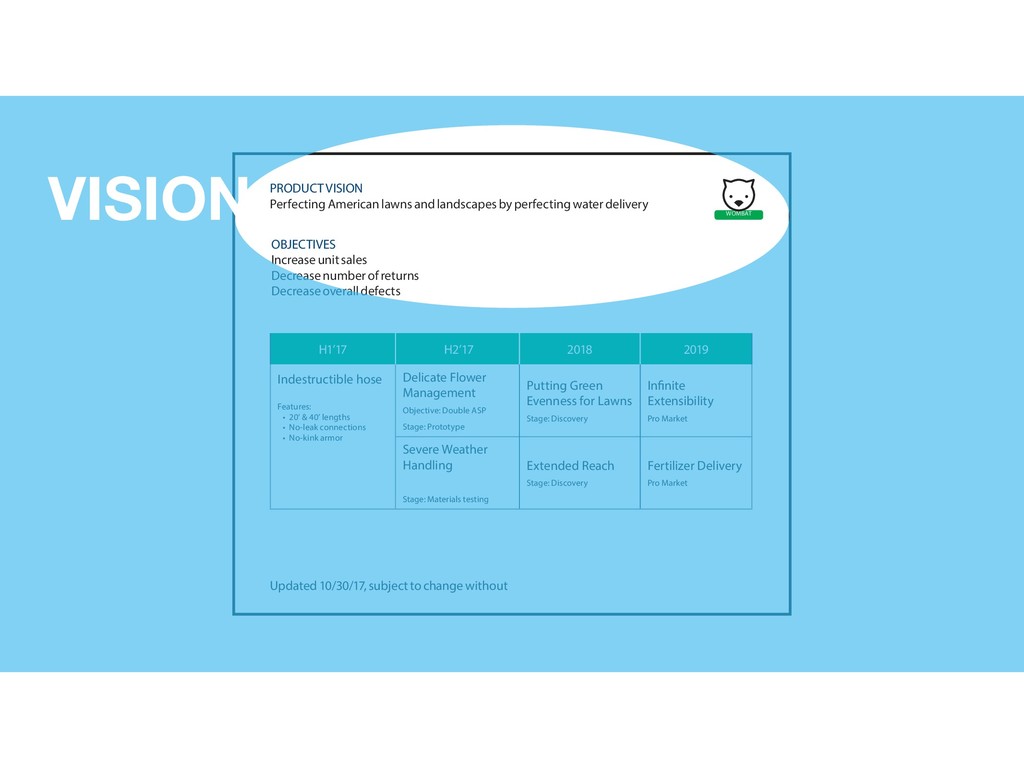
40’ lengths • No-leak connections • No-kink armor Delicate Flower Management Objective: Double ASP Stage: Prototype Putting Green Evenness for Lawns Stage: Discovery Infinite Extensibility Pro Market Severe Weather Handling Stage: Materials testing Extended Reach Stage: Discovery Fertilizer Delivery Pro Market OBJECTIVES Increase unit sales Decrease number of returns Decrease overall defects PRODUCT VISION Perfecting American lawns and landscapes by perfecting water delivery Updated 10/30/17, subject to change without WOMBAT VISION
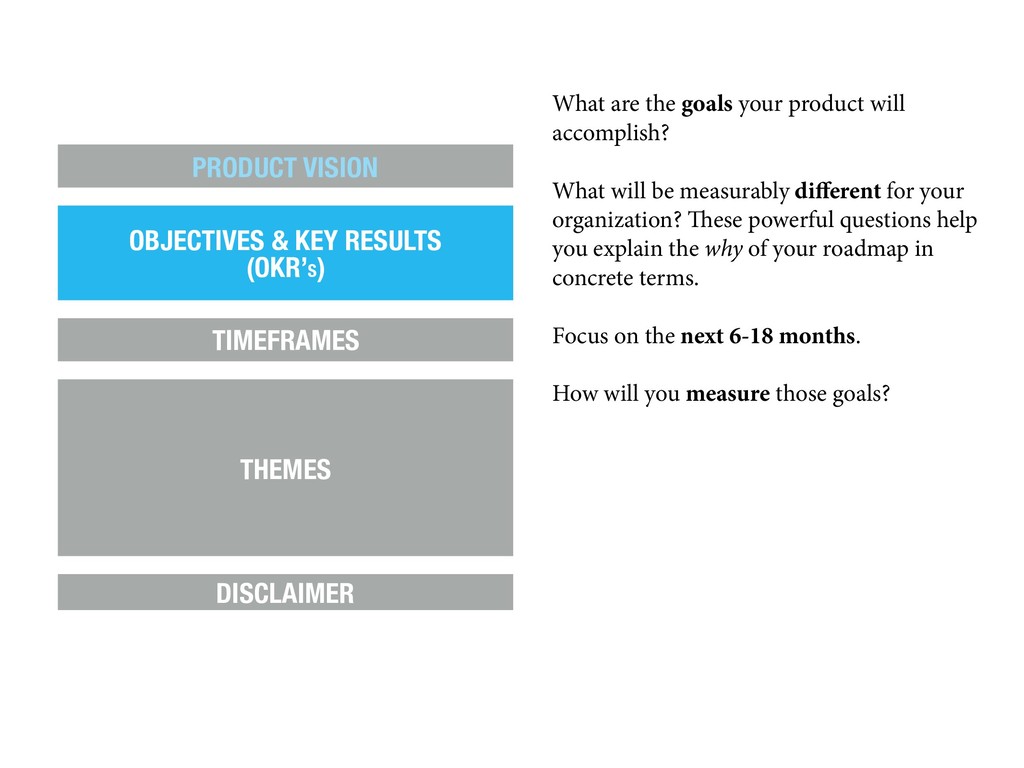
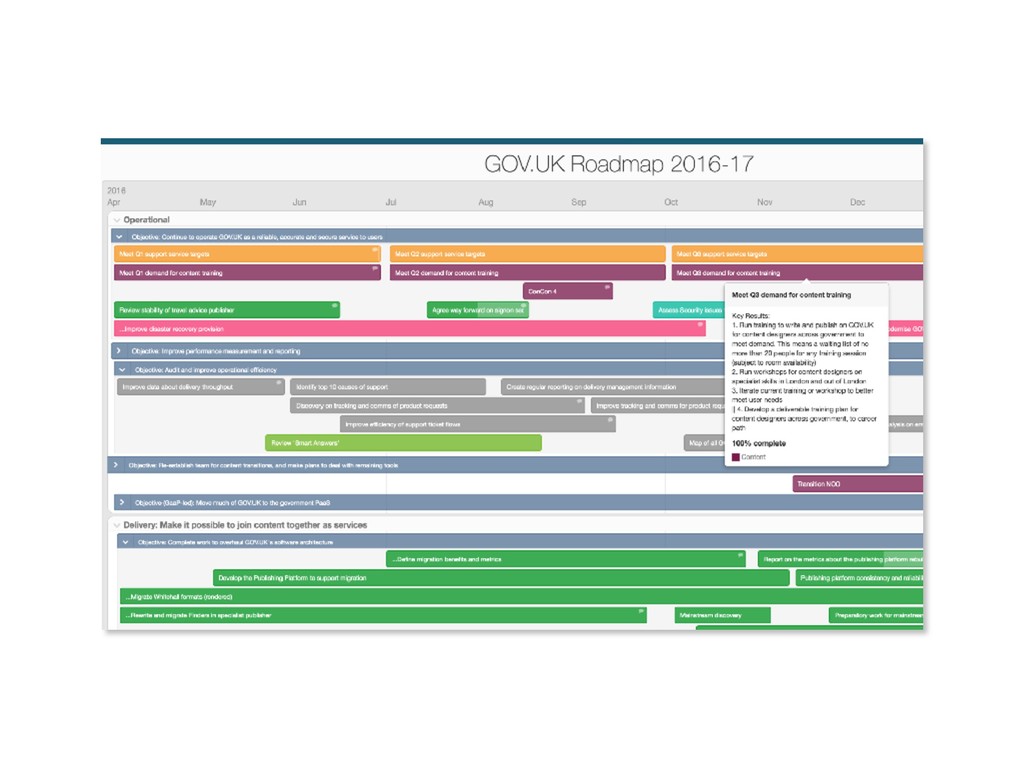
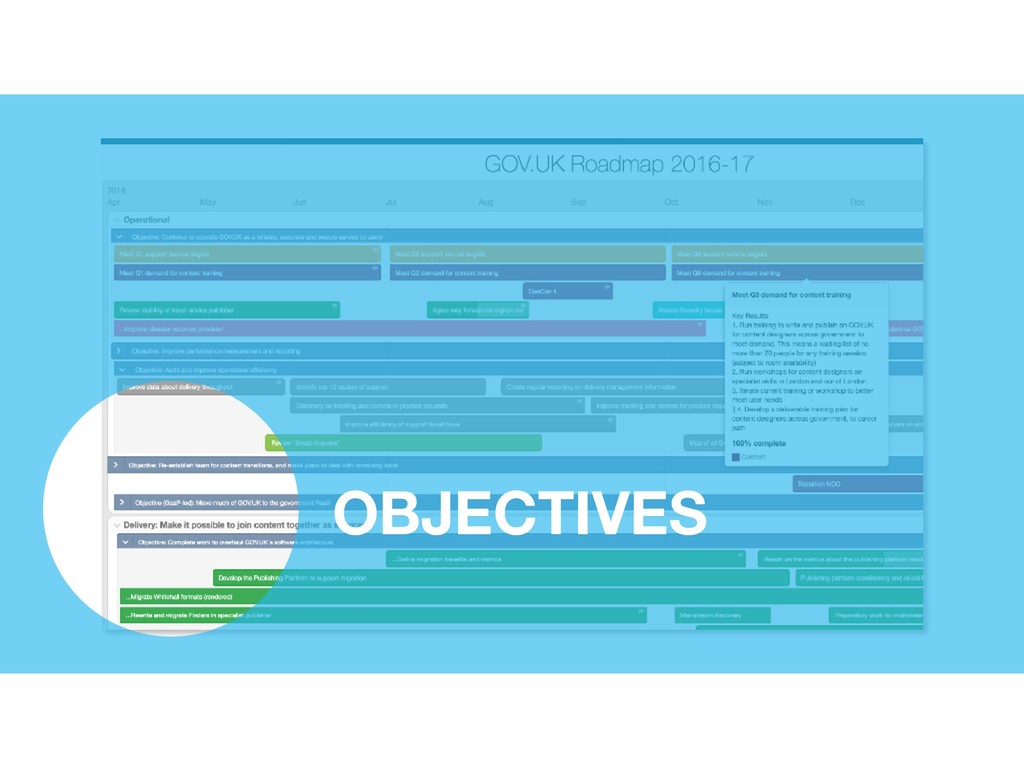
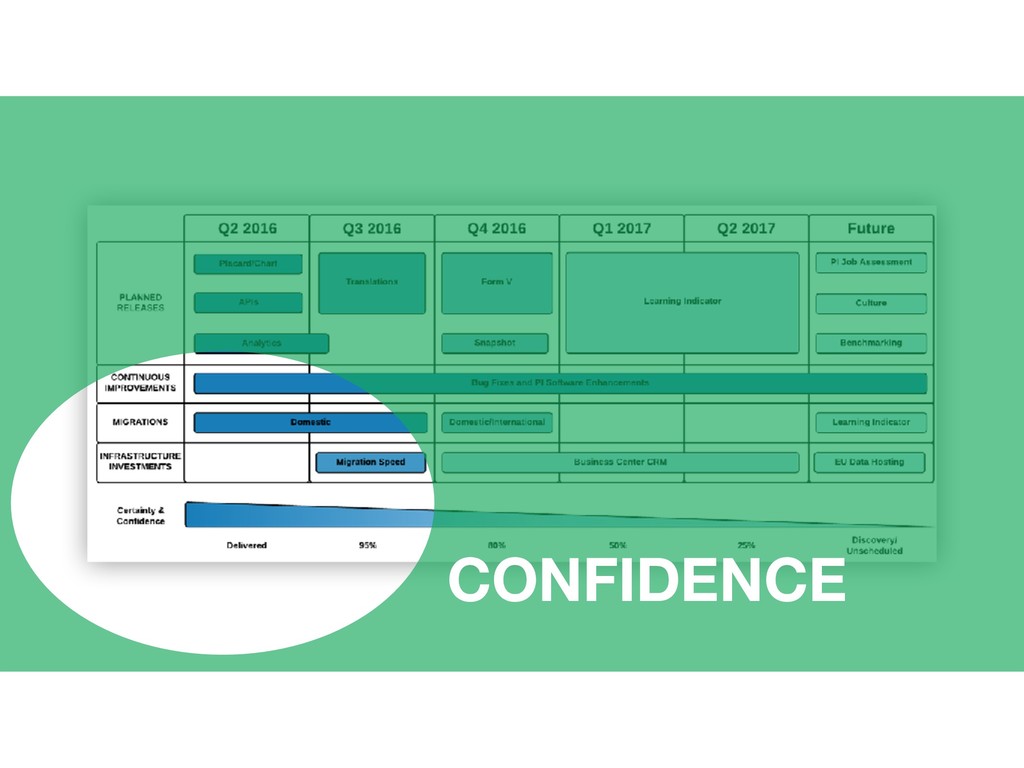
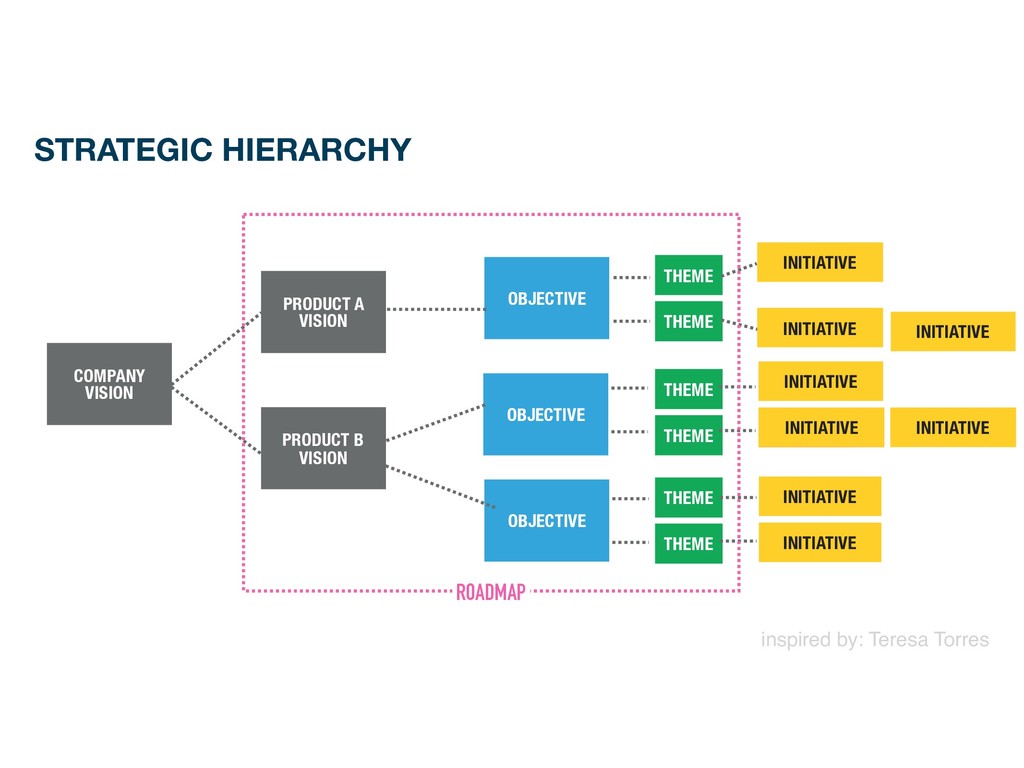
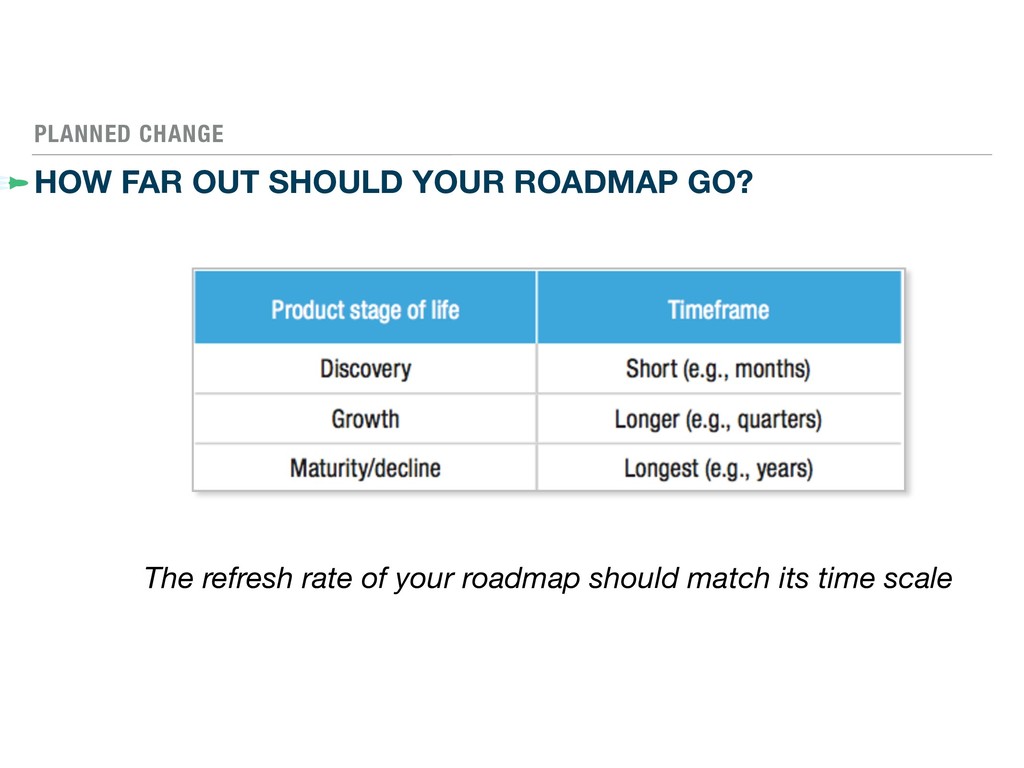
be measurably different for your organization? These powerful questions help you explain the why of your roadmap in concrete terms. Focus on the next 6-18 months. How will you measure those goals? PRODUCT VISION OBJECTIVES & KEY RESULTS (OKR’S) TIMEFRAMES THEMES DISCLAIMER
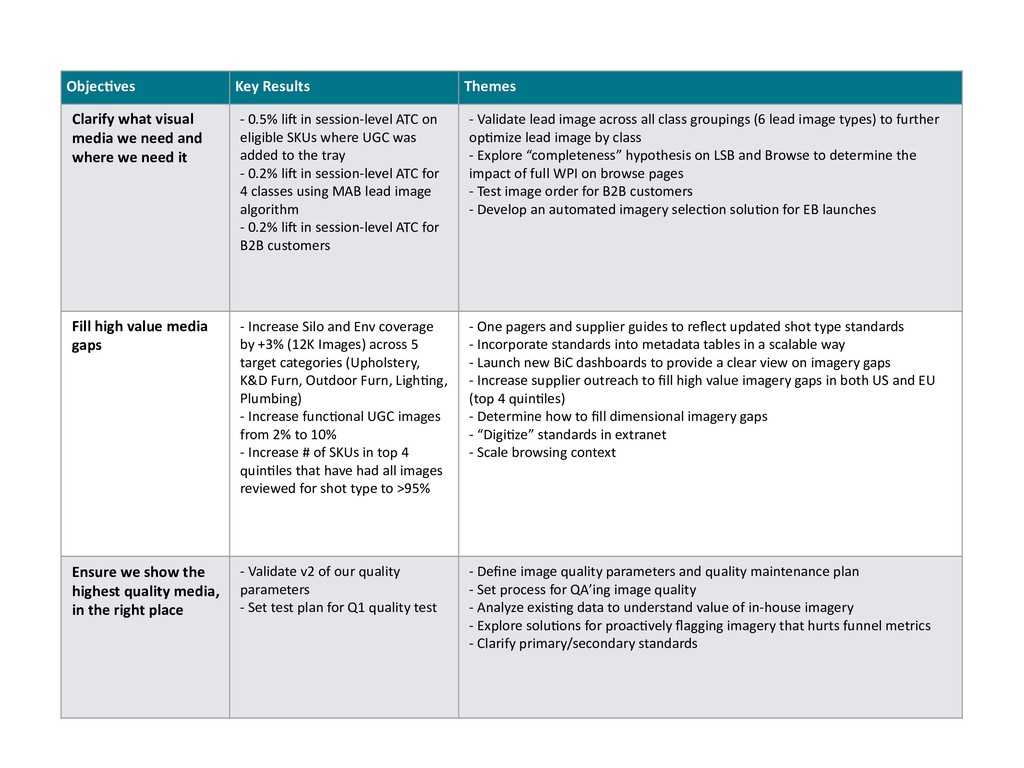
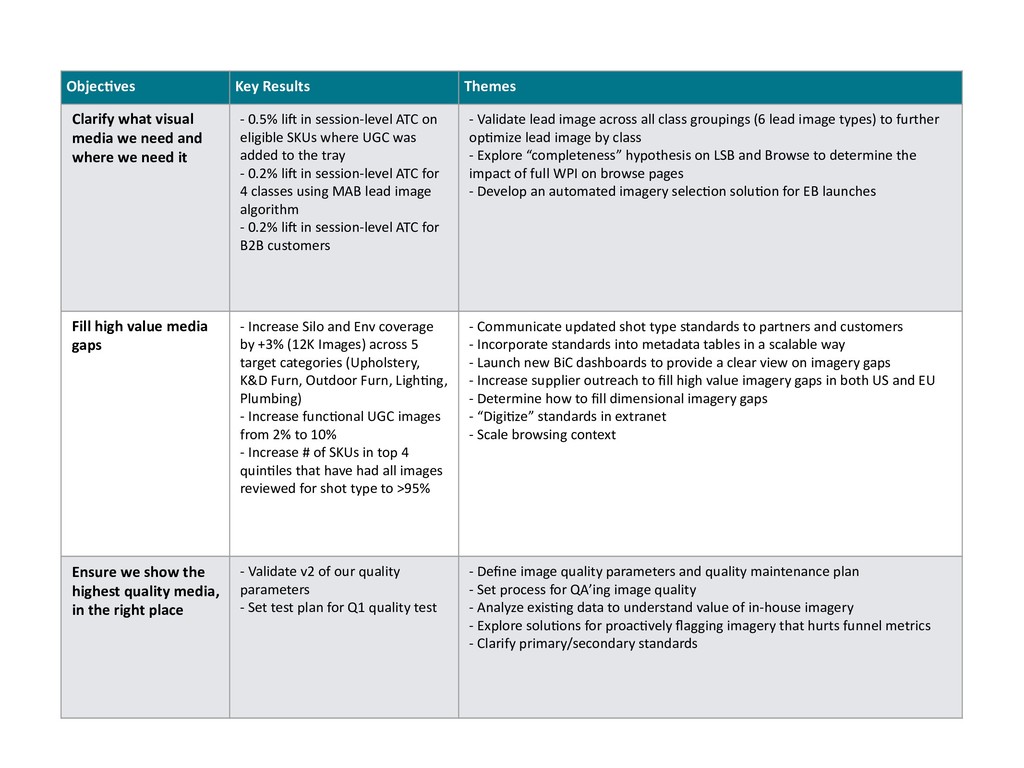
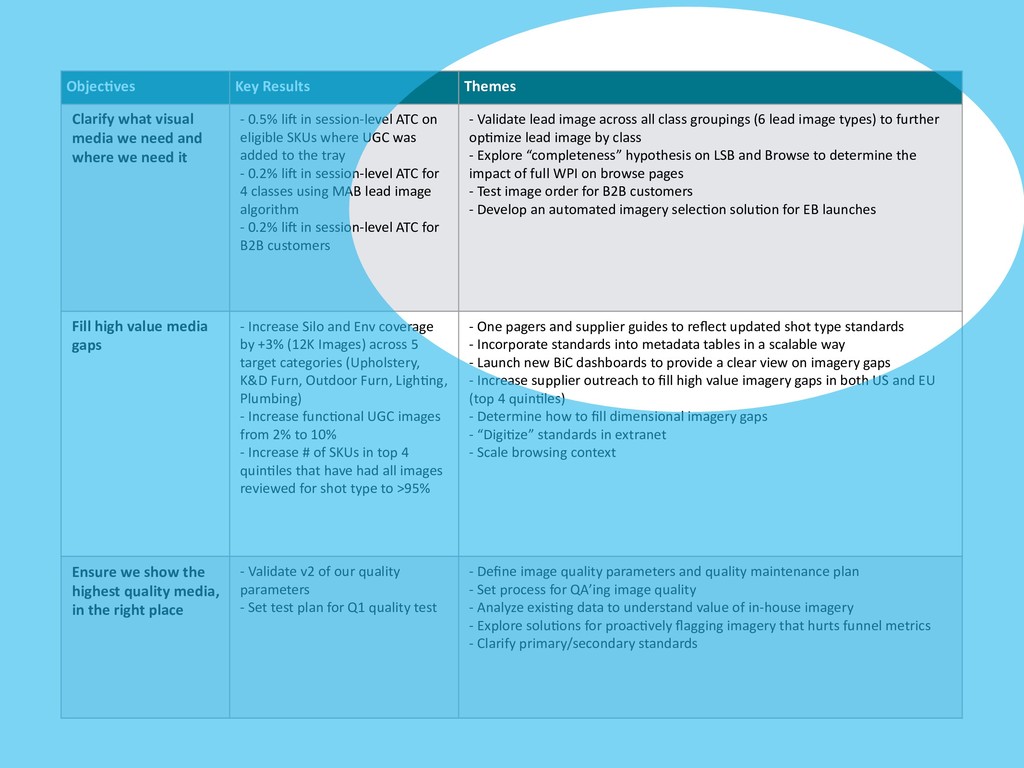
and where we need it - 0.5% li) in session-level ATC on eligible SKUs where UGC was added to the tray - 0.2% li) in session-level ATC for 4 classes using MAB lead image algorithm - 0.2% li) in session-level ATC for B2B customers - Validate lead image across all class groupings (6 lead image types) to further opLmize lead image by class - Explore “completeness” hypothesis on LSB and Browse to determine the impact of full WPI on browse pages - Test image order for B2B customers - Develop an automated imagery selecLon soluLon for EB launches Fill high value media gaps - Increase Silo and Env coverage by +3% (12K Images) across 5 target categories (Upholstery, K&D Furn, Outdoor Furn, LighLng, Plumbing) - Increase funcLonal UGC images from 2% to 10% - Increase # of SKUs in top 4 quinLles that have had all images reviewed for shot type to >95% - One pagers and supplier guides to reflect updated shot type standards - Incorporate standards into metadata tables in a scalable way - Launch new BiC dashboards to provide a clear view on imagery gaps - Increase supplier outreach to fill high value imagery gaps in both US and EU (top 4 quinLles) - Determine how to fill dimensional imagery gaps - “DigiLze” standards in extranet - Scale browsing context Ensure we show the highest quality media, in the right place - Validate v2 of our quality parameters - Set test plan for Q1 quality test - Define image quality parameters and quality maintenance plan - Set process for QA’ing image quality - Analyze exisLng data to understand value of in-house imagery - Explore soluLons for proacLvely flagging imagery that hurts funnel metrics - Clarify primary/secondary standards
and where we need it - 0.5% li) in session-level ATC on eligible SKUs where UGC was added to the tray - 0.2% li) in session-level ATC for 4 classes using MAB lead image algorithm - 0.2% li) in session-level ATC for B2B customers - Validate lead image across all class groupings (6 lead image types) to further opLmize lead image by class - Explore “completeness” hypothesis on LSB and Browse to determine the impact of full WPI on browse pages - Test image order for B2B customers - Develop an automated imagery selecLon soluLon for EB launches Fill high value media gaps - Increase Silo and Env coverage by +3% (12K Images) across 5 target categories (Upholstery, K&D Furn, Outdoor Furn, LighLng, Plumbing) - Increase funcLonal UGC images from 2% to 10% - Increase # of SKUs in top 4 quinLles that have had all images reviewed for shot type to >95% - One pagers and supplier guides to reflect updated shot type standards - Incorporate standards into metadata tables in a scalable way - Launch new BiC dashboards to provide a clear view on imagery gaps - Increase supplier outreach to fill high value imagery gaps in both US and EU (top 4 quinLles) - Determine how to fill dimensional imagery gaps - “DigiLze” standards in extranet - Scale browsing context Ensure we show the highest quality media, in the right place - Validate v2 of our quality parameters - Set test plan for Q1 quality test - Define image quality parameters and quality maintenance plan - Set process for QA’ing image quality - Analyze exisLng data to understand value of in-house imagery - Explore soluLons for proacLvely flagging imagery that hurts funnel metrics - Clarify primary/secondary standards
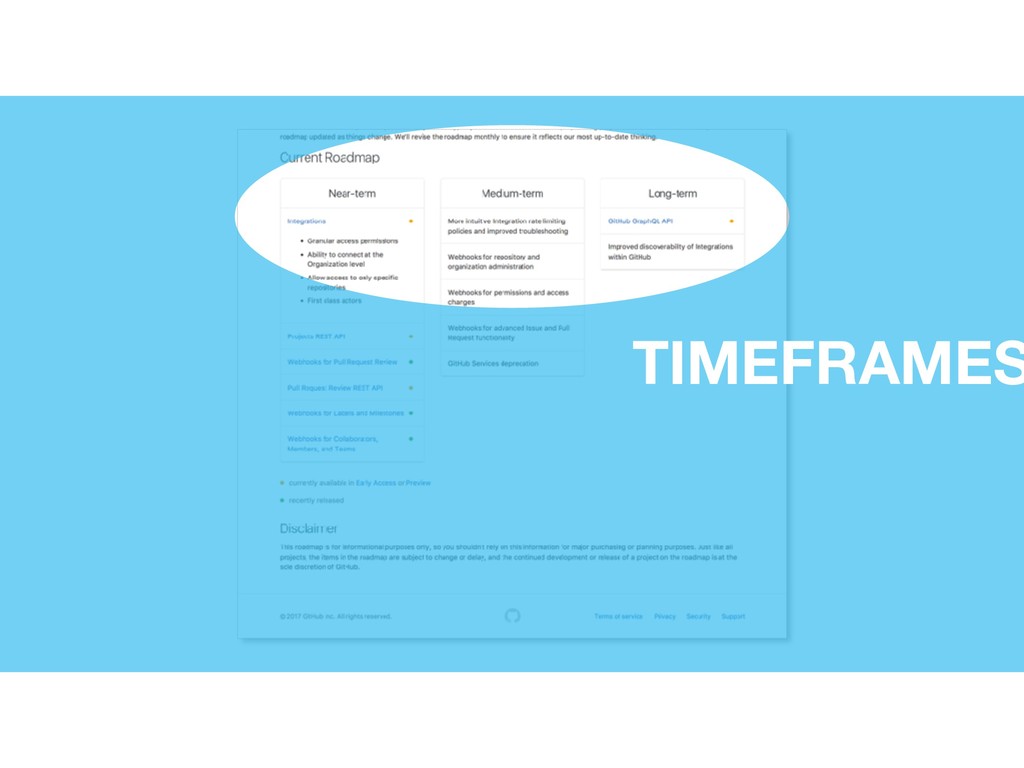
provide guidance while preserving some flexibility. The sequence communicates what’s important now and what can wait awhile. PRODUCT VISION OBJECTIVES & KEY RESULTS (OKR’S) TIMEFRAMES THEMES DISCLAIMER
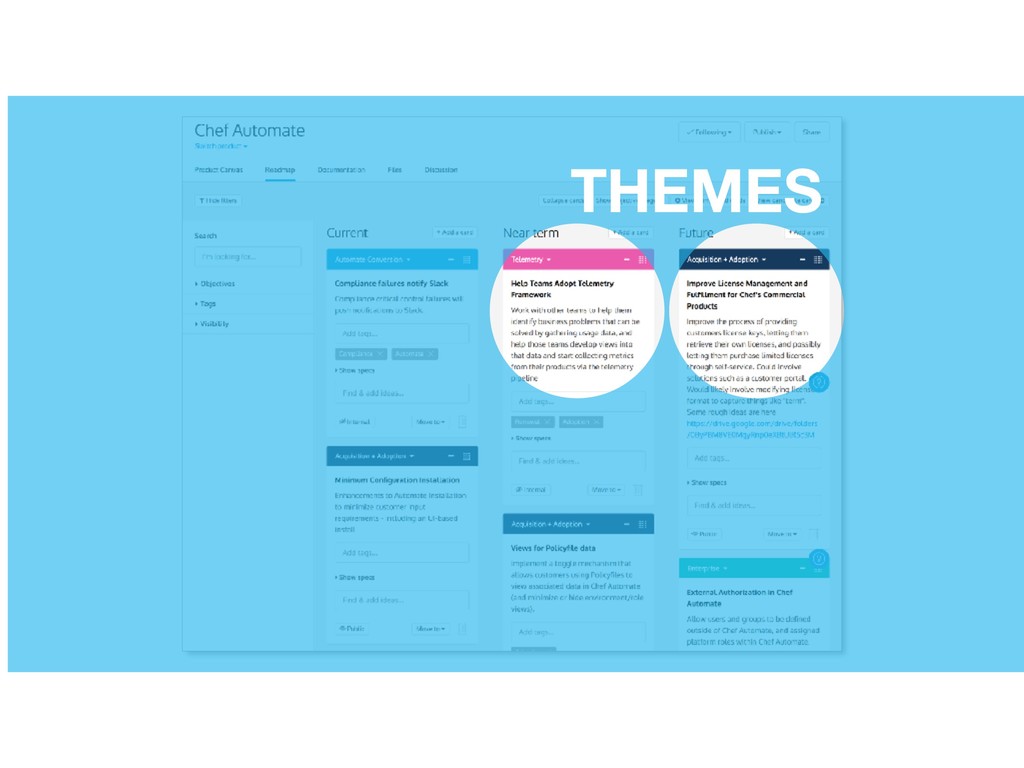
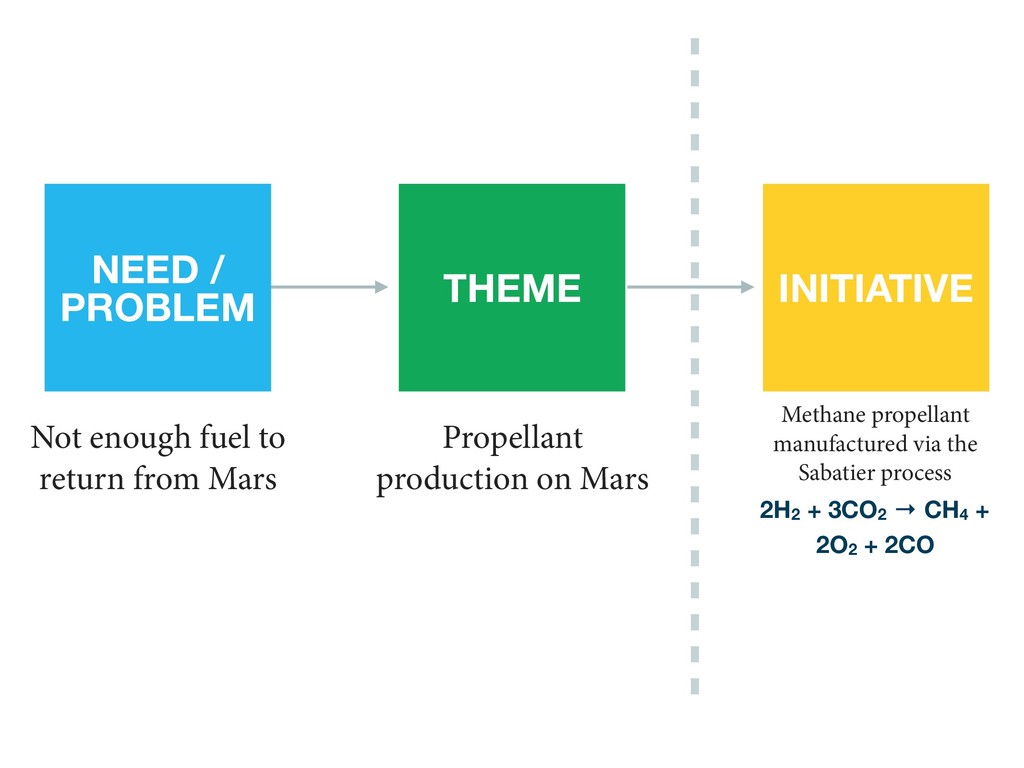
in guiding the development of solutions. The key problems customers face form the themes at the heart of the roadmap. Written as ambiguous and somewhat undefined. PRODUCT VISION OBJECTIVES & KEY RESULTS (OKR’S) TIMEFRAMES THEMES DISCLAIMER
and where we need it - 0.5% li) in session-level ATC on eligible SKUs where UGC was added to the tray - 0.2% li) in session-level ATC for 4 classes using MAB lead image algorithm - 0.2% li) in session-level ATC for B2B customers - Validate lead image across all class groupings (6 lead image types) to further opLmize lead image by class - Explore “completeness” hypothesis on LSB and Browse to determine the impact of full WPI on browse pages - Develop an automated imagery selecLon soluLon for EB launches Fill high value media gaps - Increase Silo and Env coverage by +3% (12K Images) across 5 target categories (Upholstery, K&D Furn, Outdoor Furn, LighLng, Plumbing) - Increase funcLonal UGC images from 2% to 10% - Increase # of SKUs in top 4 quinLles that have had all images reviewed for shot type to >95% - Communicate updated shot type standards to partners and customers - Incorporate standards into metadata tables in a scalable way - Launch new BiC dashboards to provide a clear view on imagery gaps - Increase supplier outreach to fill high value imagery gaps in both US and EU - Determine how to fill dimensional imagery gaps - “DigiLze” standards in extranet - Scale browsing context Ensure we show the highest quality media, in the right place - Validate v2 of our quality parameters - Set test plan for Q1 quality test - Define image quality parameters and quality maintenance plan - Set process for QA’ing image quality - Analyze exisLng data to understand value of in-house imagery - Explore soluLons for proacLvely flagging imagery that hurts funnel metrics - Clarify primary/secondary standards
and where we need it - 0.5% li) in session-level ATC on eligible SKUs where UGC was added to the tray - 0.2% li) in session-level ATC for 4 classes using MAB lead image algorithm - 0.2% li) in session-level ATC for B2B customers - Validate lead image across all class groupings (6 lead image types) to further opLmize lead image by class - Explore “completeness” hypothesis on LSB and Browse to determine the impact of full WPI on browse pages - Test image order for B2B customers - Develop an automated imagery selecLon soluLon for EB launches Fill high value media gaps - Increase Silo and Env coverage by +3% (12K Images) across 5 target categories (Upholstery, K&D Furn, Outdoor Furn, LighLng, Plumbing) - Increase funcLonal UGC images from 2% to 10% - Increase # of SKUs in top 4 quinLles that have had all images reviewed for shot type to >95% - One pagers and supplier guides to reflect updated shot type standards - Incorporate standards into metadata tables in a scalable way - Launch new BiC dashboards to provide a clear view on imagery gaps - Increase supplier outreach to fill high value imagery gaps in both US and EU (top 4 quinLles) - Determine how to fill dimensional imagery gaps - “DigiLze” standards in extranet - Scale browsing context Ensure we show the highest quality media, in the right place - Validate v2 of our quality parameters - Set test plan for Q1 quality test - Define image quality parameters and quality maintenance plan - Set process for QA’ing image quality - Analyze exisLng data to understand value of in-house imagery - Explore soluLons for proacLvely flagging imagery that hurts funnel metrics - Clarify primary/secondary standards
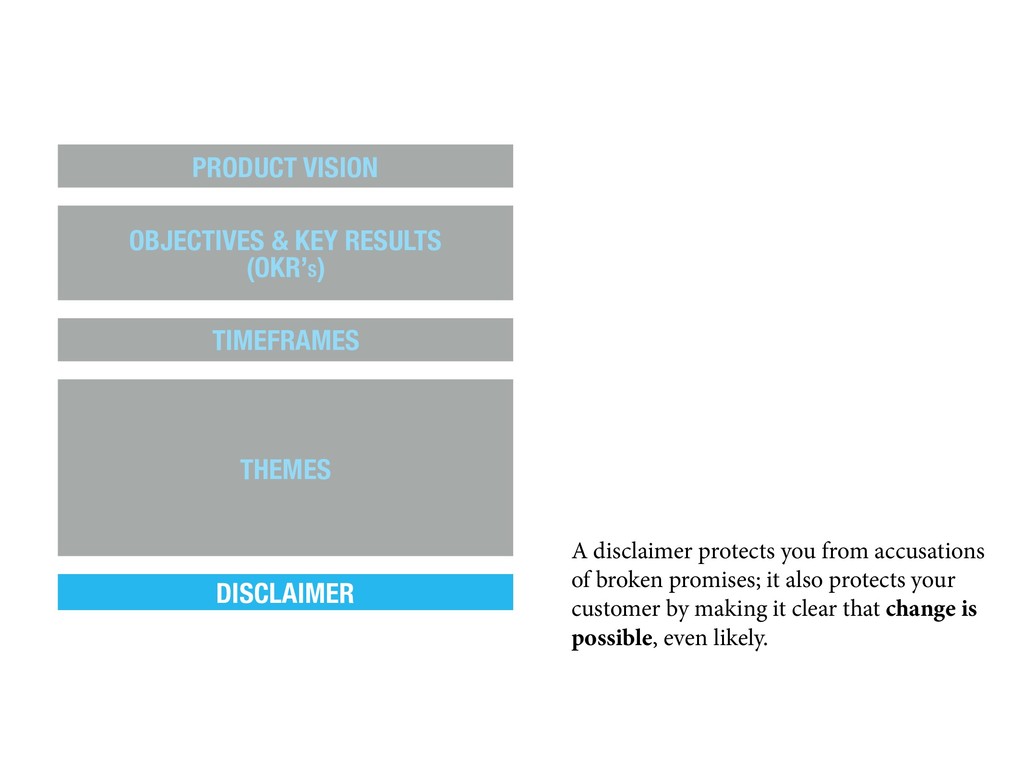
also protects your customer by making it clear that change is possible, even likely. PRODUCT VISION OBJECTIVES & KEY RESULTS (OKR’S) TIMEFRAMES THEMES DISCLAIMER
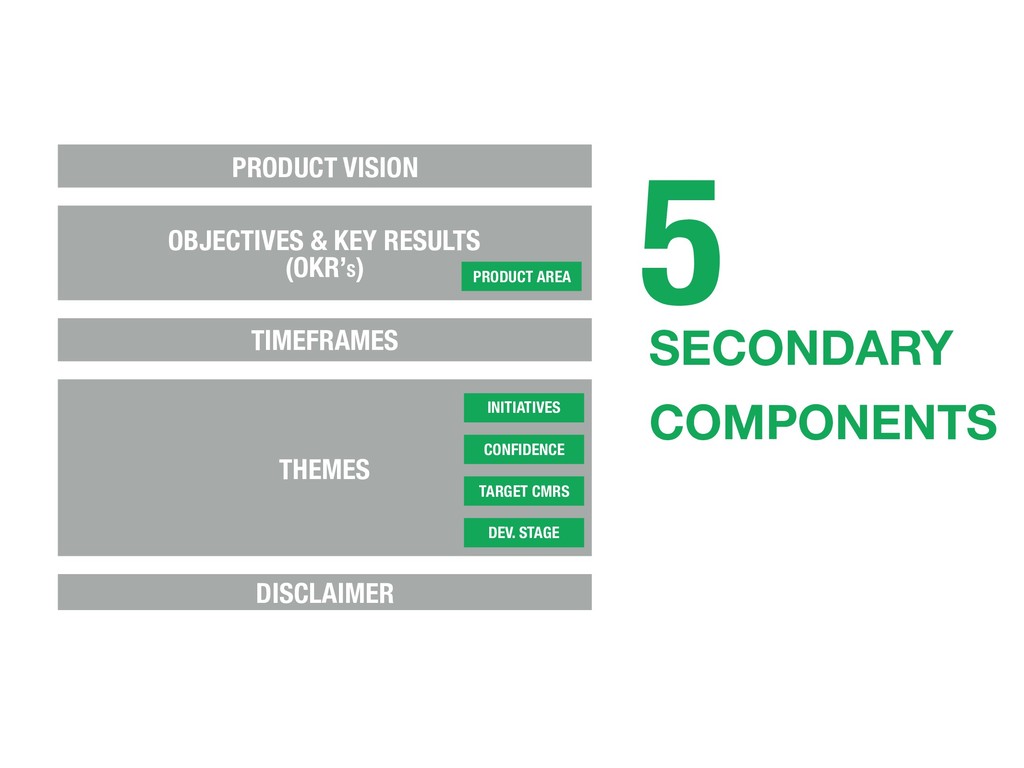
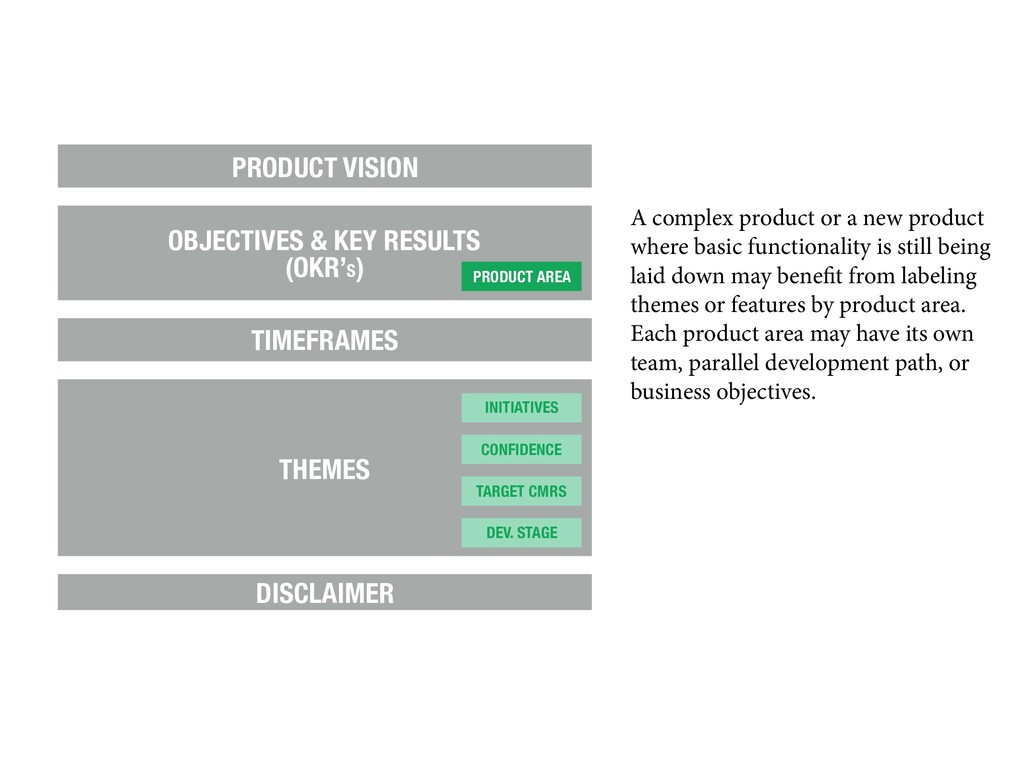
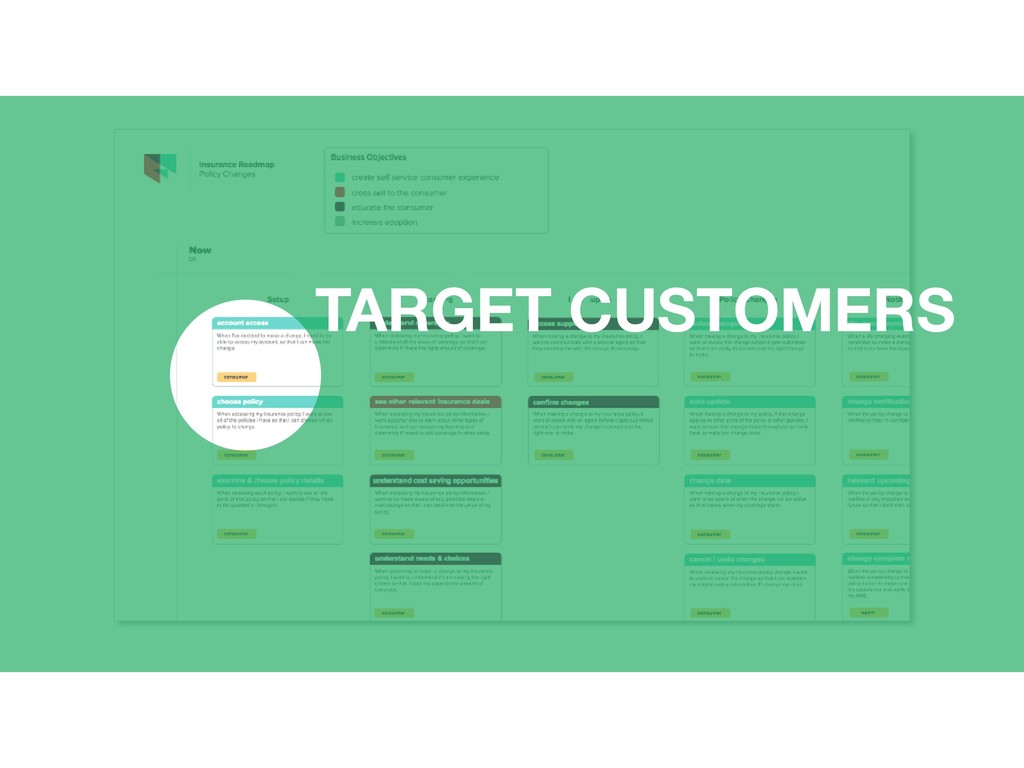
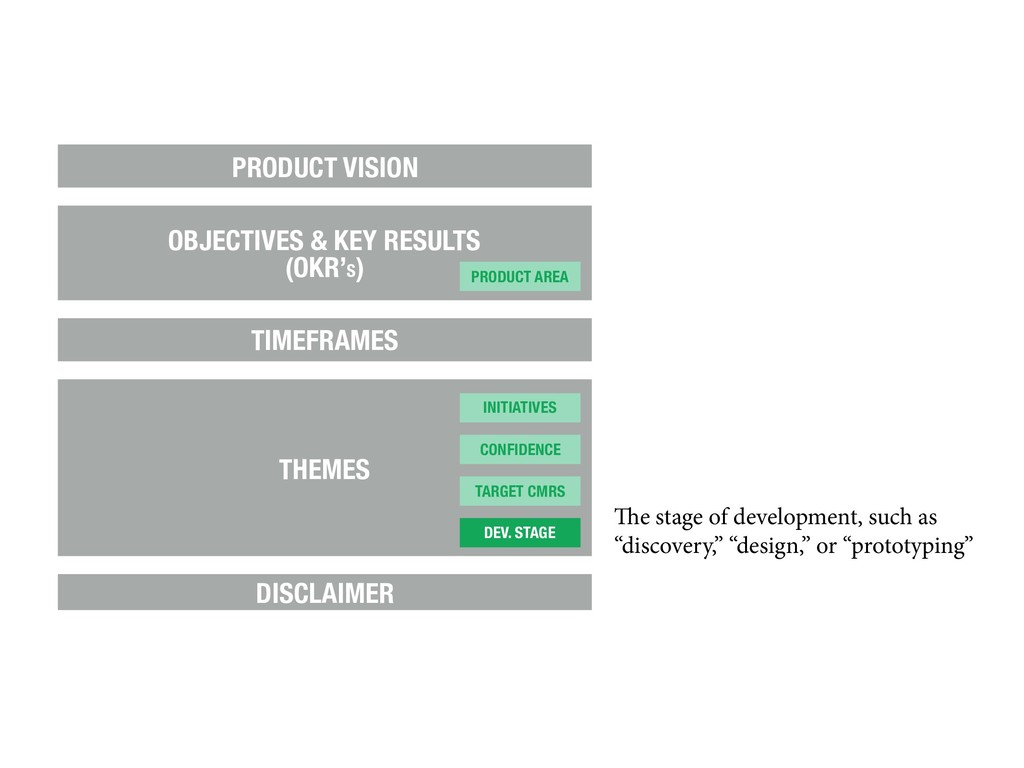
PRODUCT AREA INITIATIVES CONFIDENCE TARGET CMRS DEV. STAGE A complex product or a new product where basic functionality is still being laid down may benefit from labeling themes or features by product area. Each product area may have its own team, parallel development path, or business objectives.
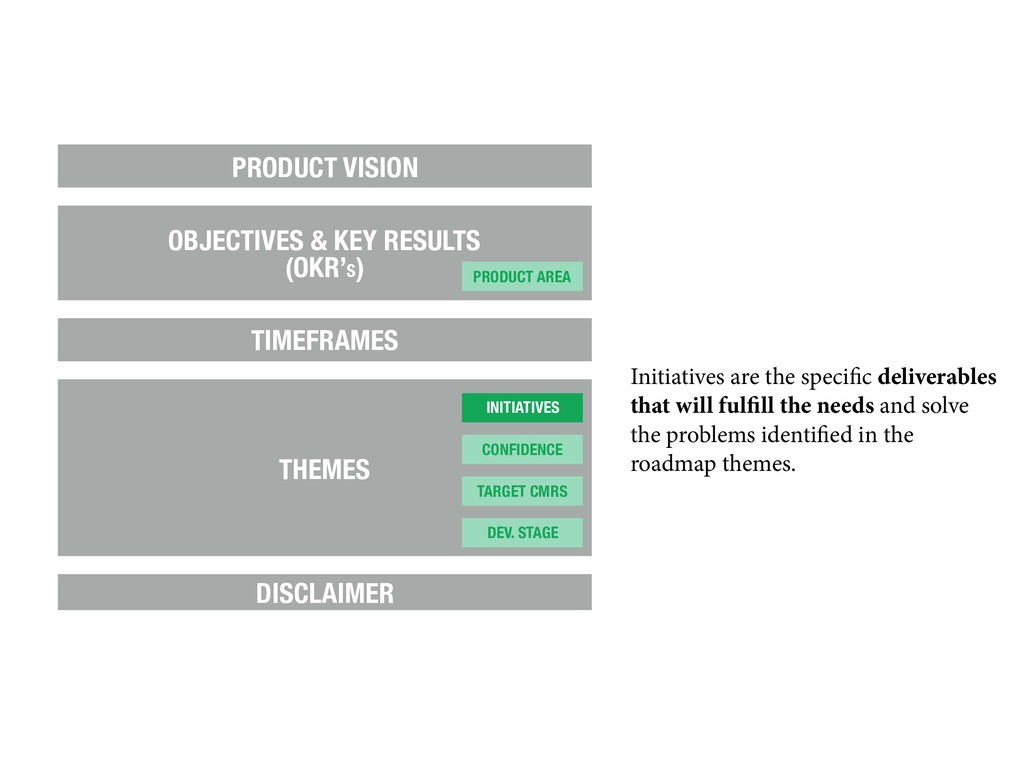
PRODUCT AREA INITIATIVES CONFIDENCE TARGET CMRS DEV. STAGE Initiatives are the specific deliverables that will fulfill the needs and solve the problems identified in the roadmap themes.
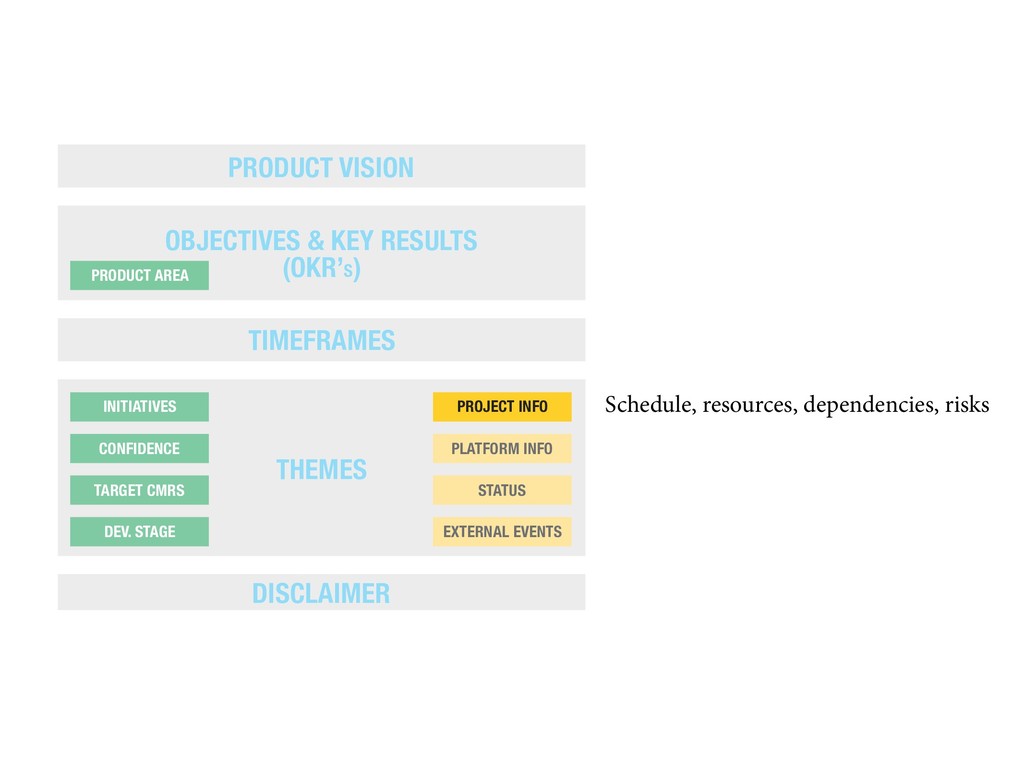
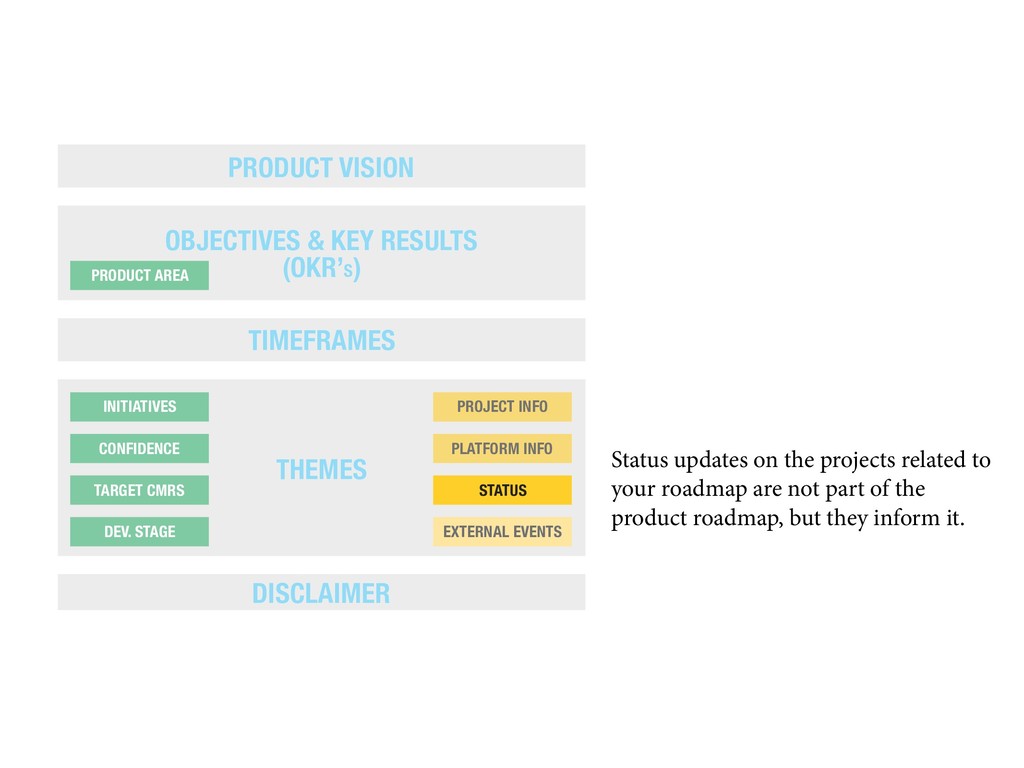
PROJECT INFO EXTERNAL EVENTS STATUS PLATFORM INFO Status updates on the projects related to your roadmap are not part of the product roadmap, but they inform it. PRODUCT AREA INITIATIVES CONFIDENCE TARGET CMRS DEV. STAGE
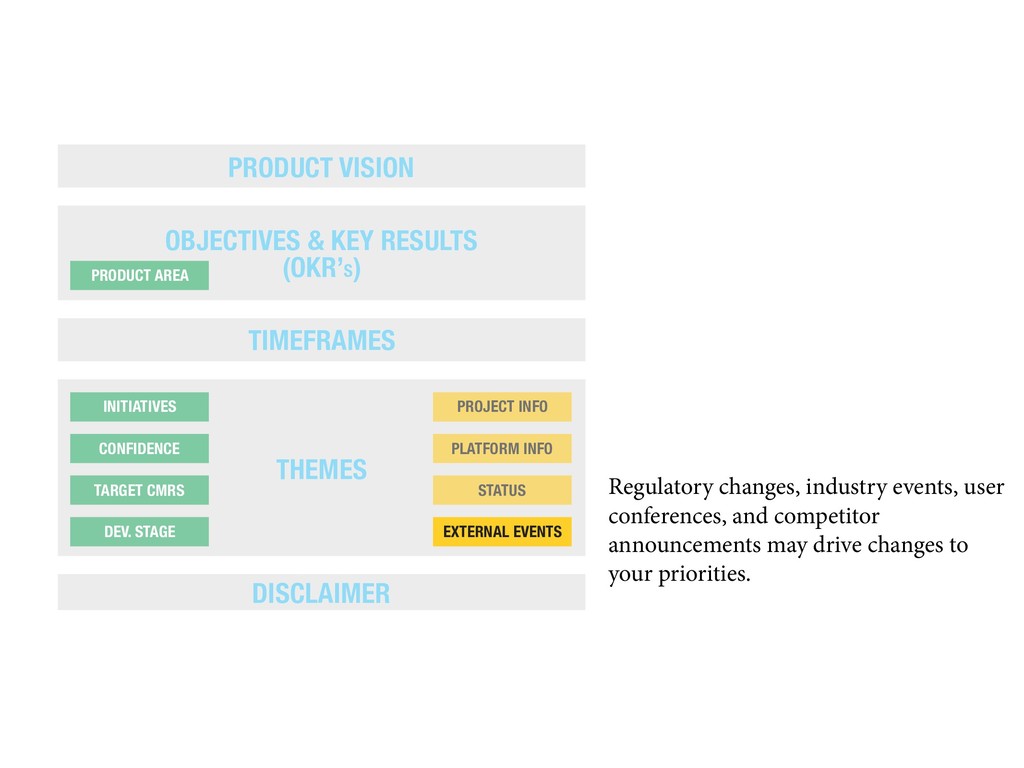
PROJECT INFO EXTERNAL EVENTS STATUS PLATFORM INFO Regulatory changes, industry events, user conferences, and competitor announcements may drive changes to your priorities. PRODUCT AREA INITIATIVES CONFIDENCE TARGET CMRS DEV. STAGE
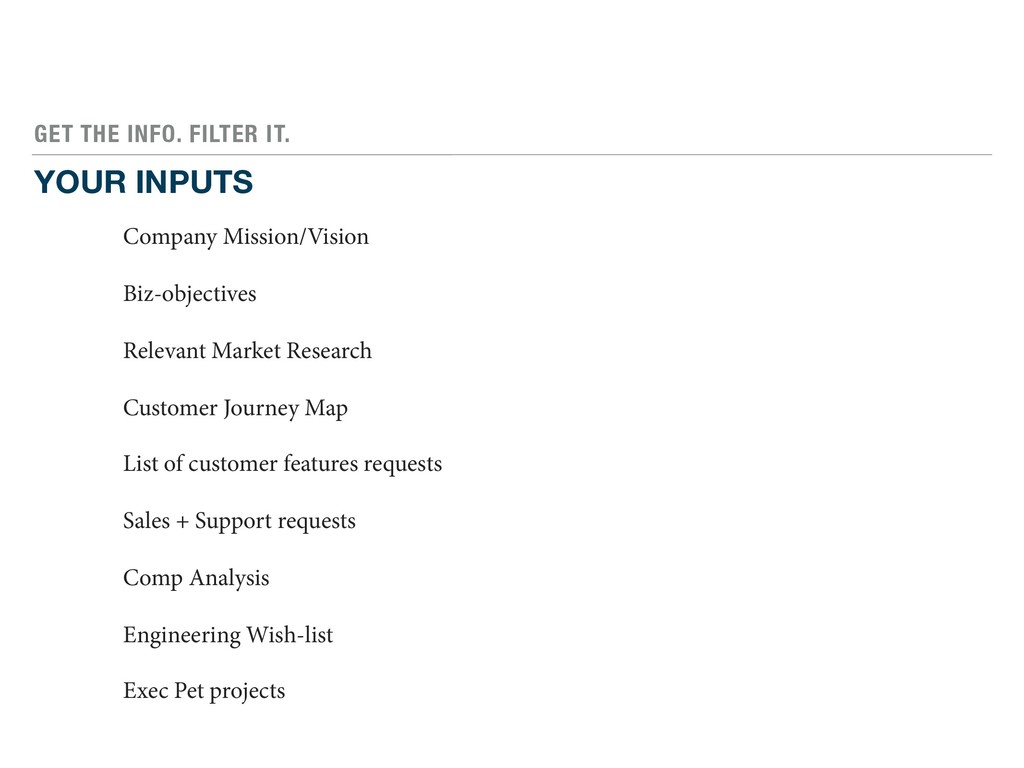
Relevant Market Research Customer Journey Map List of customer features requests Sales + Support requests Comp Analysis Engineering Wish-list Exec Pet projects
MAKE IT ACCESSIBLE FOR EVERYONE IN A USEFUL WAY TO GIVE EVERYONE A VOICE AND SHOW THEM THE WORLD. HELPS PEOPLE AROUND THE GLOBE ENJOY GREATER ACCESS TO INFORMATION AND OPPORTUNITY THAN EVER BEFORE. TO PROVIDE A FAST, SIMPLE, AND SECURE BROWSER FOR EVERYONE TO EXPERIENCE THE MODERN WEB.
a benefit] For [customers] By [a bit about how - when inventing something new or different] Derived from Geoffrey Moore’s Value Proposition Template To perfect American lawns by perfecting water delivery.
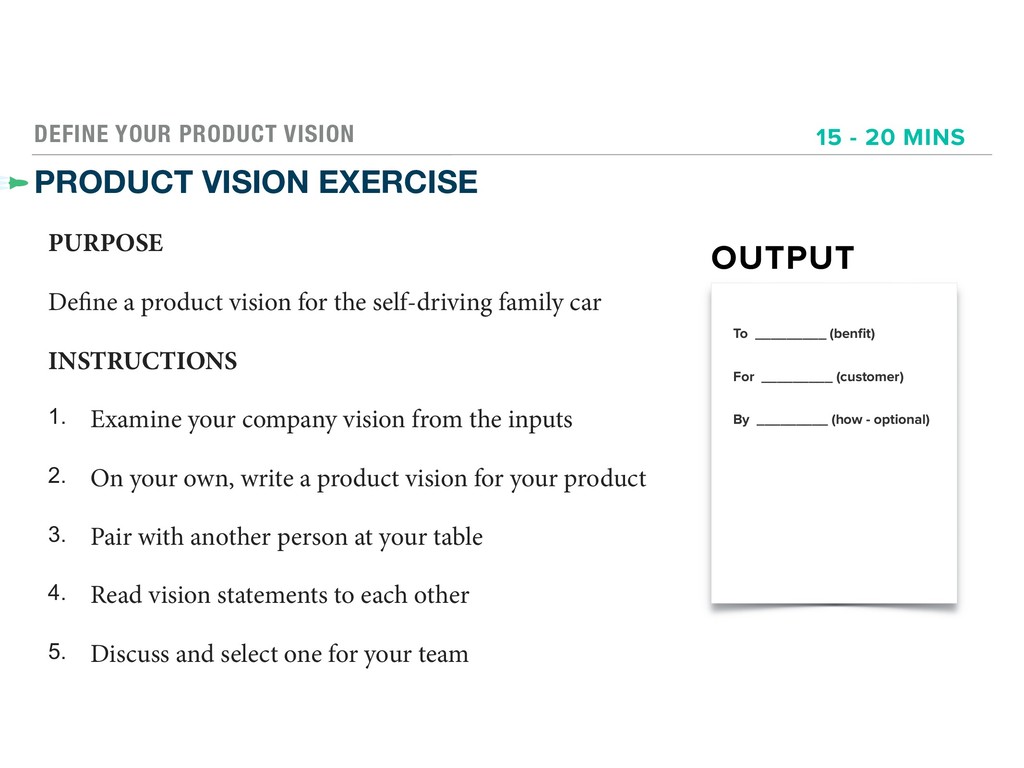
product vision for the self-driving family car INSTRUCTIONS 1. Examine your company vision from the inputs 2. On your own, write a product vision for your product 3. Pair with another person at your table 4. Read vision statements to each other 5. Discuss and select one for your team OUTPUT To _________ (benfit) For _________ (customer) By _________ (how - optional) 15 - 20 MINS
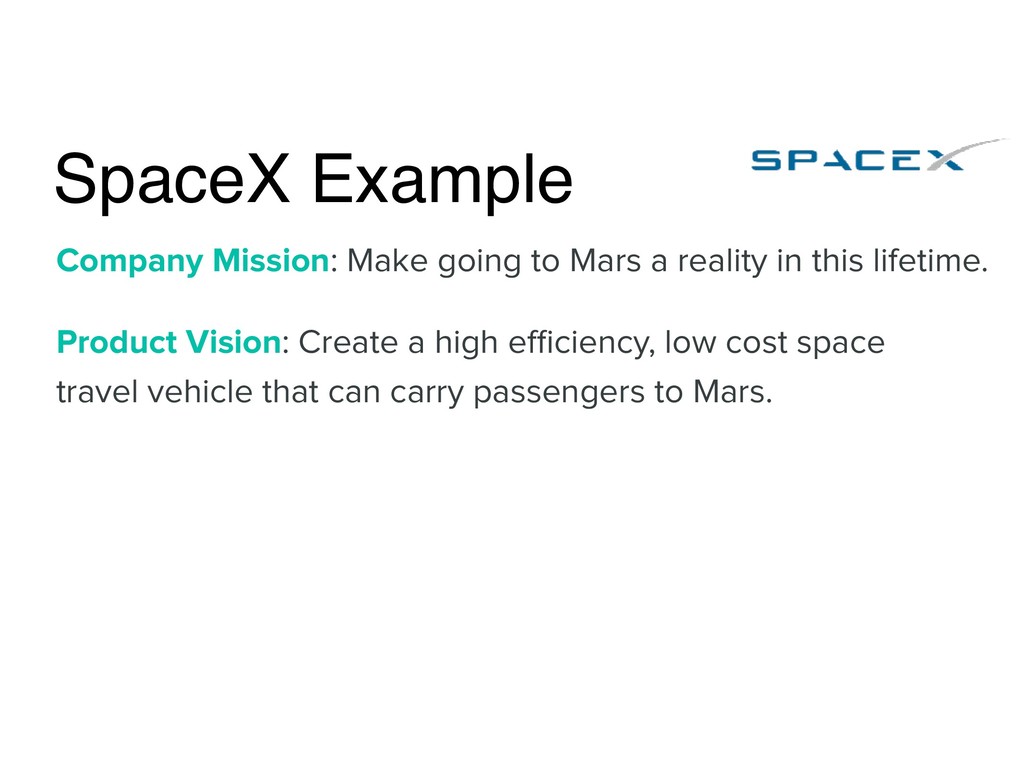
SPACE-X Company Mission: Make going to Mars a reality in this lifetime. Product Vision: Create a high efficiency, low cost space travel vehicle that can seat multiple civilian passengers. Objective: Reducing the cost of space travel to what an average American family can afford. Key Result: Get cost for travel to Mars under $200,000.
recurring revenue Grow market share Fulfill more demand Develop new markets PROFIT Support higher prices Improve lifetime value Leverage assets Lower costs VALUE Support core value Barriers to competition
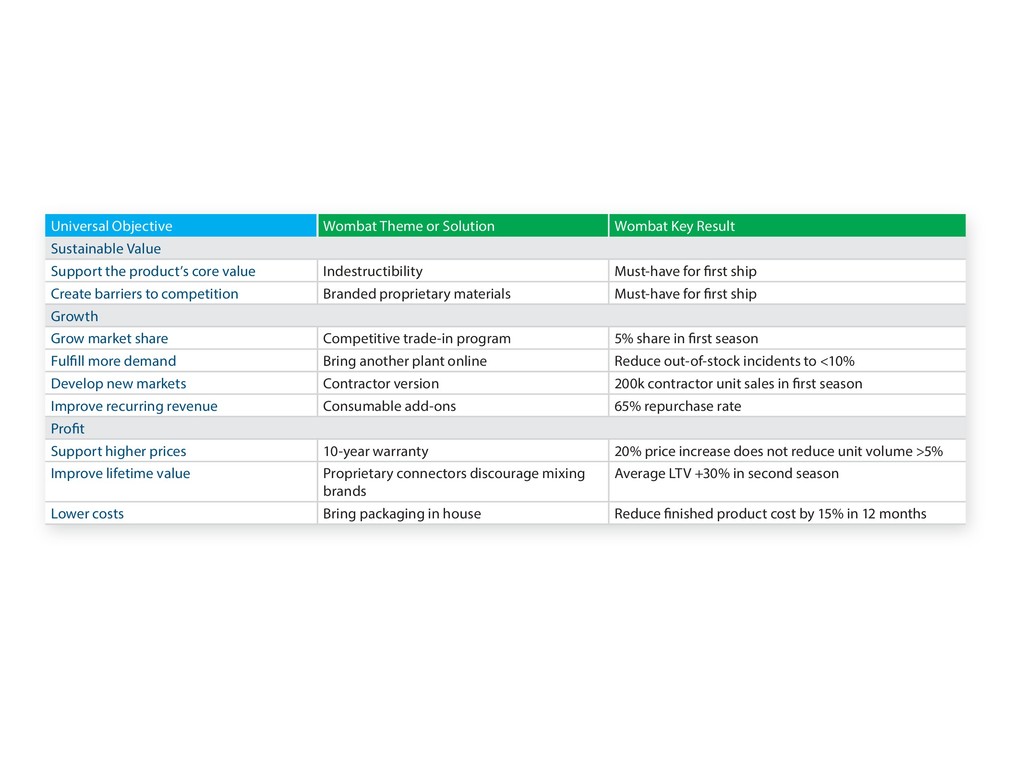
Value Support the product’s core value Indestructibility Must-have for first ship Create barriers to competition Branded proprietary materials Must-have for first ship Growth Grow market share Competitive trade-in program 5% share in first season Fulfill more demand Bring another plant online Reduce out-of-stock incidents to <10% Develop new markets Contractor version 200k contractor unit sales in first season Improve recurring revenue Consumable add-ons 65% repurchase rate Profit Support higher prices 10-year warranty 20% price increase does not reduce unit volume >5% Improve lifetime value Proprietary connectors discourage mixing brands Average LTV +30% in second season Lower costs Bring packaging in house Reduce finished product cost by 15% in 12 months Table 4-1. The 10 Universal Business Objectives
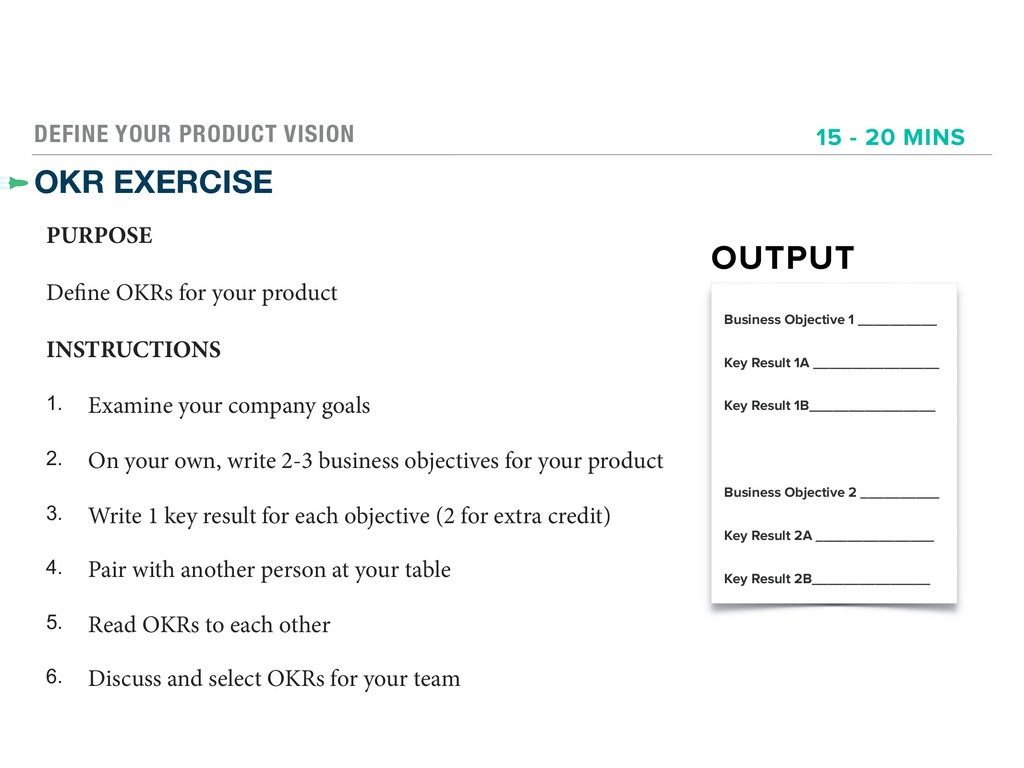
your product INSTRUCTIONS 1. Examine your company goals 2. On your own, write 2-3 business objectives for your product 3. Write 1 key result for each objective (2 for extra credit) 4. Pair with another person at your table 5. Read OKRs to each other 6. Discuss and select OKRs for your team OUTPUT Business Objective 1 __________ Key Result 1A ________________ Key Result 1B________________ Business Objective 2 __________ Key Result 2A _______________ Key Result 2B_______________ 15 - 20 MINS
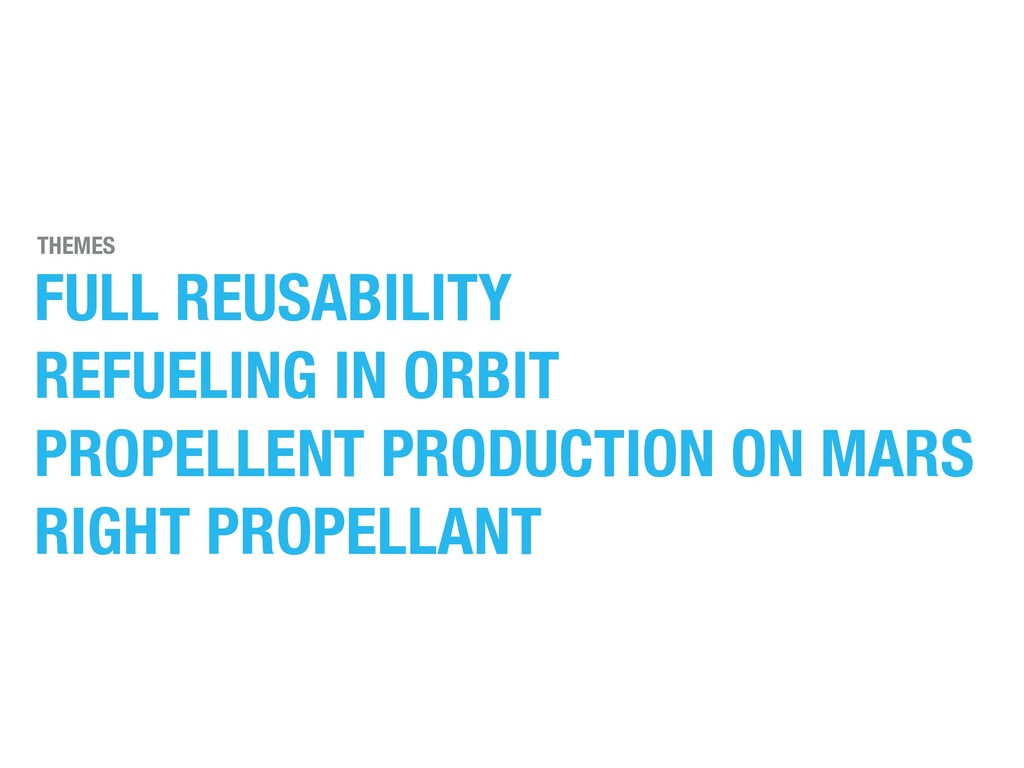
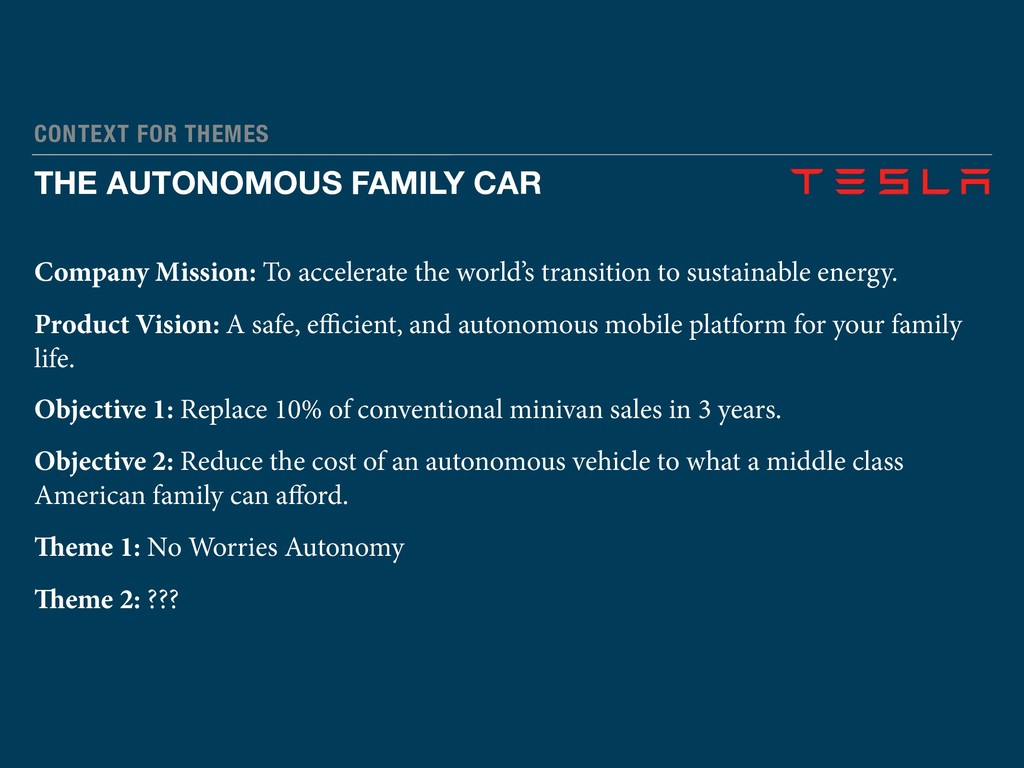
accelerate the world’s transition to sustainable energy. Product Vision: A safe, efficient, and autonomous mobile platform for your family life. Objective 1: Replace 10% of conventional minivan sales in 3 years. Objective 2: Reduce the cost of an autonomous vehicle to what a middle class American family can afford. Theme 1: No Worries Autonomy Theme 2: ???
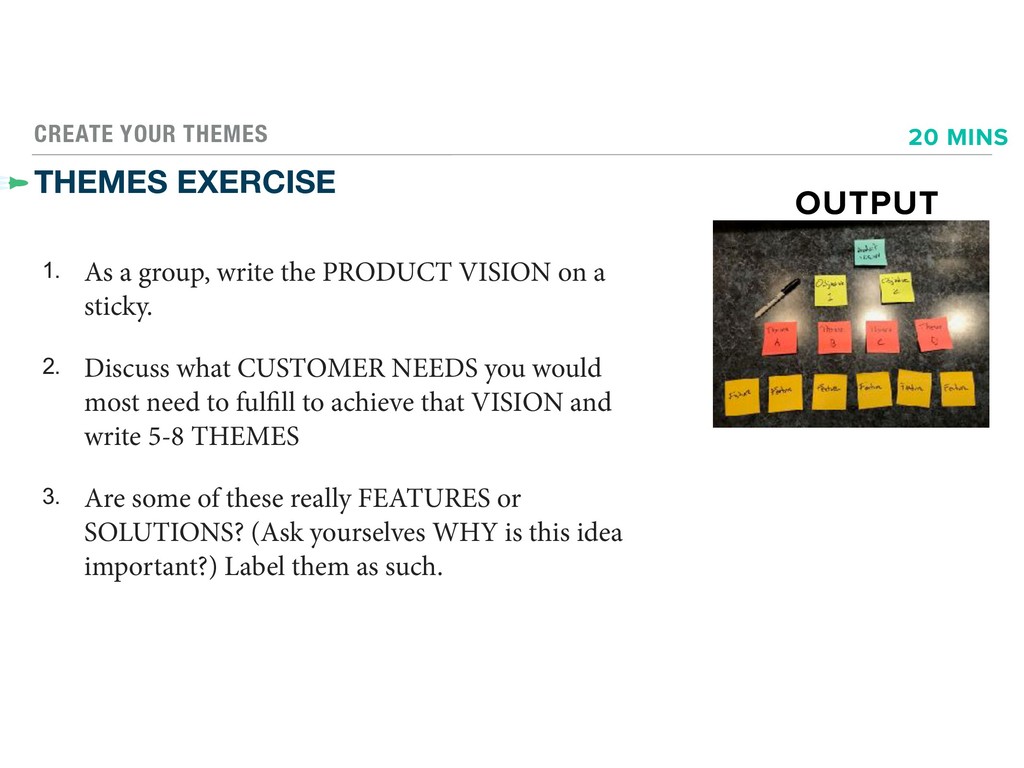
the PRODUCT VISION on a sticky. 2. Discuss what CUSTOMER NEEDS you would most need to fulfill to achieve that VISION and write 5-8 THEMES 3. Are some of these really FEATURES or SOLUTIONS? (Ask yourselves WHY is this idea important?) Label them as such. 20 MINS OUTPUT
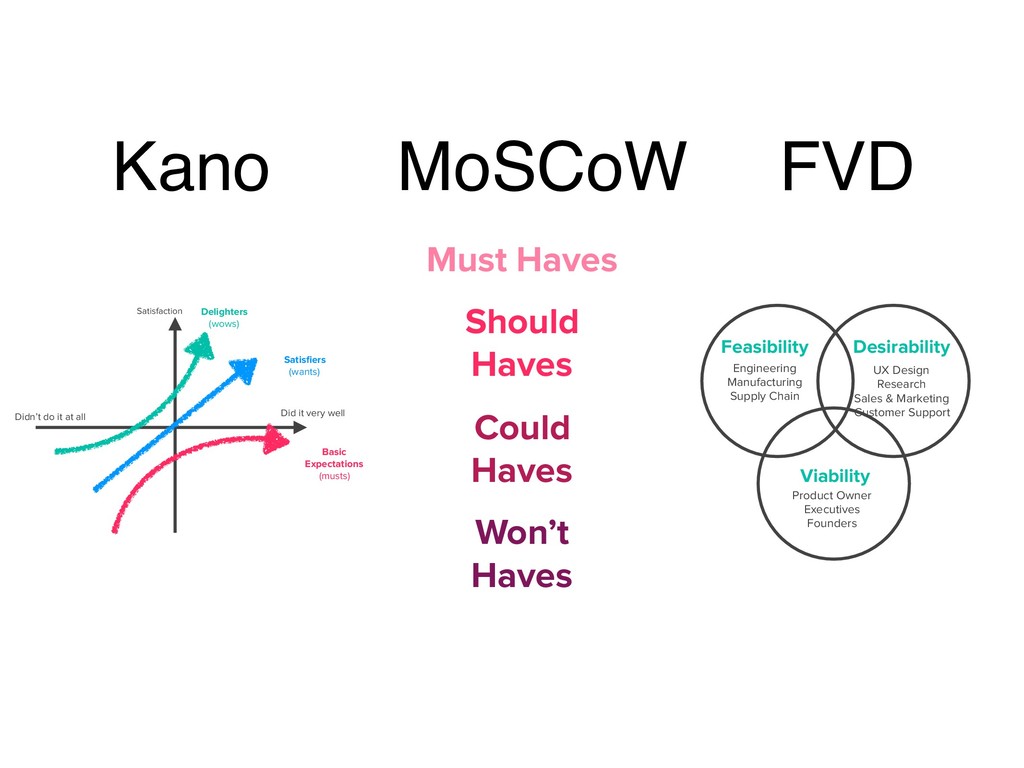
it very well Didn’t do it at all Kano Must Haves Should Haves Could Haves Won’t Haves MoSCoW Feasibility Desirability Viability Engineering Manufacturing Supply Chain UX Design Research Sales & Marketing Customer Support Product Owner Executives Founders FVD
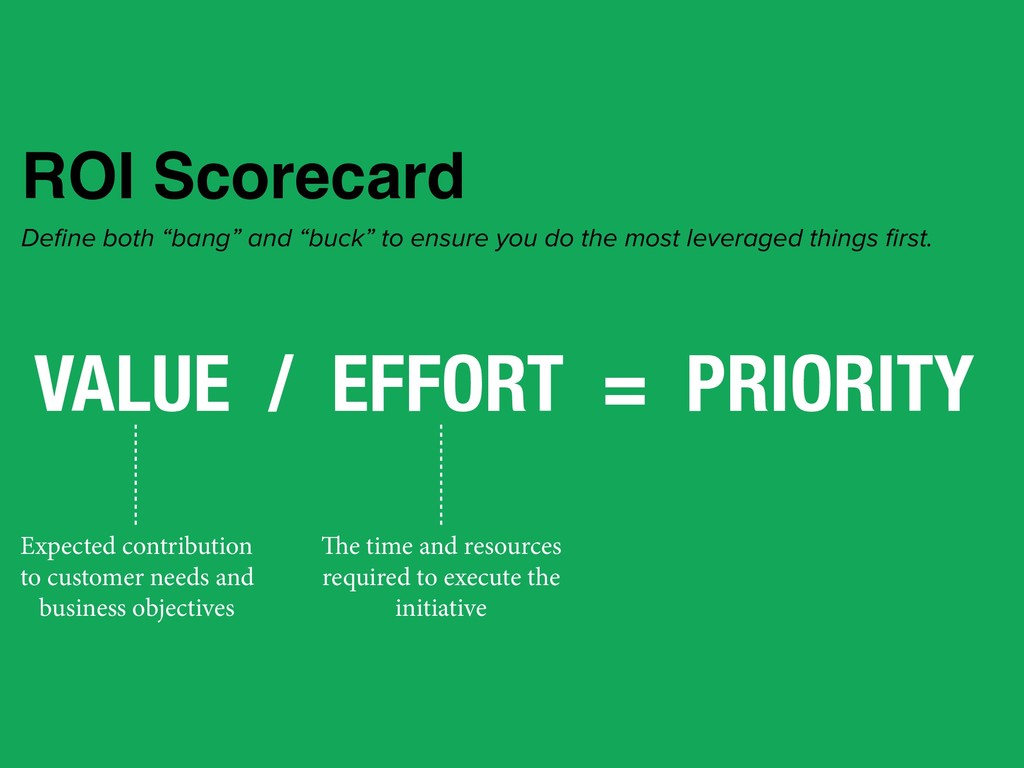
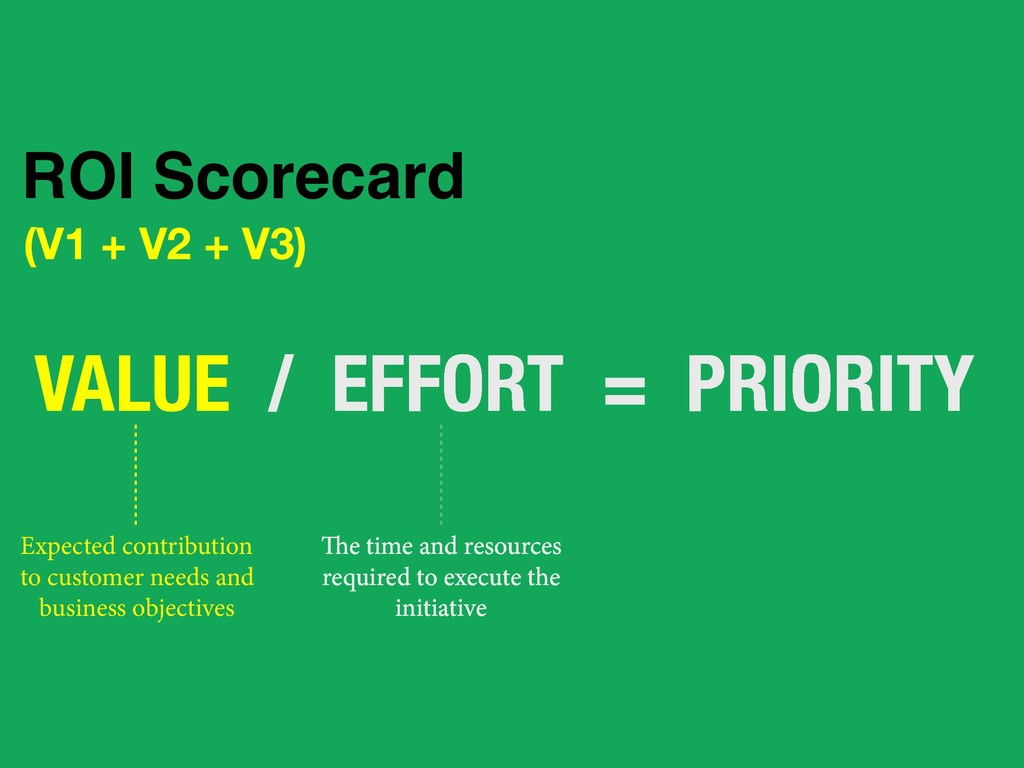
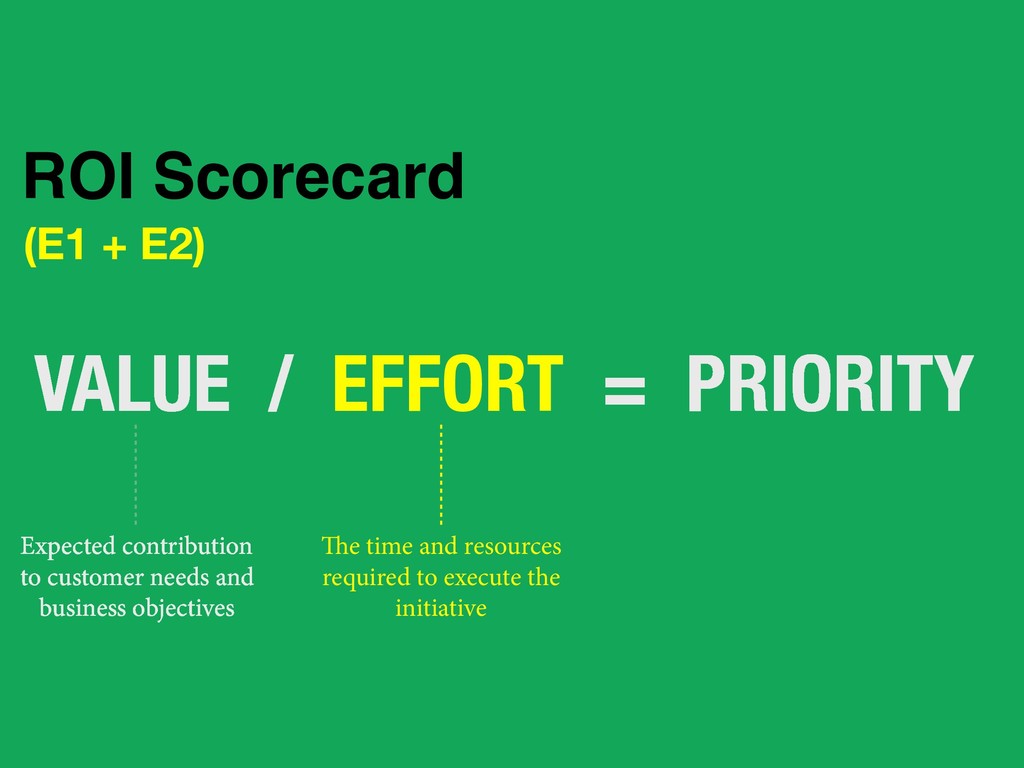
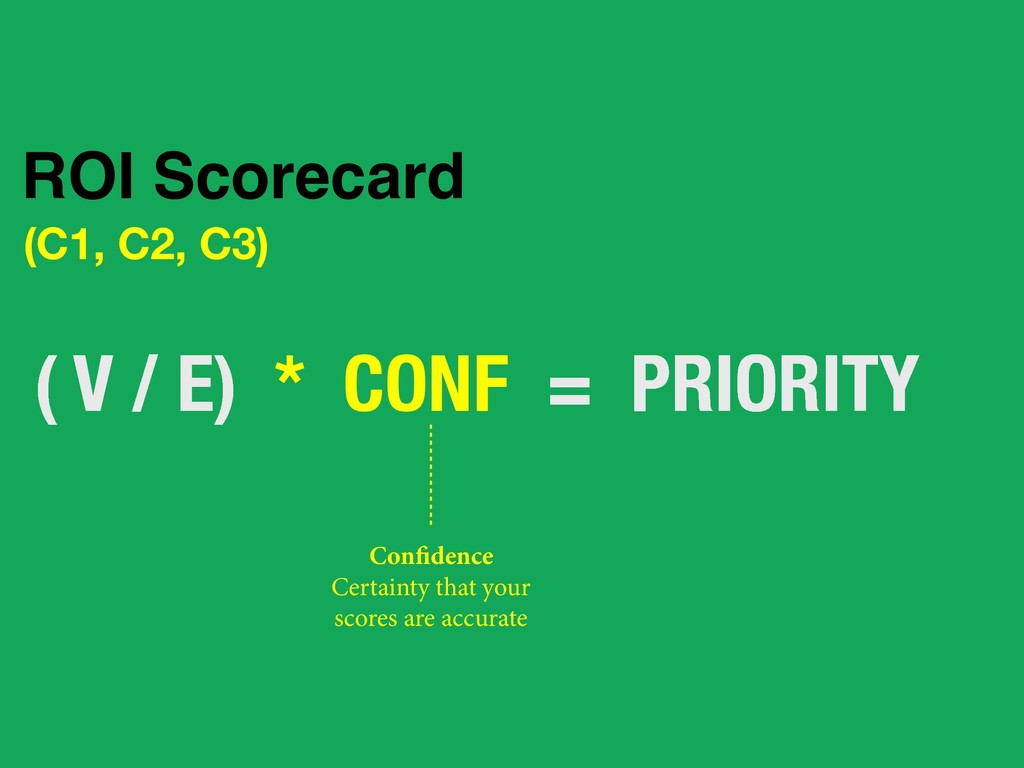
to execute the initiative Expected contribution to customer needs and business objectives ROI Scorecard Define both “bang” and “buck” to ensure you do the most leveraged things first.
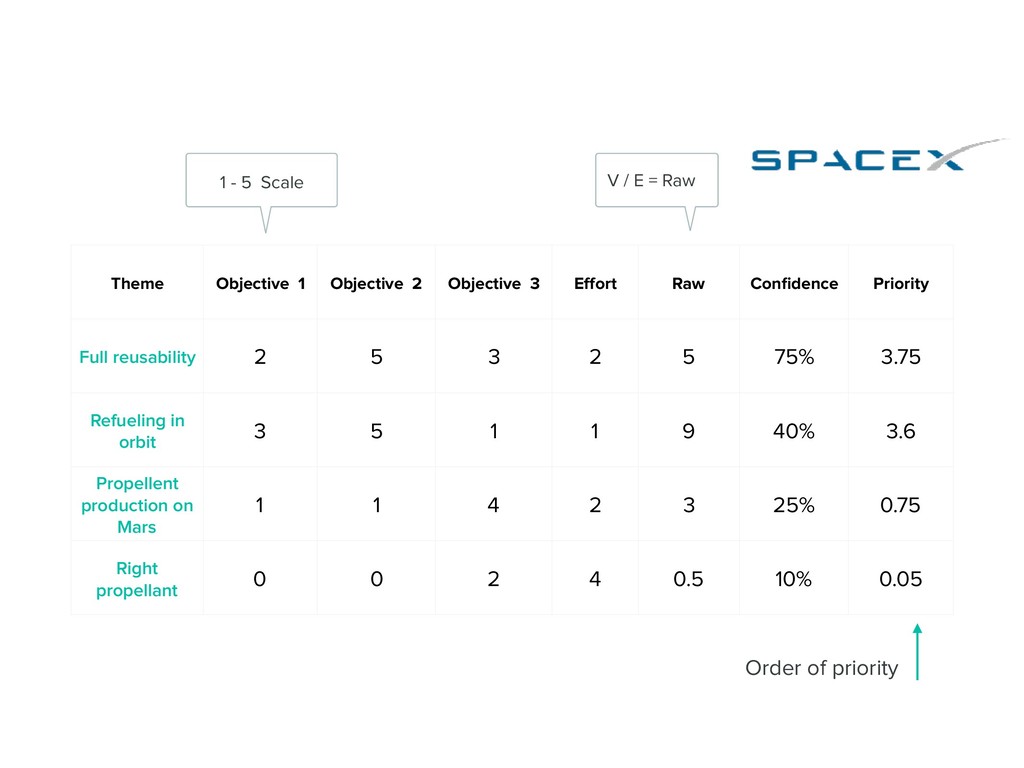
Priority Full reusability 2 5 3 2 5 75% 3.75 Refueling in orbit 3 5 1 1 9 40% 3.6 Propellent production on Mars 1 1 4 2 3 25% 0.75 Right propellant 0 0 2 4 0.5 10% 0.05 Order of priority V / E = Raw 1 - 5 Scale
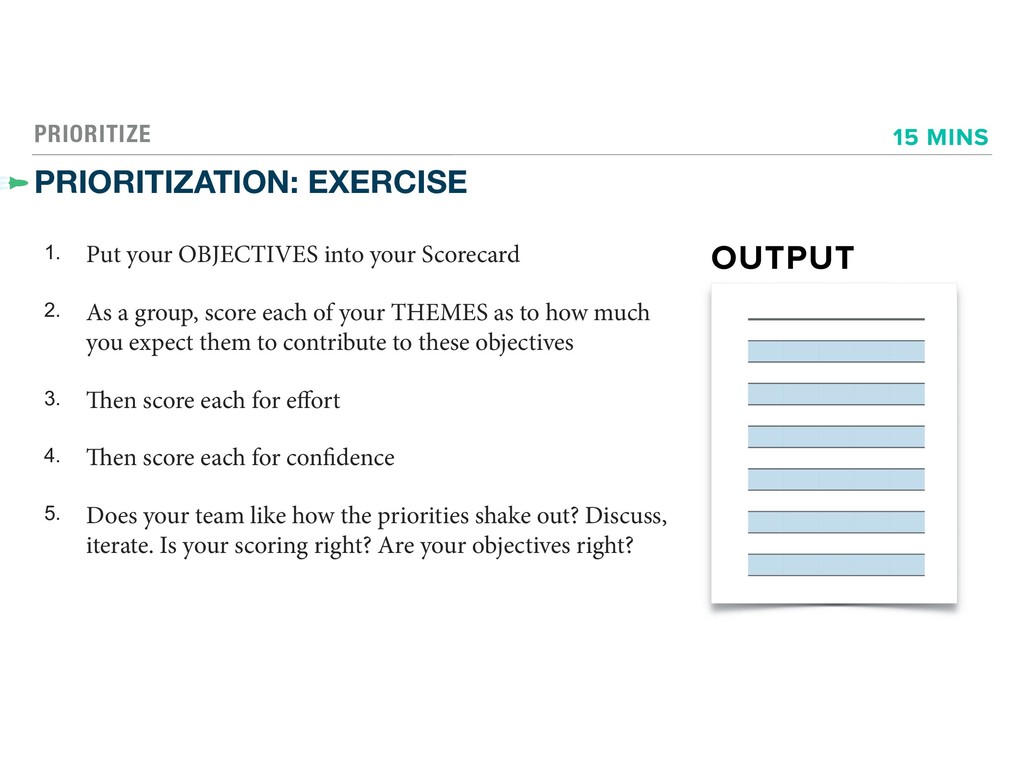
2. As a group, score each of your THEMES as to how much you expect them to contribute to these objectives 3. Then score each for effort 4. Then score each for confidence 5. Does your team like how the priorities shake out? Discuss, iterate. Is your scoring right? Are your objectives right? OUTPUT 15 MINS
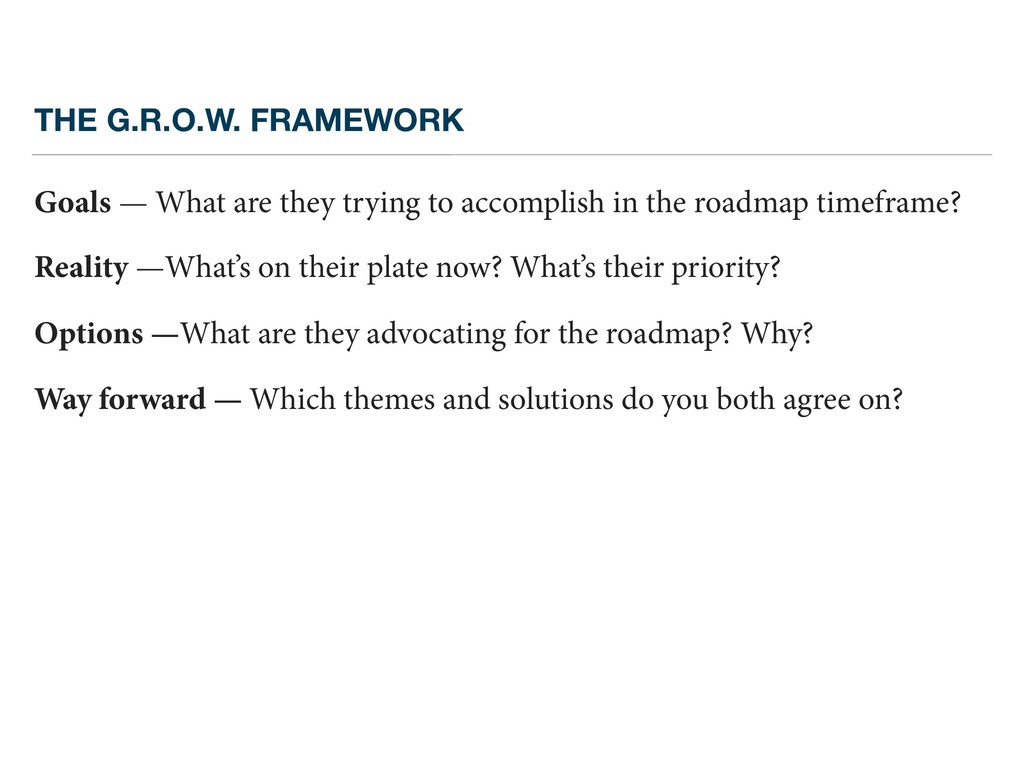
accomplish in the roadmap timeframe? Reality —What’s on their plate now? What’s their priority? Options —What are they advocating for the roadmap? Why? Way forward — Which themes and solutions do you both agree on?
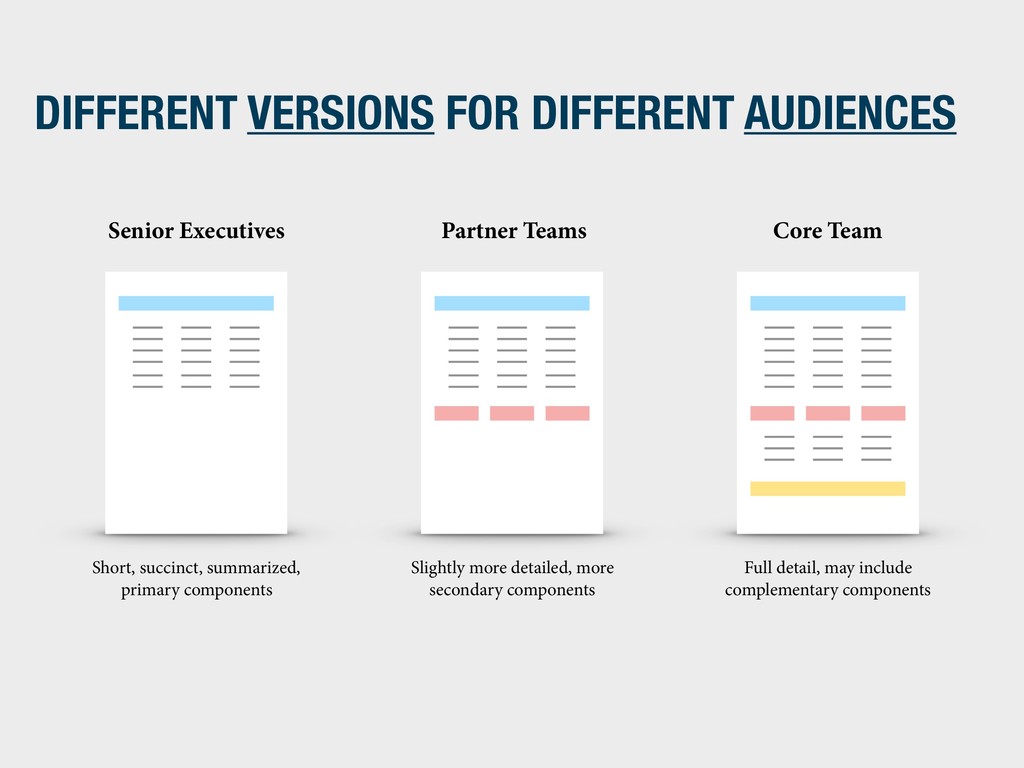
Team Short, succinct, summarized, primary components Slightly more detailed, more secondary components Full detail, may include complementary components
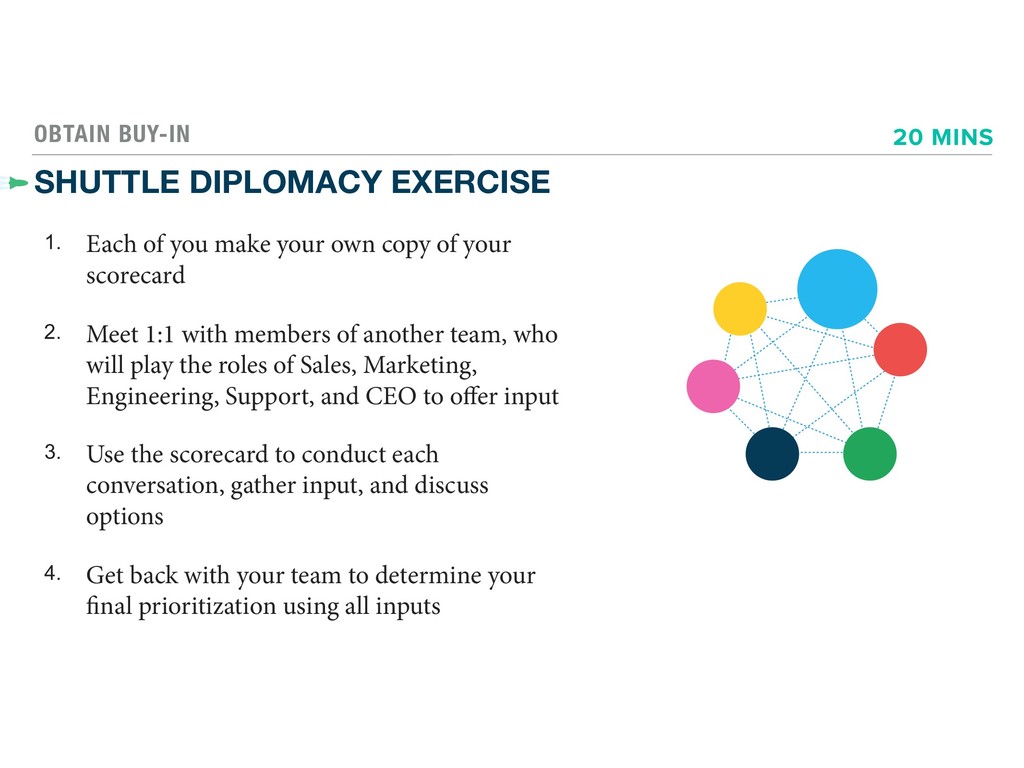
your own copy of your scorecard 2. Meet 1:1 with members of another team, who will play the roles of Sales, Marketing, Engineering, Support, and CEO to offer input 3. Use the scorecard to conduct each conversation, gather input, and discuss options 4. Get back with your team to determine your final prioritization using all inputs 20 MINS
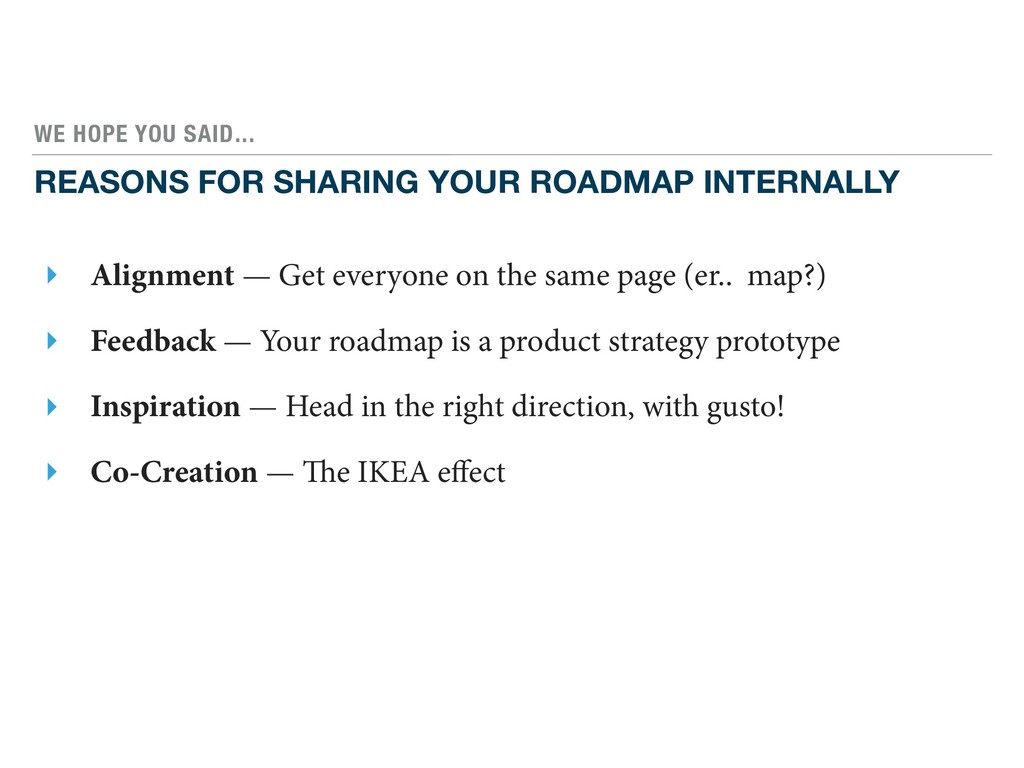
‣ Alignment — Get everyone on the same page (er.. map?) ‣ Feedback — Your roadmap is a product strategy prototype ‣ Inspiration — Head in the right direction, with gusto! ‣ Co-Creation — The IKEA effect
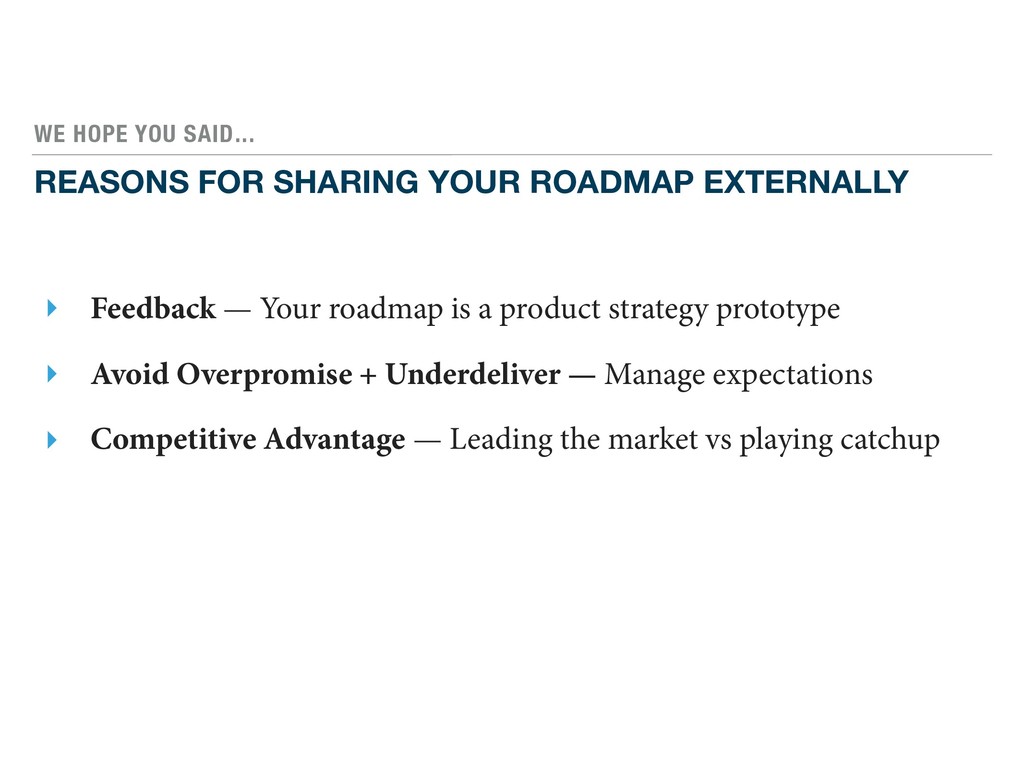
‣ Feedback — Your roadmap is a product strategy prototype ‣ Avoid Overpromise + Underdeliver — Manage expectations ‣ Competitive Advantage — Leading the market vs playing catchup
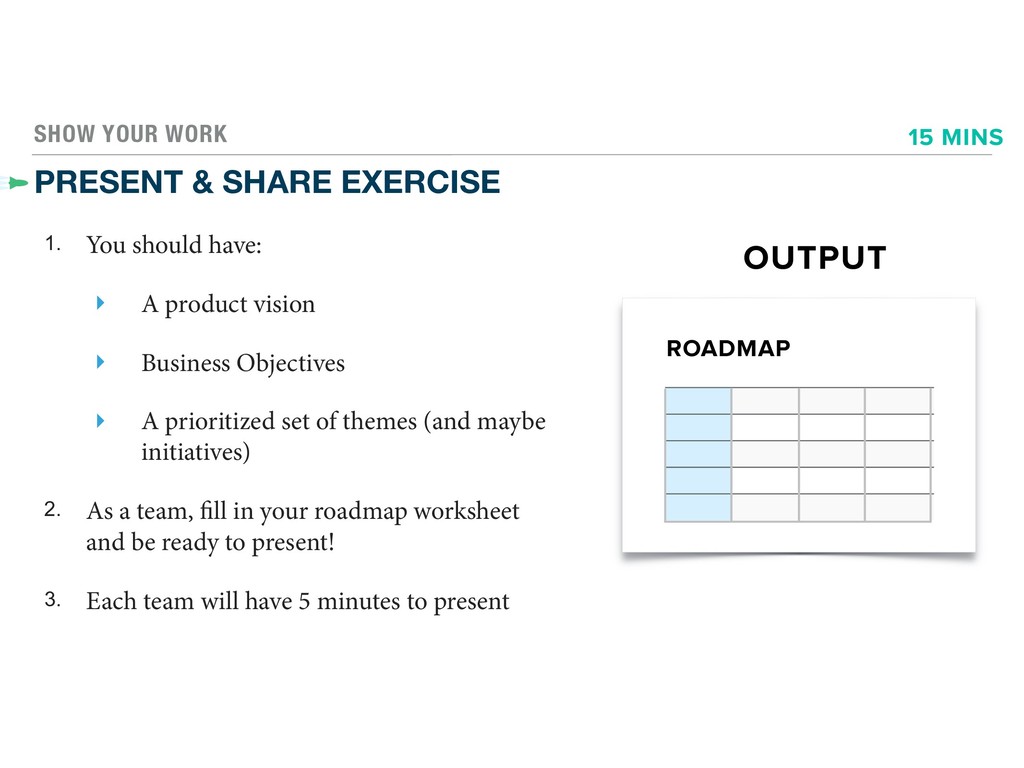
have: ‣ A product vision ‣ Business Objectives ‣ A prioritized set of themes (and maybe initiatives) 2. As a team, fill in your roadmap worksheet and be ready to present! 3. Each team will have 5 minutes to present OUTPUT 15 MINS ROADMAP
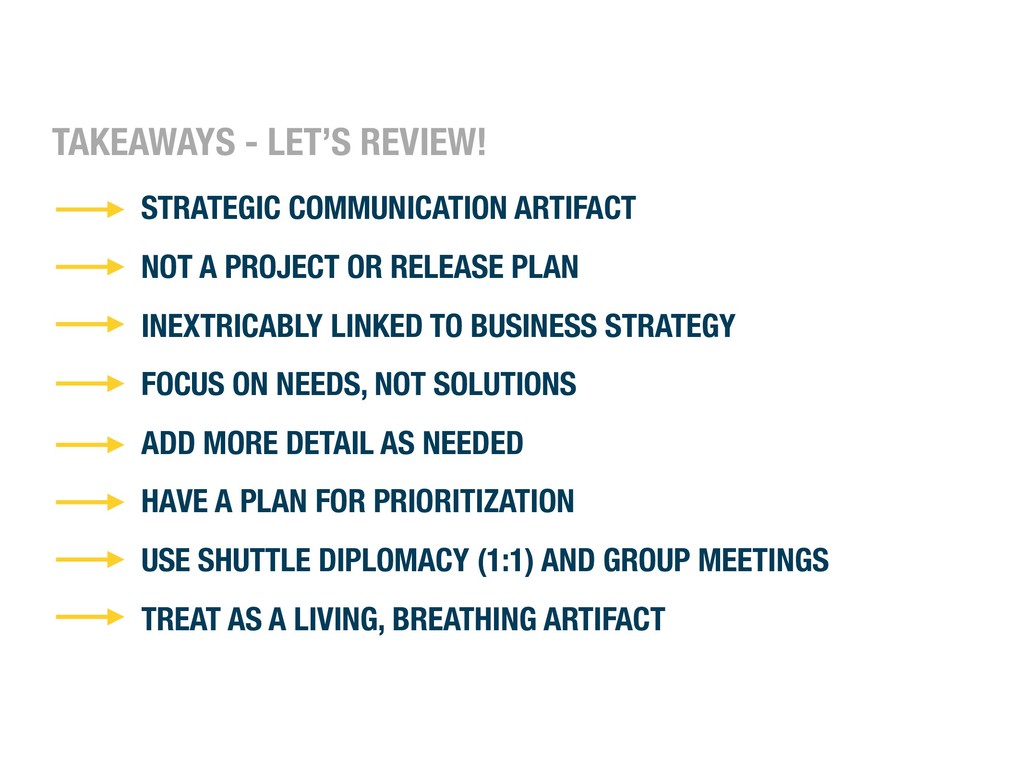
LINKED TO BUSINESS STRATEGY FOCUS ON NEEDS, NOT SOLUTIONS ADD MORE DETAIL AS NEEDED HAVE A PLAN FOR PRIORITIZATION USE SHUTTLE DIPLOMACY (1:1) AND GROUP MEETINGS TREAT AS A LIVING, BREATHING ARTIFACT TAKEAWAYS - LET’S REVIEW!
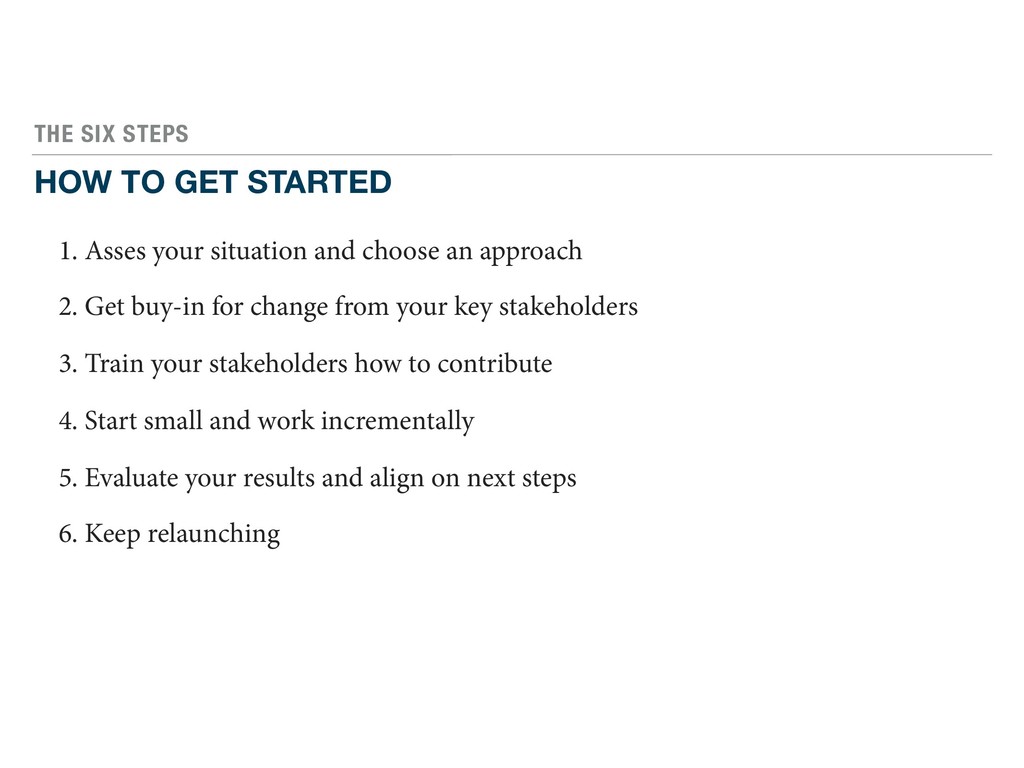
situation and choose an approach 2. Get buy-in for change from your key stakeholders 3. Train your stakeholders how to contribute 4. Start small and work incrementally 5. Evaluate your results and align on next steps 6. Keep relaunching