Measuring Event Operational Performance Turning event transportation data into practical insights for the next operation. Event Transport Intelligence 01
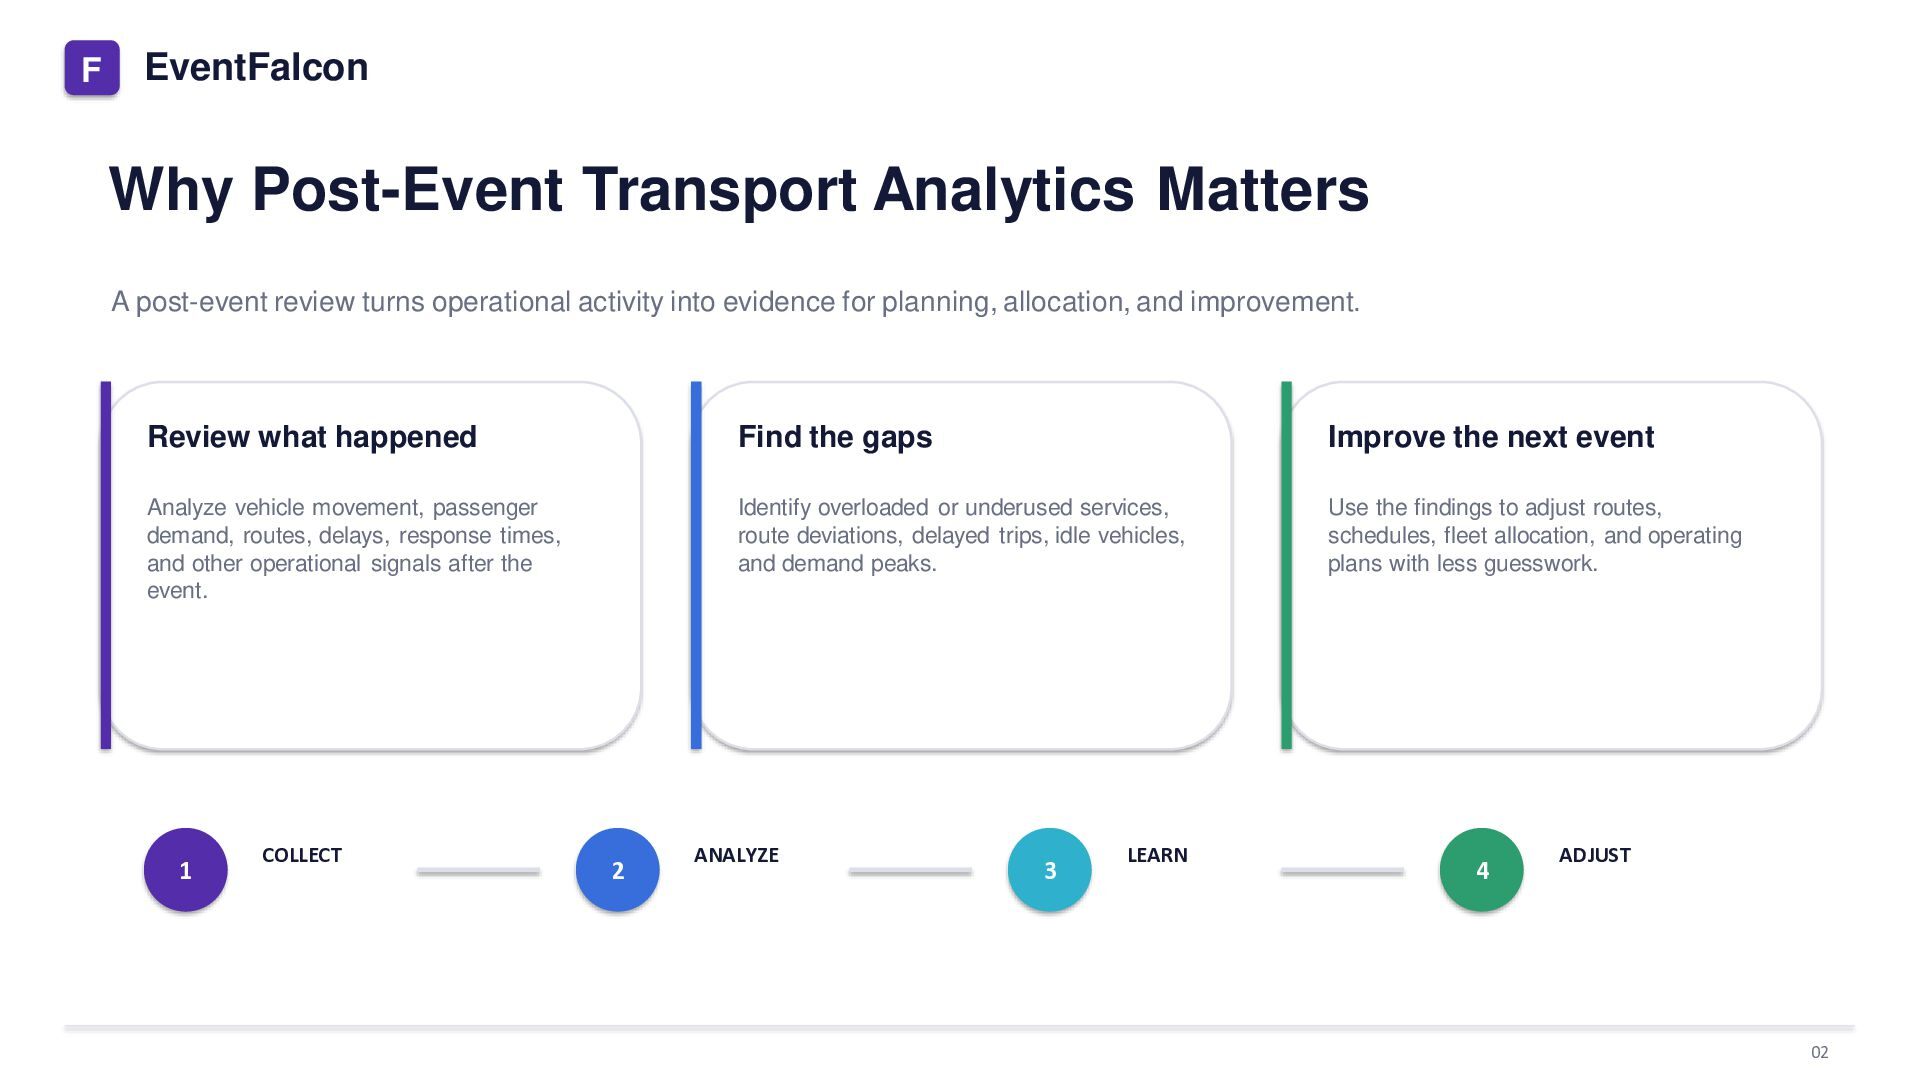
turns operational activity into evidence for planning, allocation, and improvement. Review what happened Find the gaps Improve the next event Analyze vehicle movement, passenger demand, routes, delays, response times, and other operational signals after the event. Identify overloaded or underused services, route deviations, delayed trips, idle vehicles, and demand peaks. Use the findings to adjust routes, schedules, fleet allocation, and operating plans with less guesswork. 1 COLLECT 2 ANALYZE 3 LEARN 4 ADJUST 02
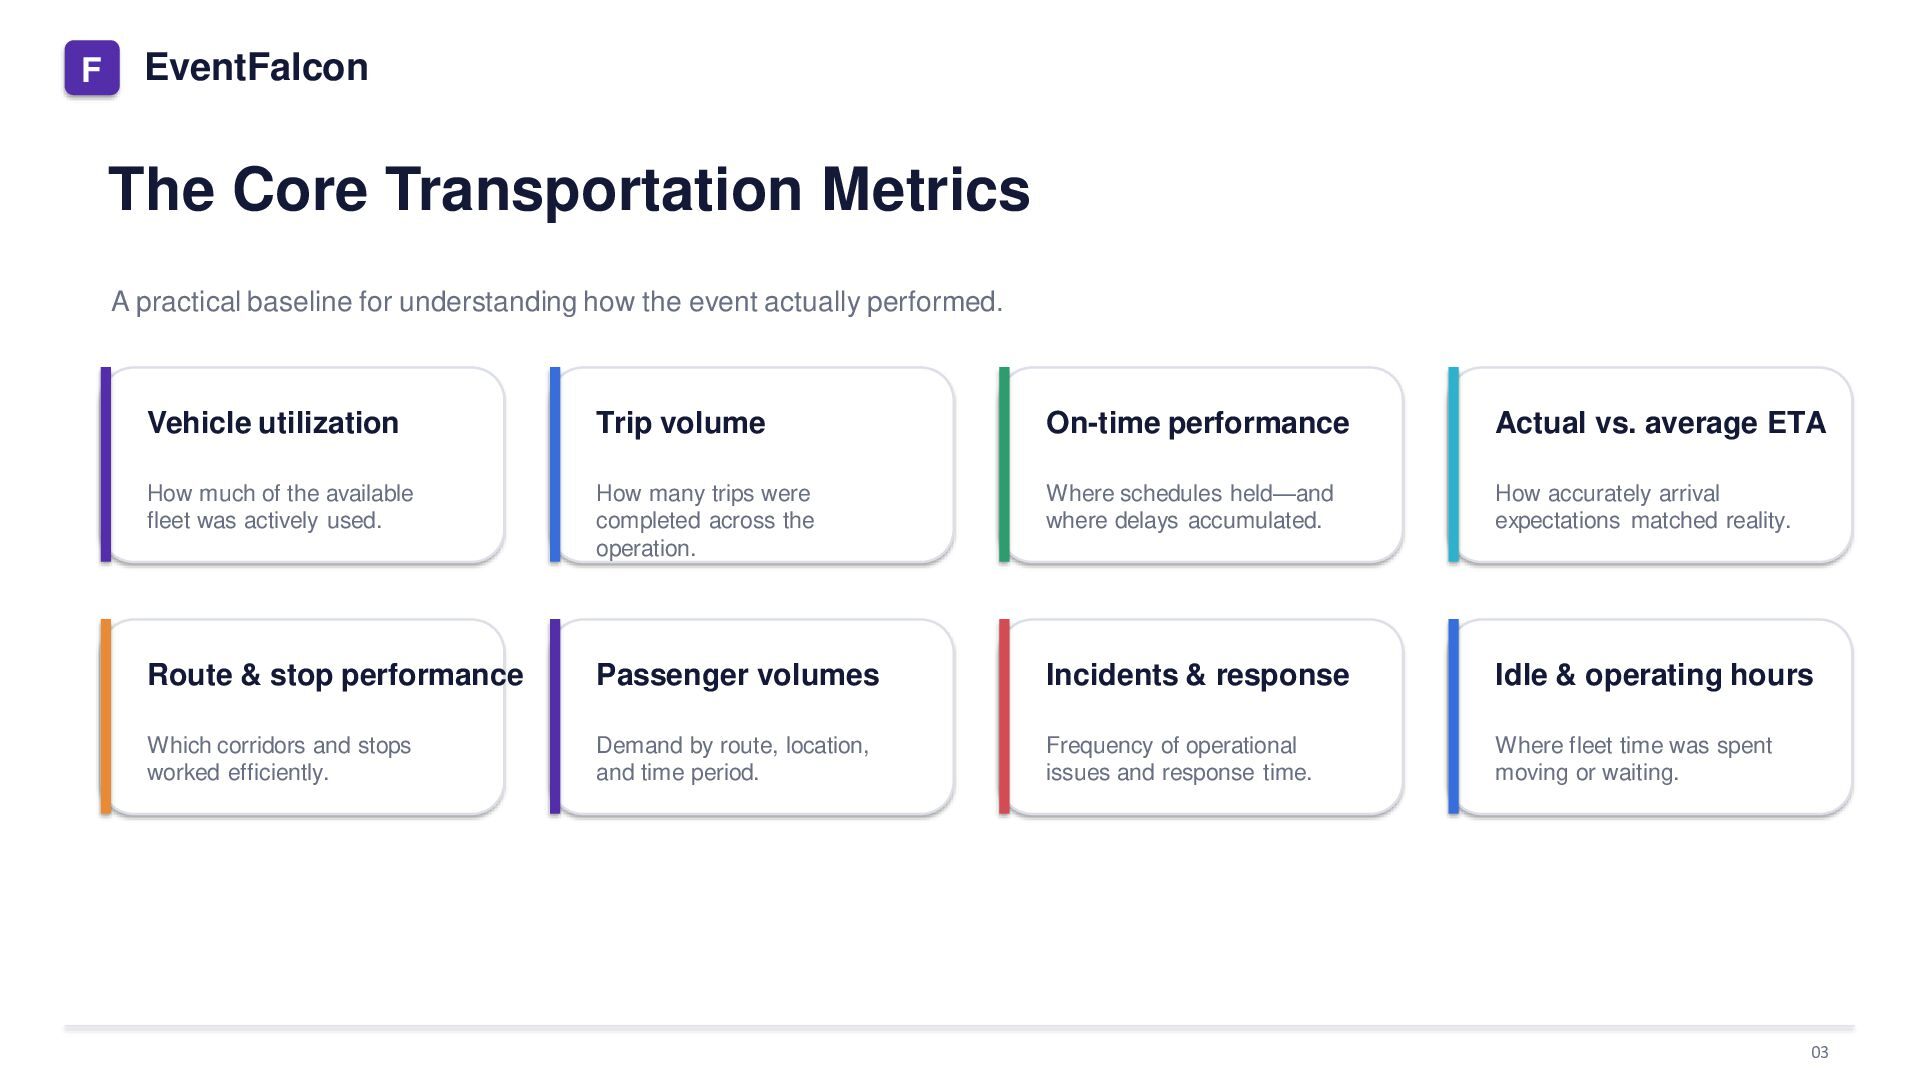
understanding how the event actually performed. Vehicle utilization Trip volume On-time performance Actual vs. average ETA How much of the available fleet was actively used. How many trips were completed across the operation. Where schedules held—and where delays accumulated. How accurately arrival expectations matched reality. Route & stop performance Passenger volumes Incidents & response Idle & operating hours Which corridors and stops worked efficiently. Demand by route, location, and time period. Frequency of operational issues and response time. Where fleet time was spent moving or waiting. 03
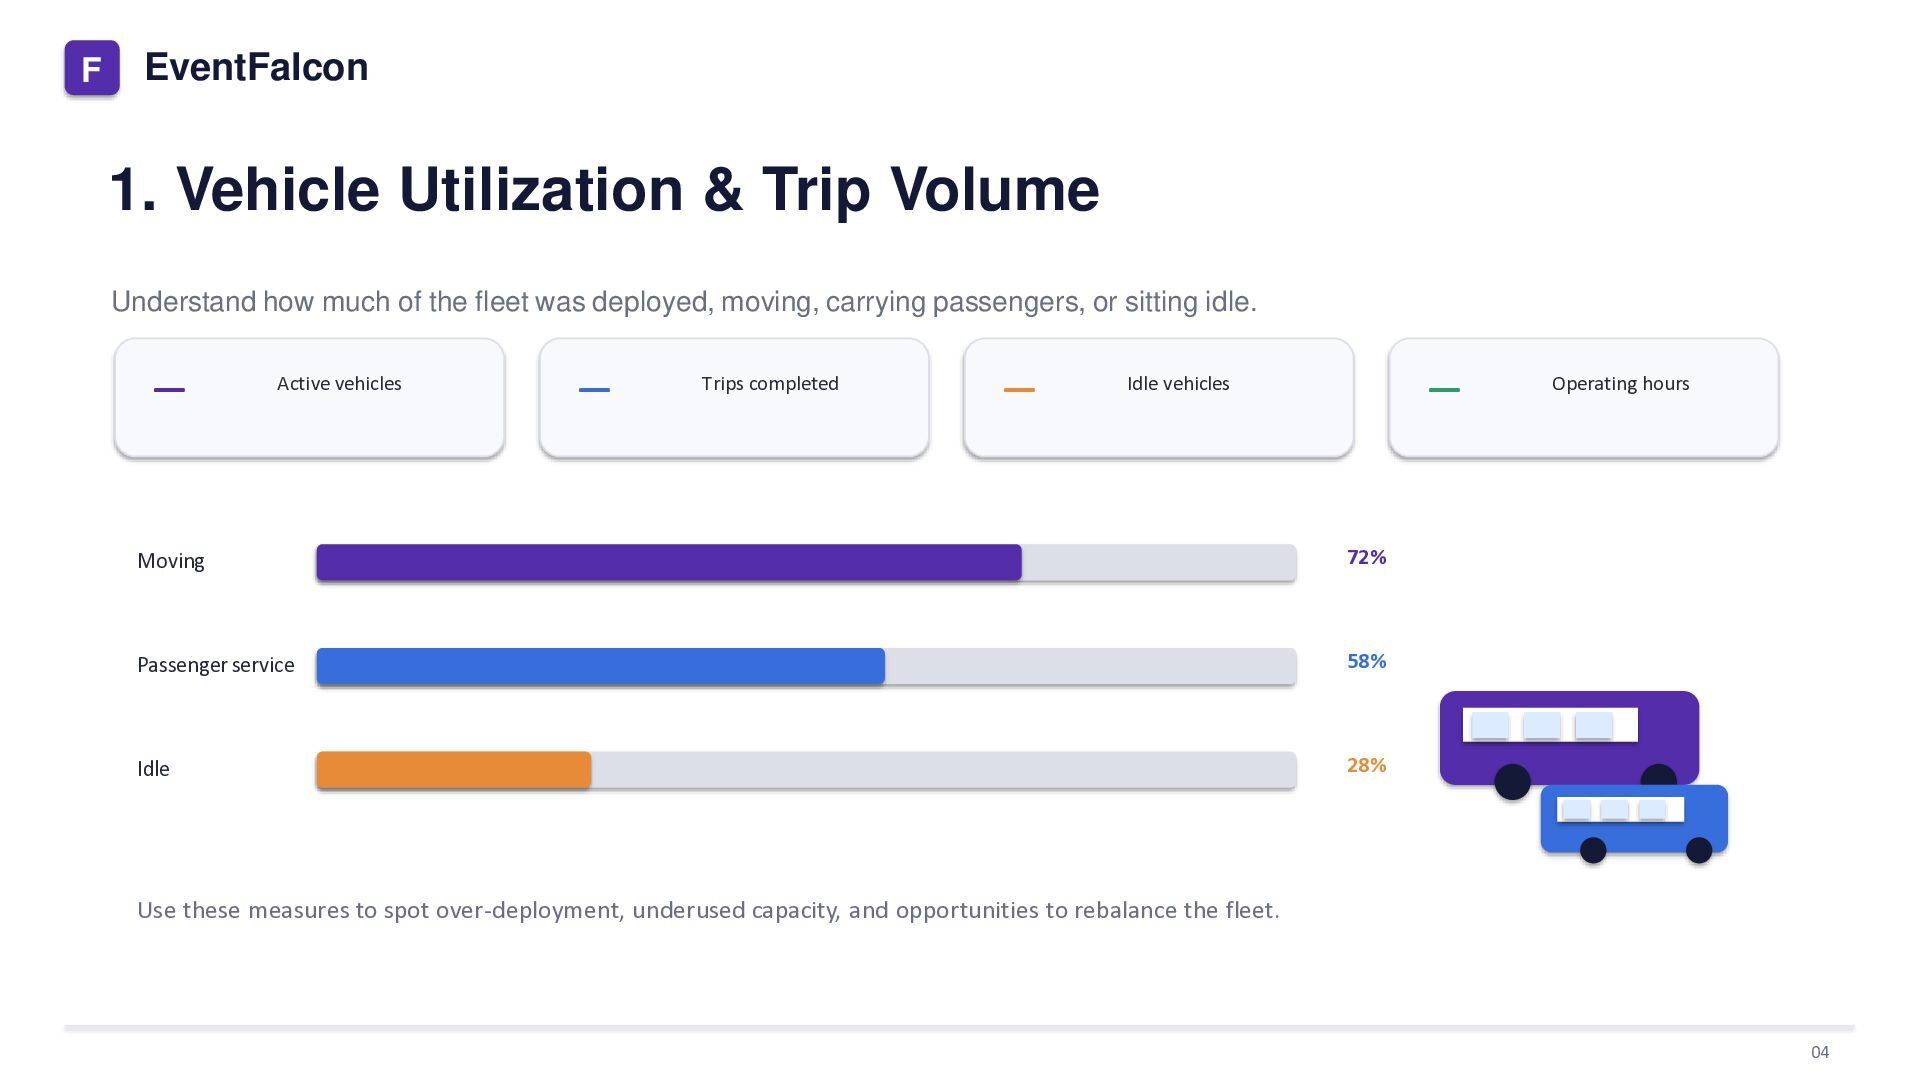
much of the fleet was deployed, moving, carrying passengers, or sitting idle. — Active vehicles — Trips completed — — Idle vehicles Moving 72% Passenger service 58% Idle 28% Operating hours Use these measures to spot over-deployment, underused capacity, and opportunities to rebalance the fleet. 04
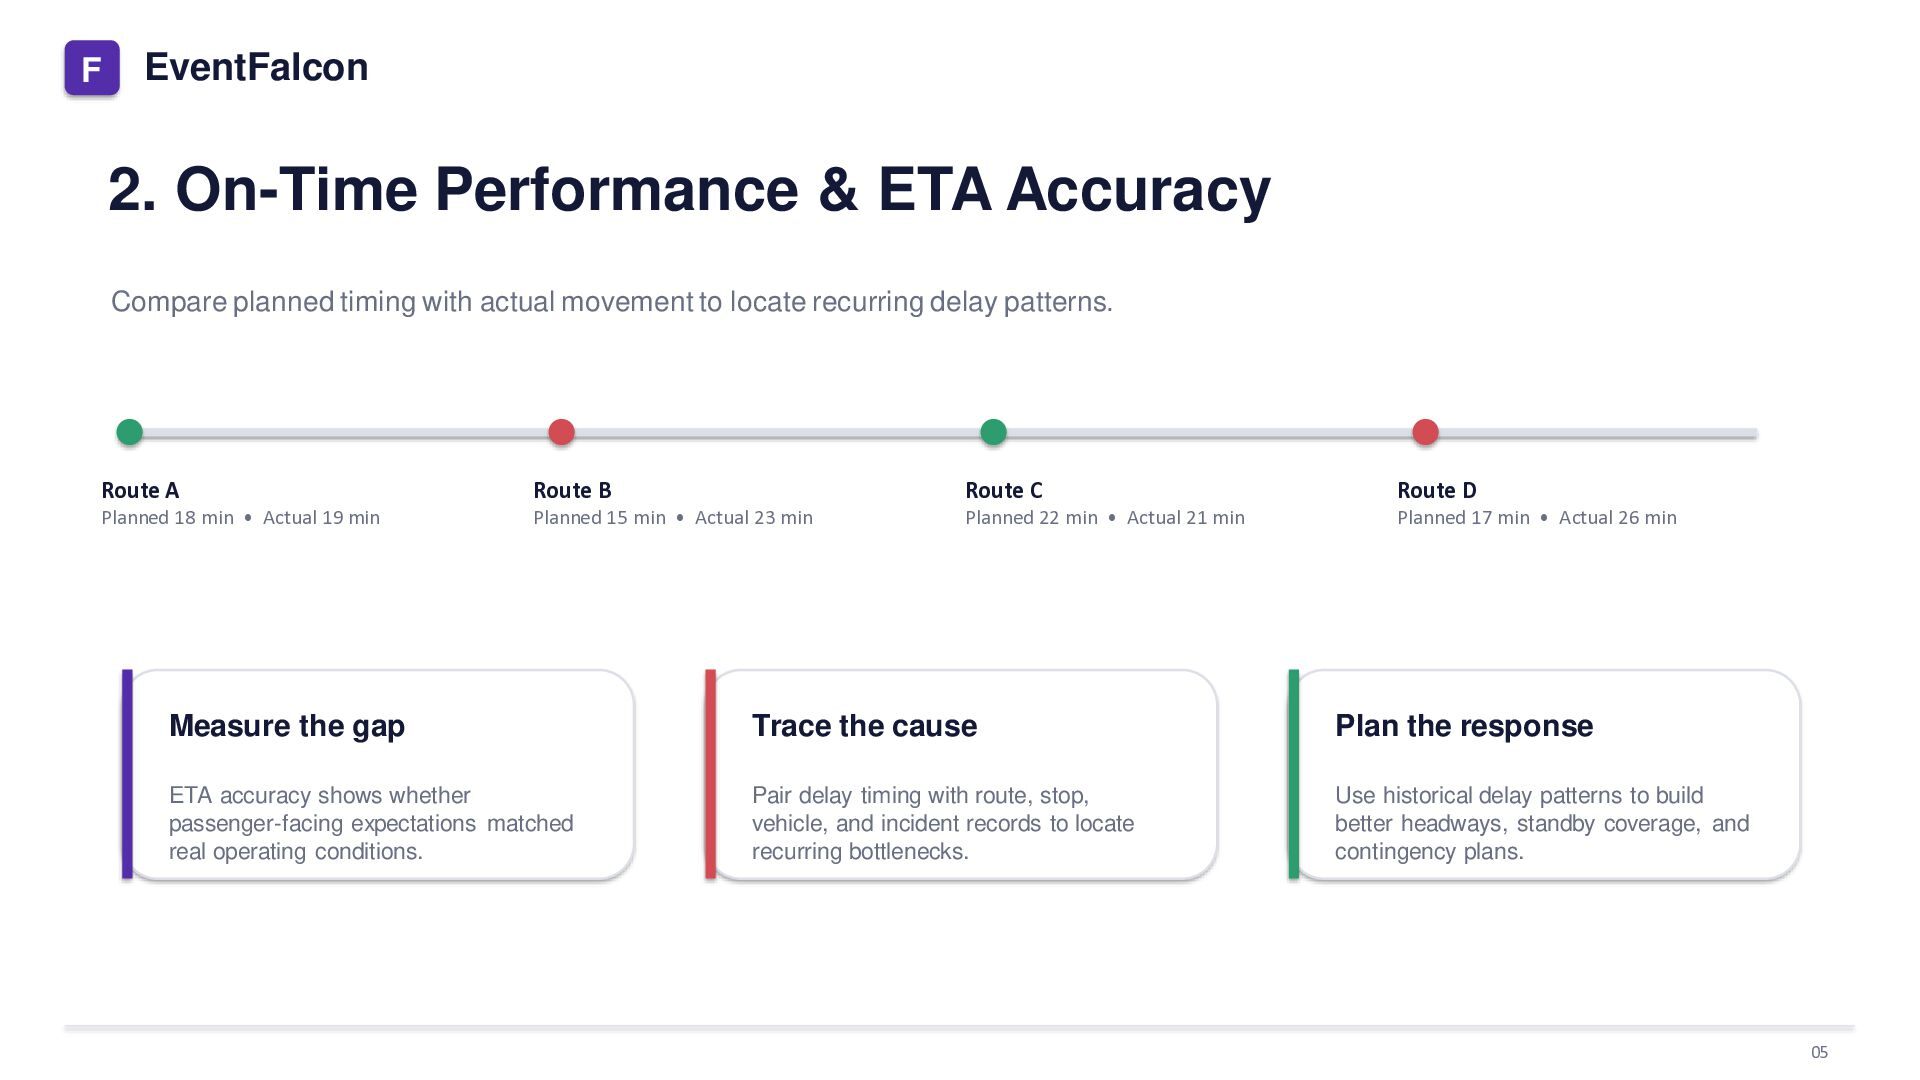
timing with actual movement to locate recurring delay patterns. Route A Route B Route C Route D Planned 18 min • Actual 19 min Planned 15 min • Actual 23 min Planned 22 min • Actual 21 min Planned 17 min • Actual 26 min Measure the gap Trace the cause Plan the response ETA accuracy shows whether passenger-facing expectations matched real operating conditions. Pair delay timing with route, stop, vehicle, and incident records to locate recurring bottlenecks. Use historical delay patterns to build better headways, standby coverage, and contingency plans. 05
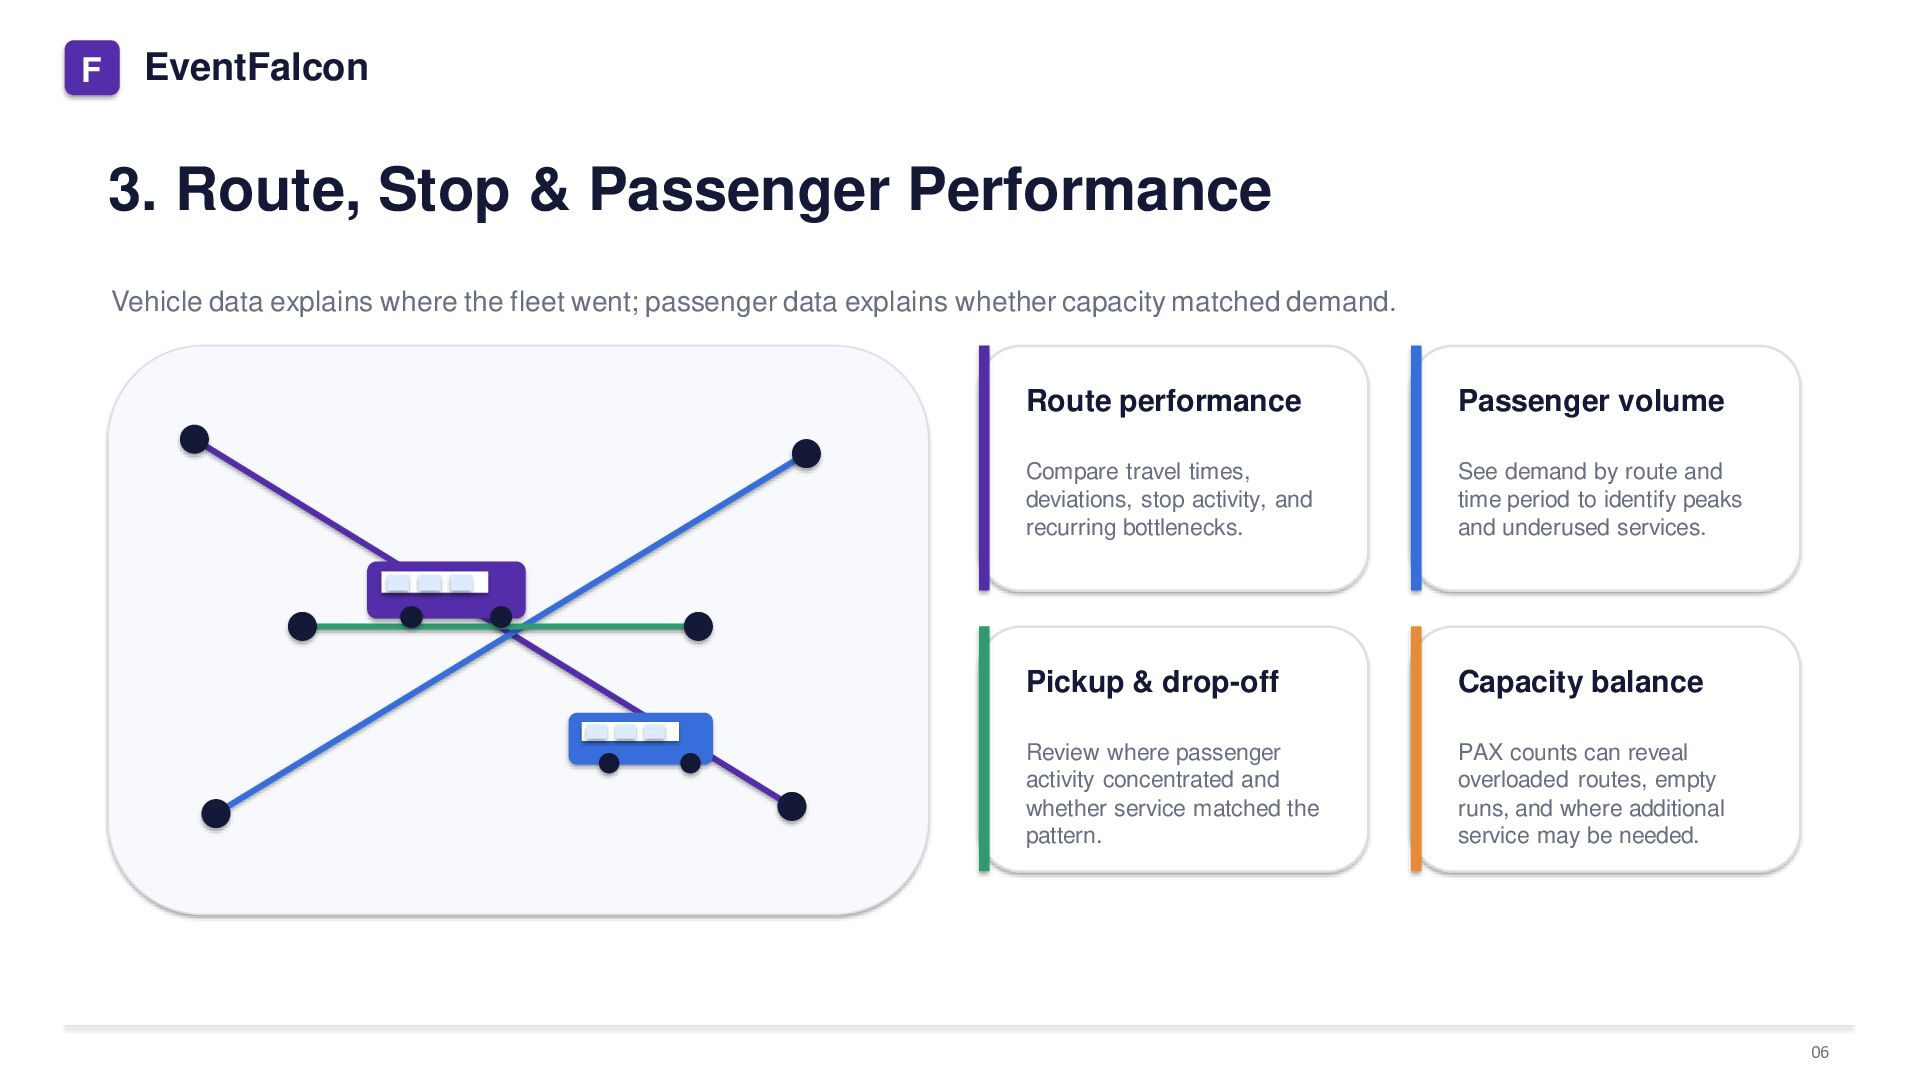
explains where the fleet went; passenger data explains whether capacity matched demand. Route performance Passenger volume Compare travel times, deviations, stop activity, and recurring bottlenecks. See demand by route and time period to identify peaks and underused services. Pickup & drop-off Capacity balance Review where passenger activity concentrated and whether service matched the pattern. PAX counts can reveal overloaded routes, empty runs, and where additional service may be needed. 06
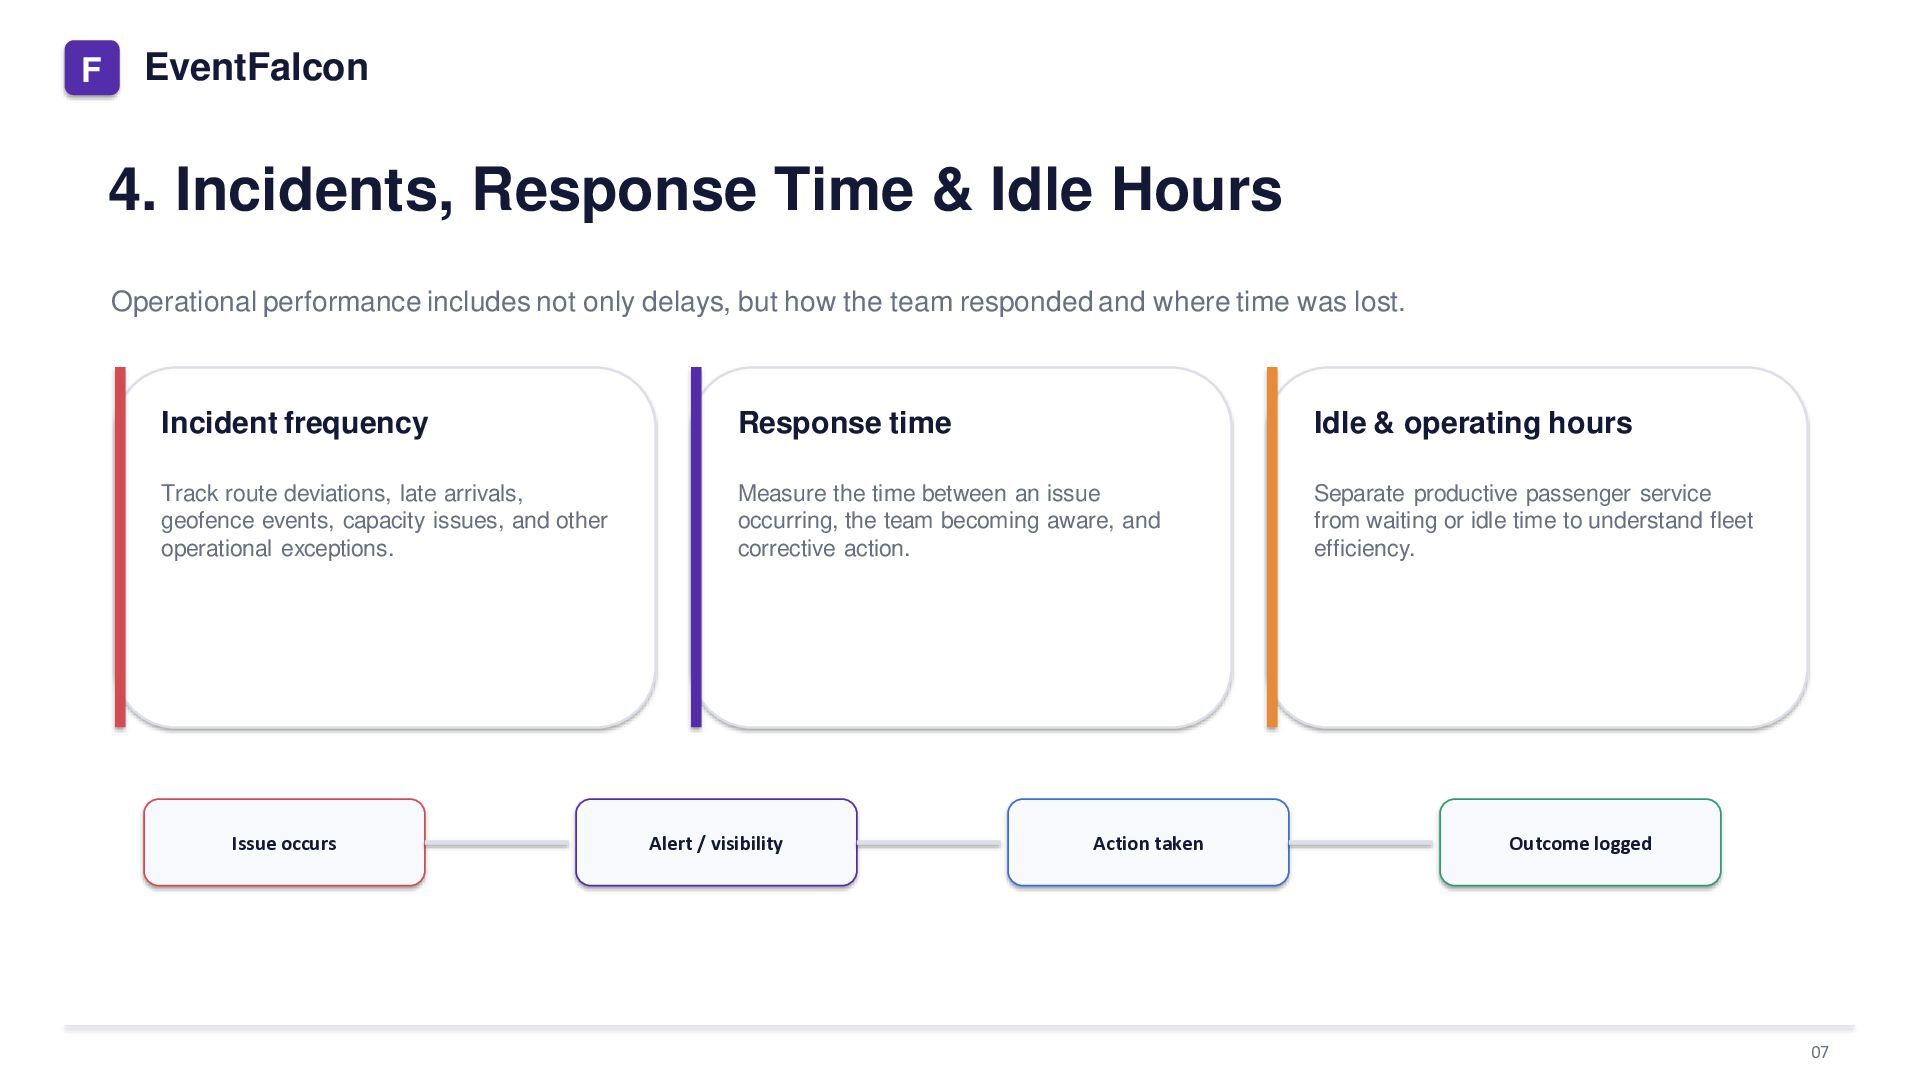
performance includes not only delays, but how the team responded and where time was lost. Incident frequency Response time Idle & operating hours Track route deviations, late arrivals, geofence events, capacity issues, and other operational exceptions. Measure the time between an issue occurring, the team becoming aware, and corrective action. Separate productive passenger service from waiting or idle time to understand fleet efficiency. Issue occurs Alert / visibility Action taken Outcome logged 07
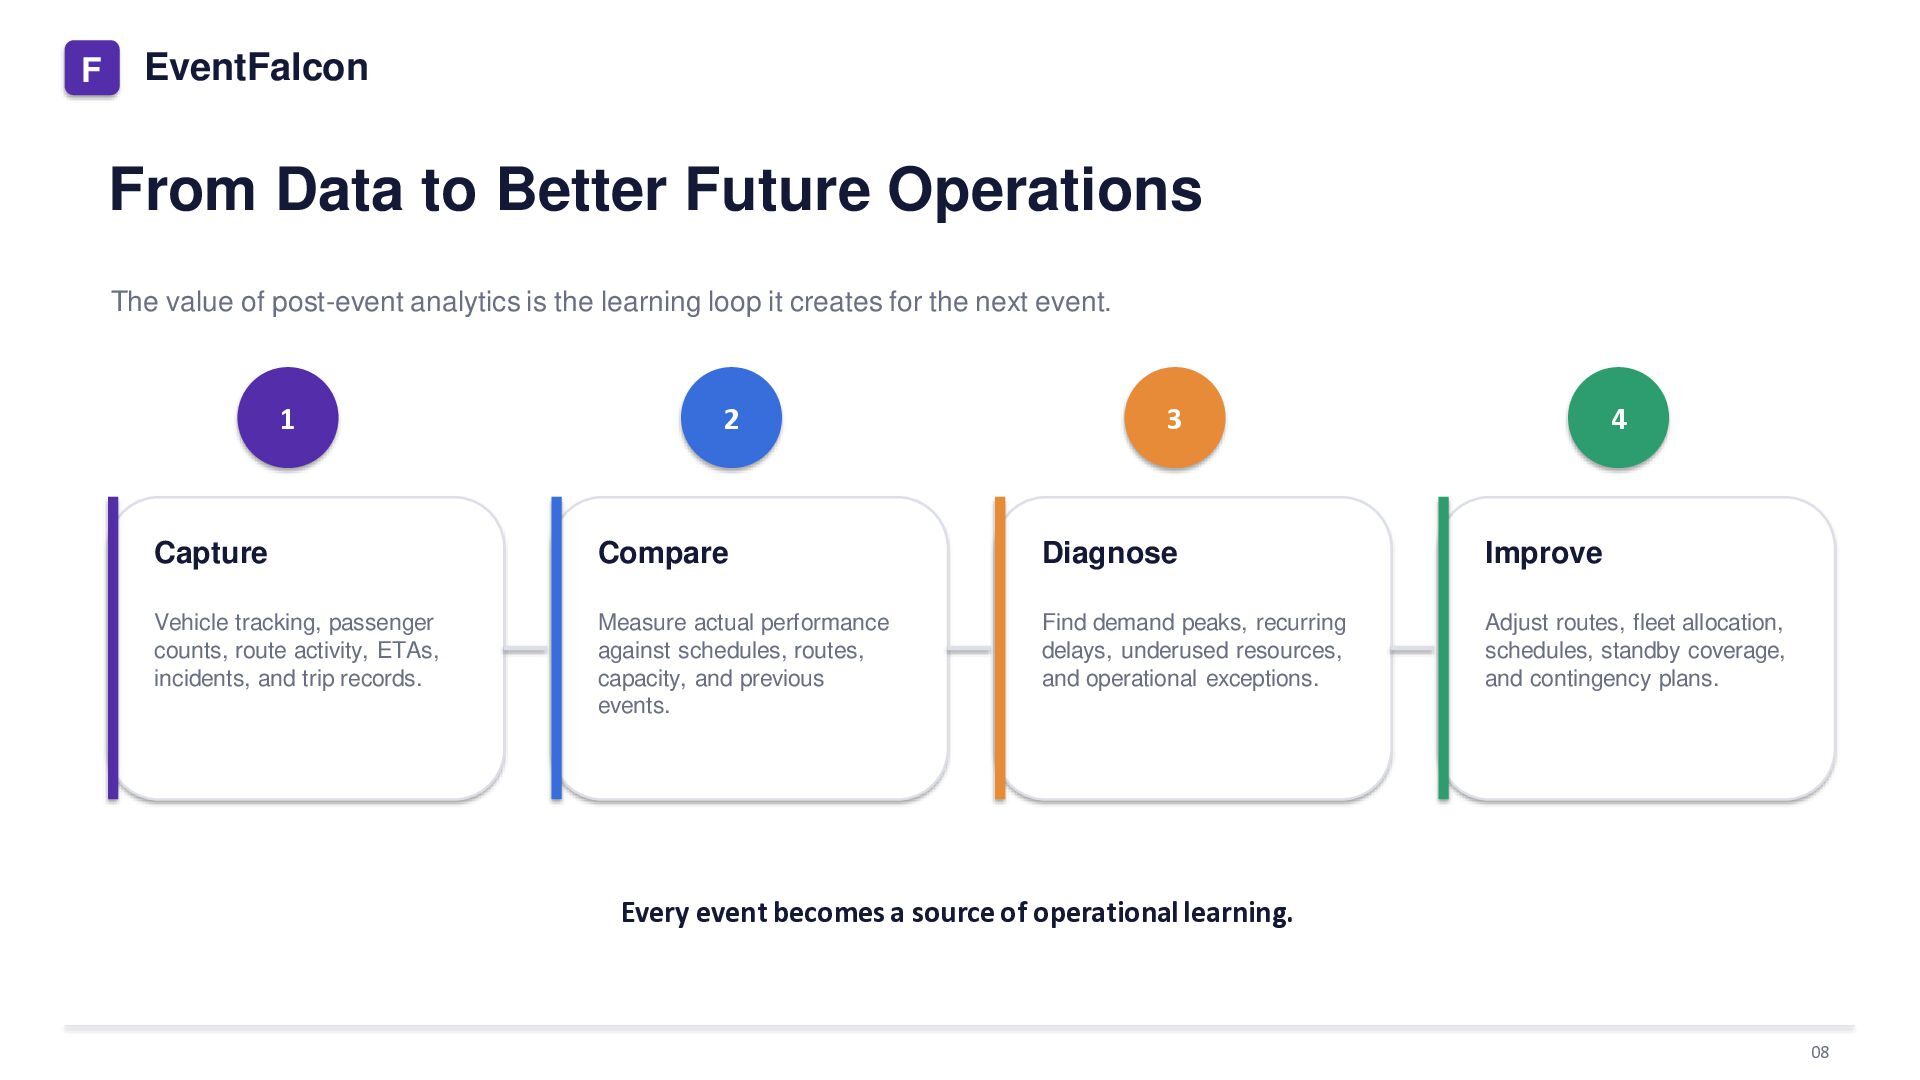
of post-event analytics is the learning loop it creates for the next event. 1 2 3 4 Capture Compare Diagnose Improve Vehicle tracking, passenger counts, route activity, ETAs, incidents, and trip records. Measure actual performance against schedules, routes, capacity, and previous events. Find demand peaks, recurring delays, underused resources, and operational exceptions. Adjust routes, fleet allocation, schedules, standby coverage, and contingency plans. Every event becomes a source of operational learning. 08
Use post-event transportation data to understand performance, explain operational gaps, and plan with evidence. Based on the EventFalcon article published September 22, 2026. eventfalcon.com Event Transport Intelligence Platform 09


 eventfalcon_01
 kenichiodo
 maimyyym
 yu23ki14
 pfn
 grimoh
 onk
 ykanoh
 carta_engineering
 shuta13
 riyaamemiya
 techtekt
 prog893
 nmsamuel
 tomoyanonymous
 baasie
 mongodb
 thoeni
 addyosmani
 nikkihalliwell
 madoxten
 katarinadahlin
 lauravandoore
 eileencodes
 greggifford