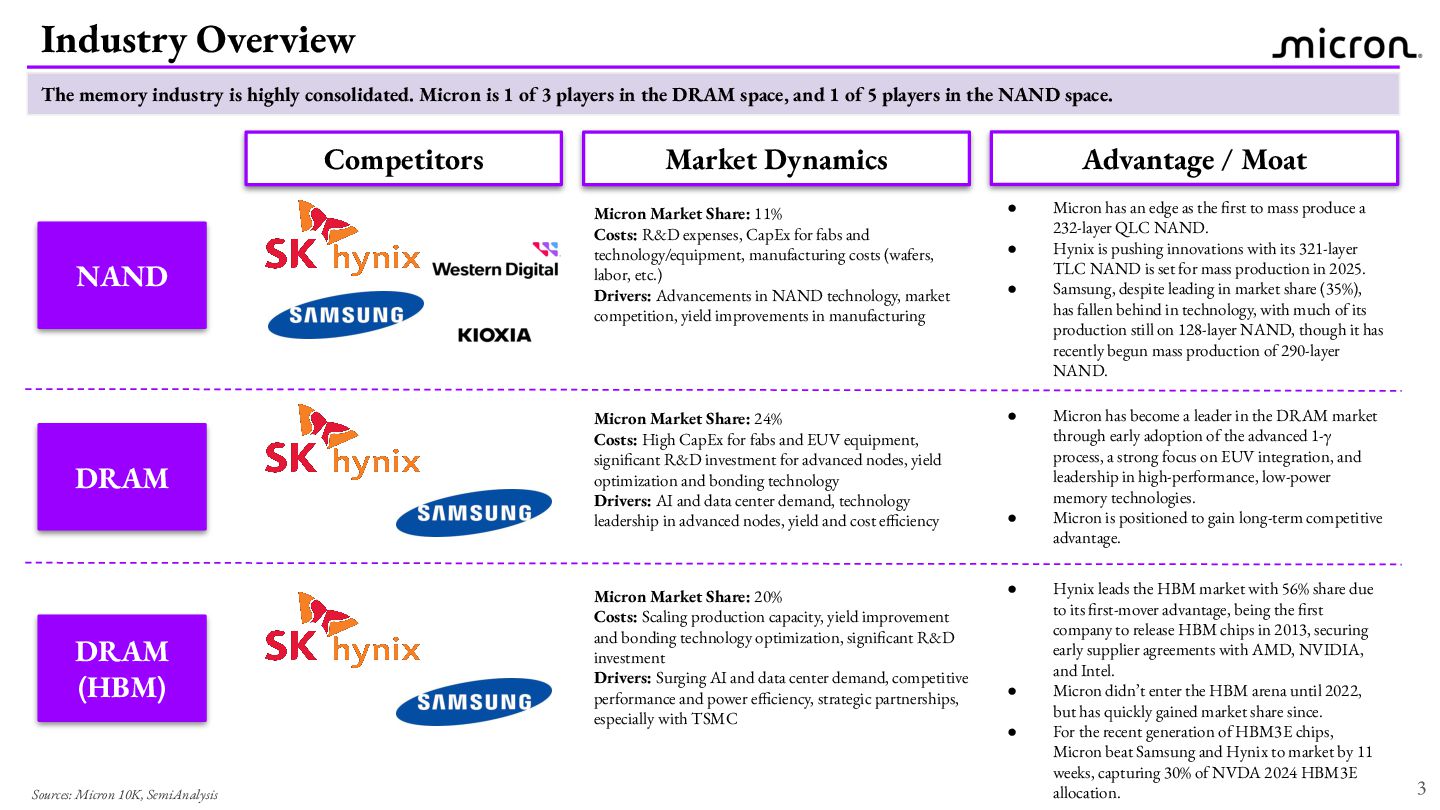
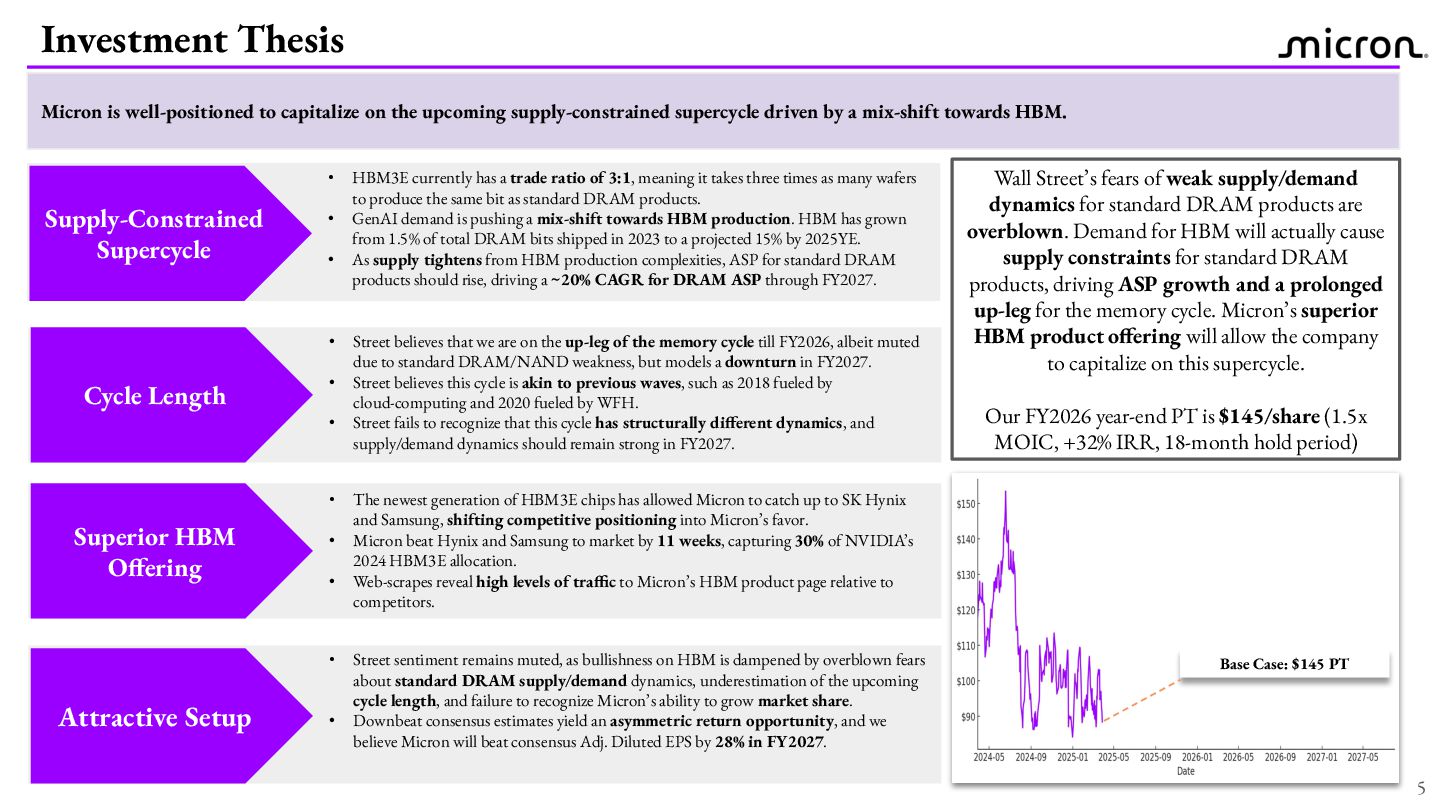
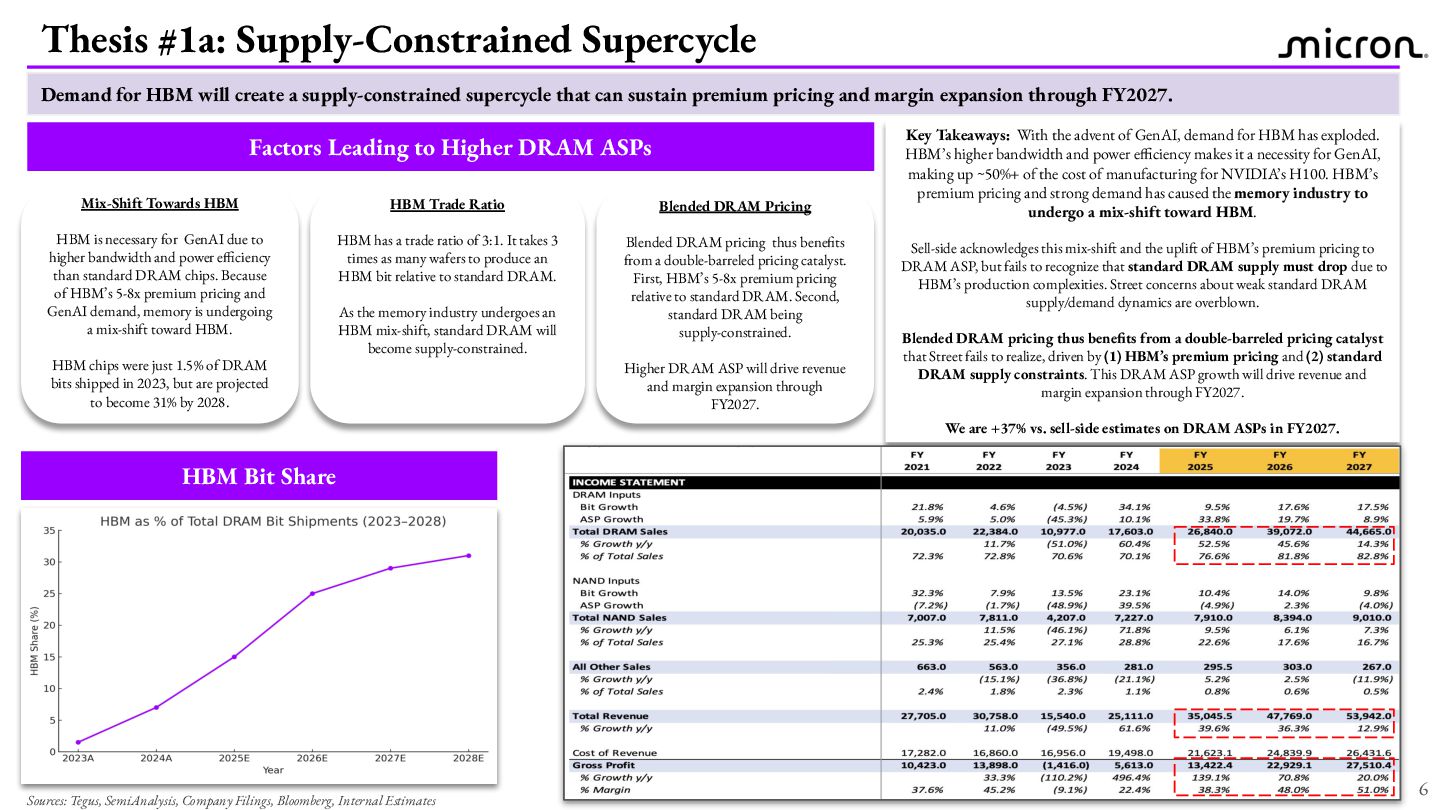
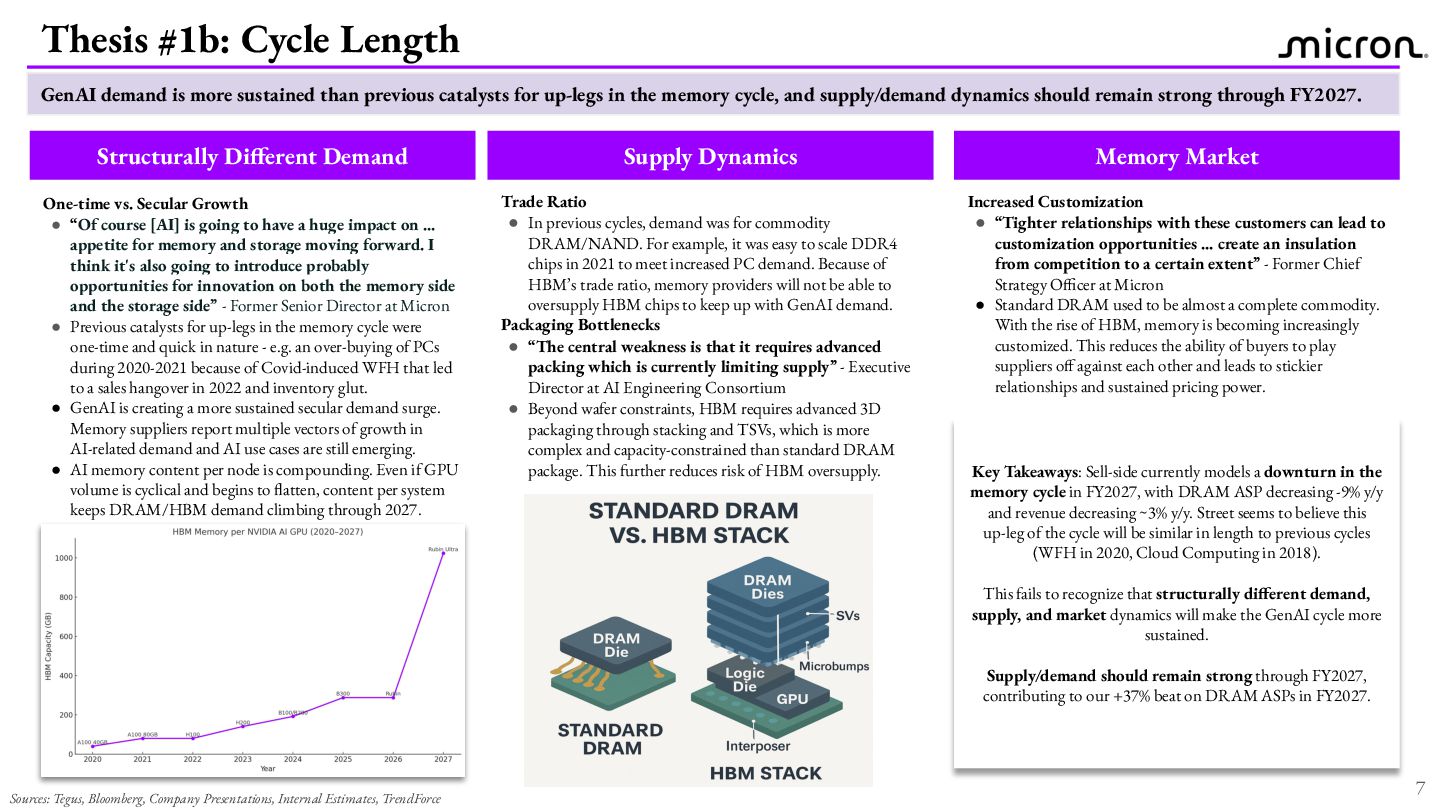
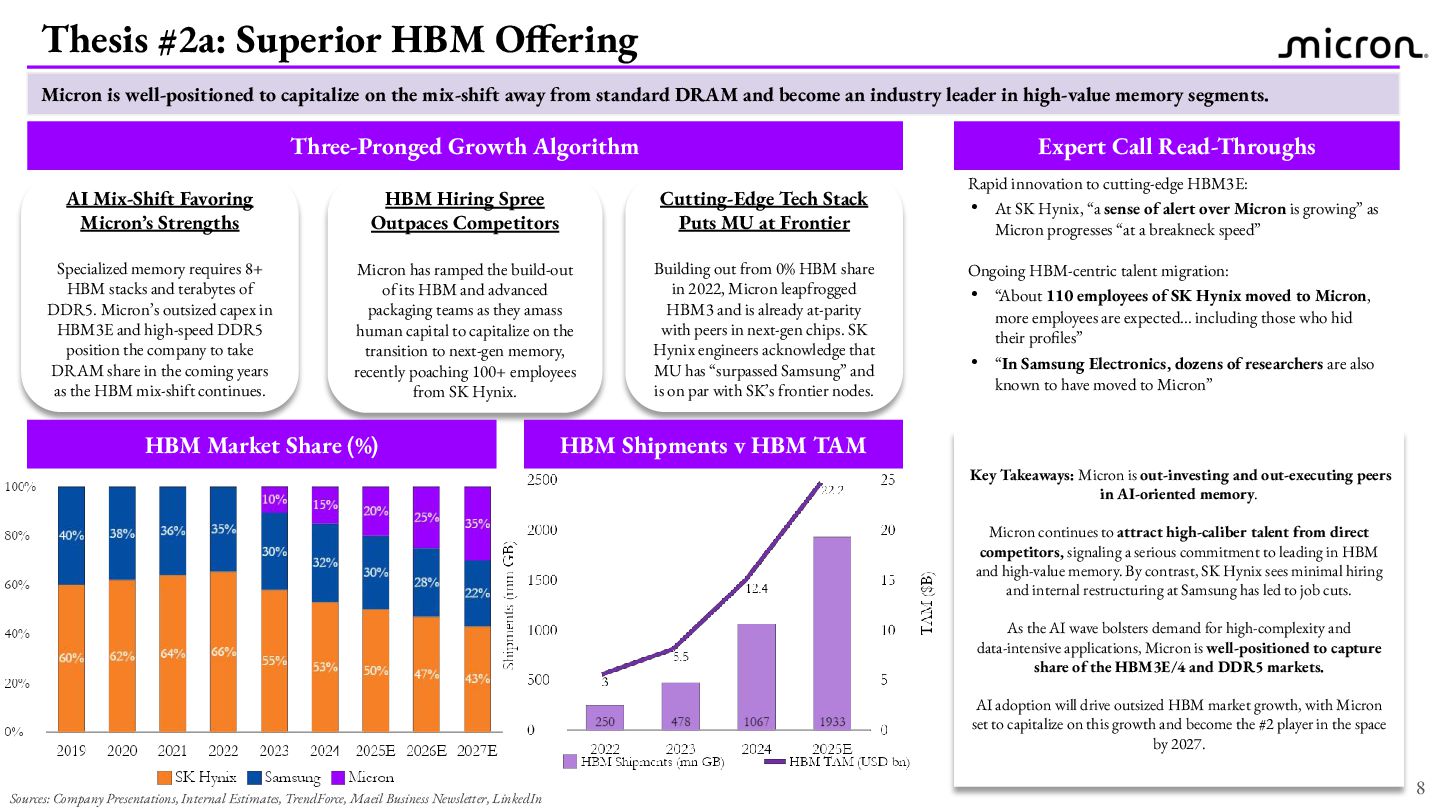
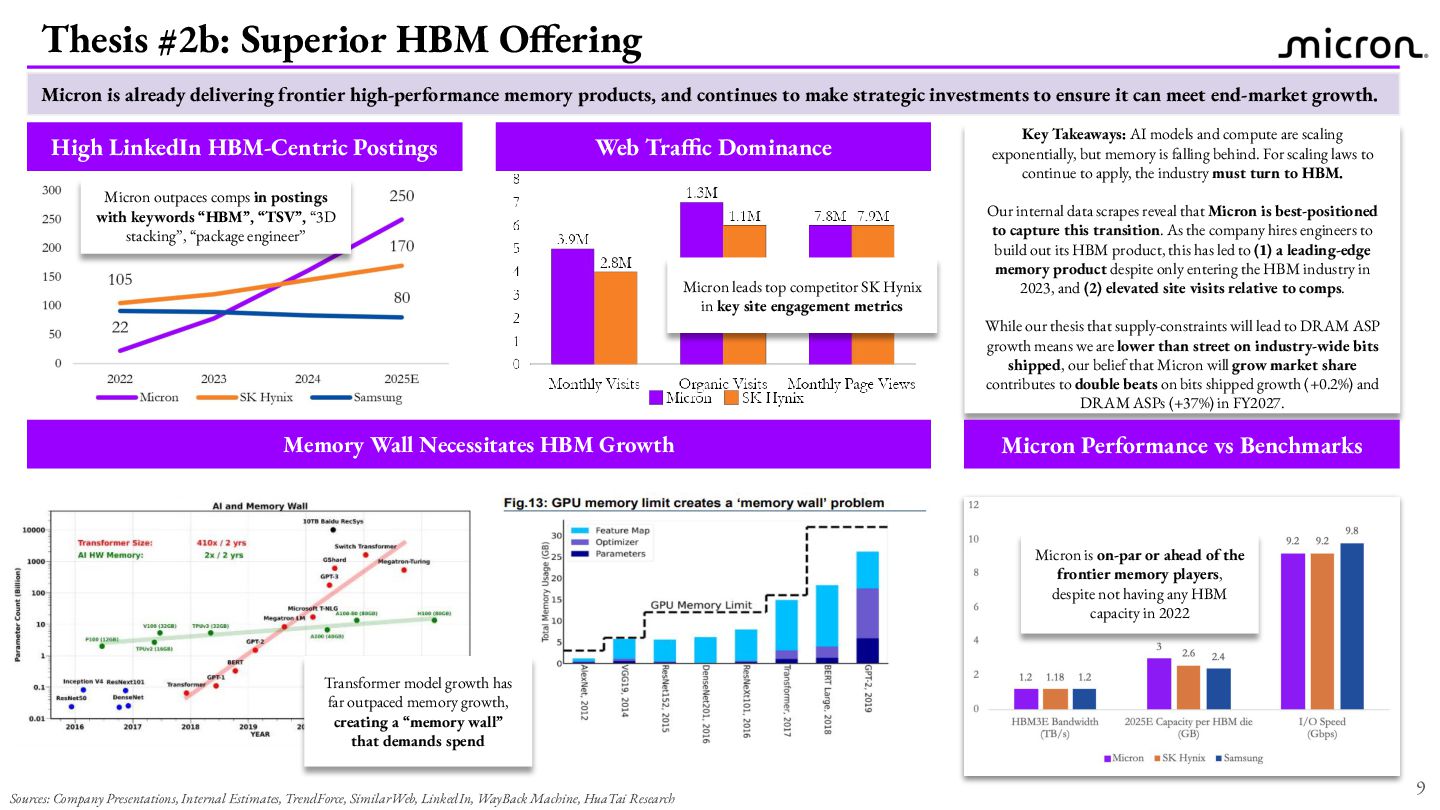
3 players in the DRAM space, and 1 of 5 players in the NAND space. Industry Overview Competitors Sources: Micron 10K, SemiAnalysis Advantage / Moat 3 • Micron has an edge as the first to mass produce a 232-layer QLC NAND. • Hynix is pushing innovations with its 321-layer TLC NAND is set for mass production in 2025. • Samsung, despite leading in market share (35%), has fallen behind in technology, with much of its production still on 128-layer NAND, though it has recently begun mass production of 290-layer NAND. Micron Market Share: 20% Costs: Scaling production capacity, yield improvement and bonding technology optimization, significant R&D investment Drivers: Surging AI and data center demand, competitive performance and power efficiency, strategic partnerships, especially with TSMC • Hynix leads the HBM market with 56% share due to its first-mover advantage, being the first company to release HBM chips in 2013, securing early supplier agreements with AMD, NVIDIA, and Intel. • Micron didn’t enter the HBM arena until 2022, but has quickly gained market share since. • For the recent generation of HBM3E chips, Micron beat Samsung and Hynix to market by 11 weeks, capturing 30% of NVDA 2024 HBM3E allocation. Micron Market Share: 24% Costs: High CapEx for fabs and EUV equipment, significant R&D investment for advanced nodes, yield optimization and bonding technology Drivers: AI and data center demand, technology leadership in advanced nodes, yield and cost efficiency • Micron has become a leader in the DRAM market through early adoption of the advanced 1-γ process, a strong focus on EUV integration, and leadership in high-performance, low-power memory technologies. • Micron is positioned to gain long-term competitive advantage. NAND DRAM DRAM (HBM) Micron Market Share: 11% Costs: R&D expenses, CapEx for fabs and technology/equipment, manufacturing costs (wafers, labor, etc.) Drivers: Advancements in NAND technology, market competition, yield improvements in manufacturing Market Dynamics


 fhaque
 hannesfritz
 gurzu
 chriscoyier
 csswizardry
 lcolladotor
 szymonslowik
 eileencodes
 akashhashmi
 brad_frost
 sferik
 aleyda
 kimpetersen