Upgrade to Pro — share decks privately, control downloads, hide ads and more …

Farallon CSGP Deck

Sponsored · Your Podcast. Everywhere. Effortlessly. Share. Educate. Inspire. Entertain. You do you. We'll handle the rest. →
Avatar for Tiger Investments Tiger Investments
April 13, 2025
1.4k

Farallon CSGP Deck

Avatar for Tiger Investments

Tiger Investments

April 13, 2025

Transcript

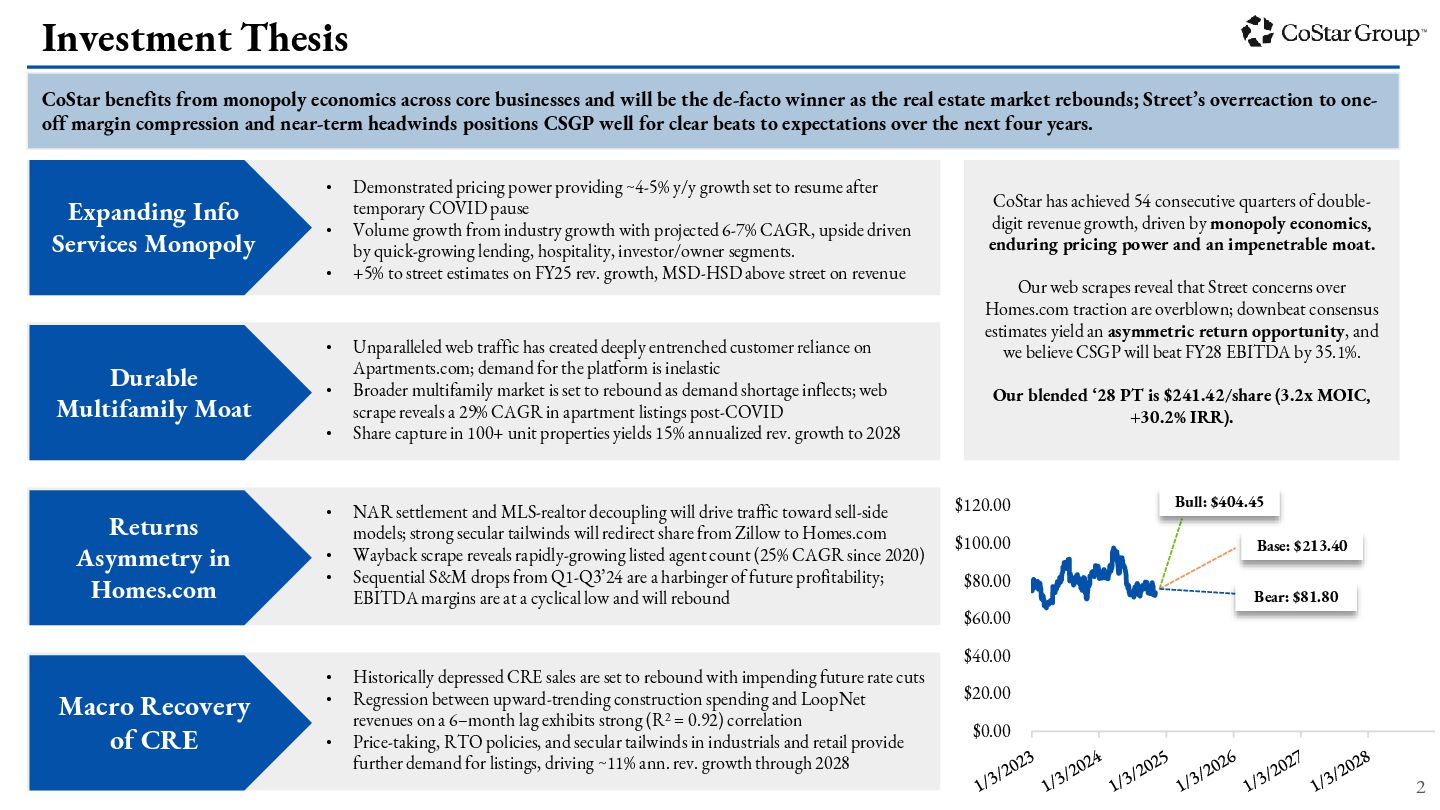
  1. CoStar benefits from monopoly economics across core businesses and will

    be the de-facto winner as the real estate market rebounds; Street’s overreaction to one- off margin compression and near-term headwinds positions CSGP well for clear beats to expectations over the next four years. Investment Thesis Expanding Info Services Monopoly • Demonstrated pricing power providing ~4-5% y/y growth set to resume after temporary COVID pause • Volume growth from industry growth with projected 6-7% CAGR, upside driven by quick-growing lending, hospitality, investor/owner segments. • +5% to street estimates on FY25 rev. growth, MSD-HSD above street on revenue Durable Multifamily Moat • Unparalleled web traffic has created deeply entrenched customer reliance on Apartments.com; demand for the platform is inelastic • Broader multifamily market is set to rebound as demand shortage inflects; web scrape reveals a 29% CAGR in apartment listings post-COVID • Share capture in 100+ unit properties yields 15% annualized rev. growth to 2028 Returns Asymmetry in Homes.com • NAR settlement and MLS-realtor decoupling will drive traffic toward sell-side models; strong secular tailwinds will redirect share from Zillow to Homes.com • Wayback scrape reveals rapidly-growing listed agent count (25% CAGR since 2020) • Sequential S&M drops from Q1-Q3’24 are a harbinger of future profitability; EBITDA margins are at a cyclical low and will rebound Macro Recovery of CRE • Historically depressed CRE sales are set to rebound with impending future rate cuts • Regression between upward-trending construction spending and LoopNet revenues on a 6–month lag exhibits strong (R2 = 0.92) correlation • Price-taking, RTO policies, and secular tailwinds in industrials and retail provide further demand for listings, driving ~11% ann. rev. growth through 2028 CoStar has achieved 54 consecutive quarters of double- digit revenue growth, driven by monopoly economics, enduring pricing power and an impenetrable moat. Our web scrapes reveal that Street concerns over Homes.com traction are overblown; downbeat consensus estimates yield an asymmetric return opportunity, and we believe CSGP will beat FY28 EBITDA by 35.1%. Our blended ‘28 PT is $241.42/share (3.2x MOIC, +30.2% IRR). $0.00 $20.00 $40.00 $60.00 $80.00 $100.00 $120.00 Bull: $404.45 Base: $213.40 Bear: $81.80 2
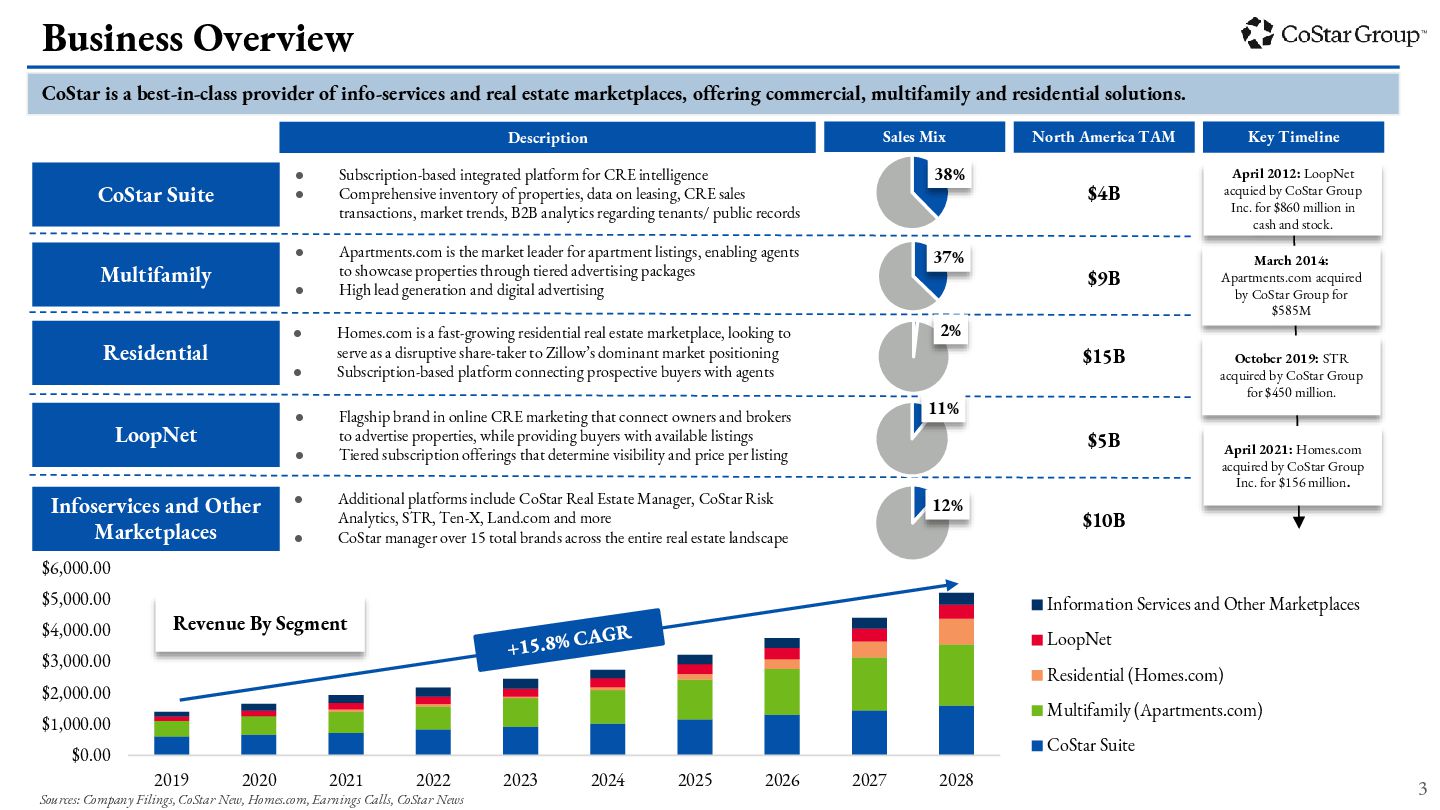
  2. $0.00 $1,000.00 $2,000.00 $3,000.00 $4,000.00 $5,000.00 $6,000.00 2019 2020 2021

    2022 2023 2024 2025 2026 2027 2028 Information Services and Other Marketplaces LoopNet Residential (Homes.com) Multifamily (Apartments.com) CoStar Suite CoStar is a best-in-class provider of info-services and real estate marketplaces, offering commercial, multifamily and residential solutions. Business Overview CoStar Suite Description Sales Mix Multifamily • Subscription-based integrated platform for CRE intelligence • Comprehensive inventory of properties, data on leasing, CRE sales transactions, market trends, B2B analytics regarding tenants/ public records • Apartments.com is the market leader for apartment listings, enabling agents to showcase properties through tiered advertising packages • High lead generation and digital advertising • Homes.com is a fast-growing residential real estate marketplace, looking to serve as a disruptive share-taker to Zillow’s dominant market positioning • Subscription-based platform connecting prospective buyers with agents Infoservices and Other Marketplaces • Additional platforms include CoStar Real Estate Manager, CoStar Risk Analytics, STR, Ten-X, Land.com and more • CoStar manager over 15 total brands across the entire real estate landscape Residential North America TAM $4B $9B $15B Key Timeline March 2014: Apartments.com acquired by CoStar Group for $585M October 2019: STR acquired by CoStar Group for $450 million. April 2021: Homes.com acquired by CoStar Group Inc. for $156 million. April 2012: LoopNet acquied by CoStar Group Inc. for $860 million in cash and stock. 38% 37% 2% 12% $10B Sources: Company Filings, CoStar New, Homes.com, Earnings Calls, CoStar News Revenue By Segment 3 • Flagship brand in online CRE marketing that connect owners and brokers to advertise properties, while providing buyers with available listings • Tiered subscription offerings that determine visibility and price per listing LoopNet $5B 11%
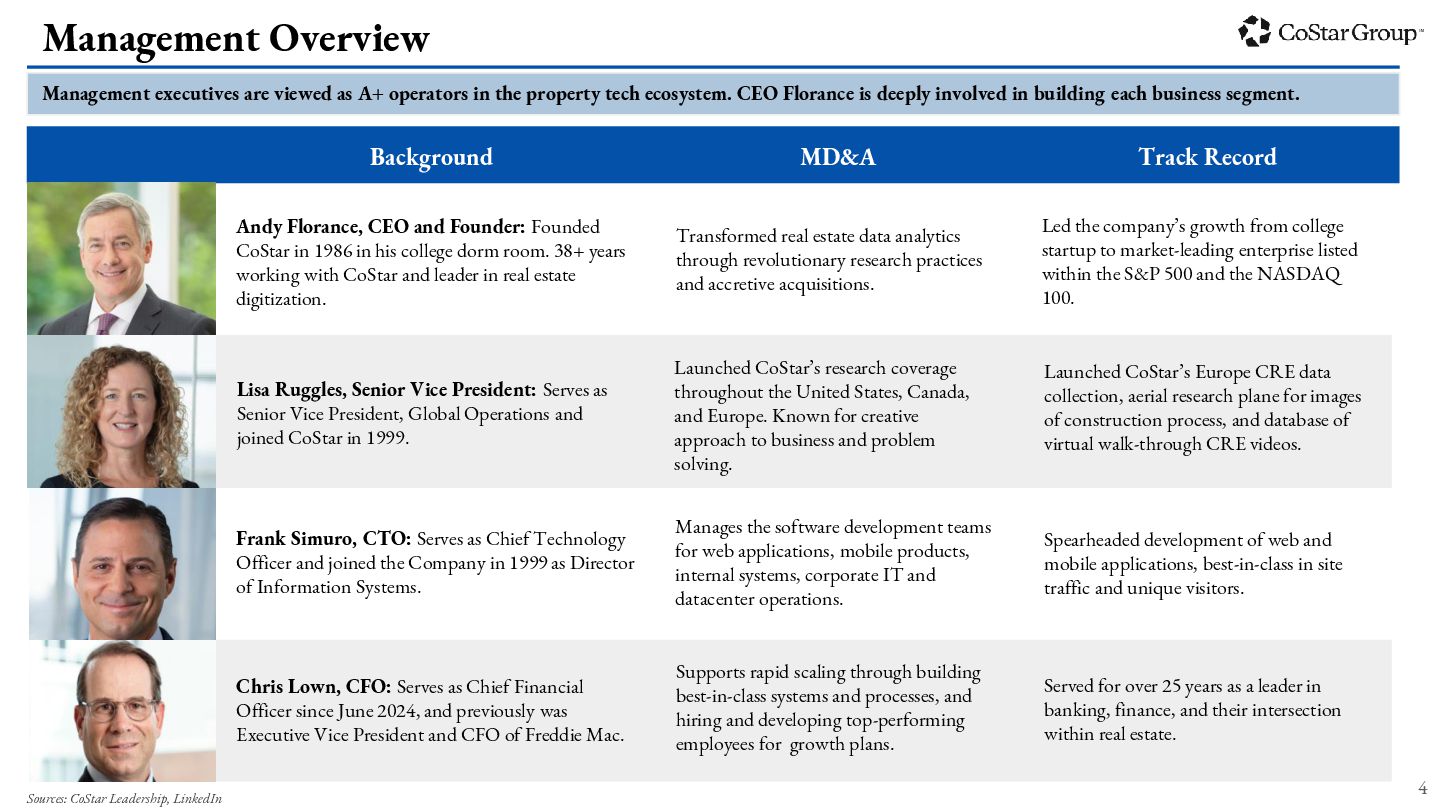
  3. Management executives are viewed as A+ operators in the property

    tech ecosystem. CEO Florance is deeply involved in building each business segment. Management Overview Background Andy Florance, CEO and Founder: Founded CoStar in 1986 in his college dorm room. 38+ years working with CoStar and leader in real estate digitization. MD&A Transformed real estate data analytics through revolutionary research practices and accretive acquisitions. Track Record Led the company’s growth from college startup to market-leading enterprise listed within the S&P 500 and the NASDAQ 100. Lisa Ruggles, Senior Vice President: Serves as Senior Vice President, Global Operations and joined CoStar in 1999. Launched CoStar’s research coverage throughout the United States, Canada, and Europe. Known for creative approach to business and problem solving. Launched CoStar’s Europe CRE data collection, aerial research plane for images of construction process, and database of virtual walk-through CRE videos. Frank Simuro, CTO: Serves as Chief Technology Officer and joined the Company in 1999 as Director of Information Systems. Manages the software development teams for web applications, mobile products, internal systems, corporate IT and datacenter operations. Spearheaded development of web and mobile applications, best-in-class in site traffic and unique visitors. Chris Lown, CFO: Serves as Chief Financial Officer since June 2024, and previously was Executive Vice President and CFO of Freddie Mac. Supports rapid scaling through building best-in-class systems and processes, and hiring and developing top-performing employees for growth plans. Served for over 25 years as a leader in banking, finance, and their intersection within real estate. Sources: CoStar Leadership, LinkedIn 4
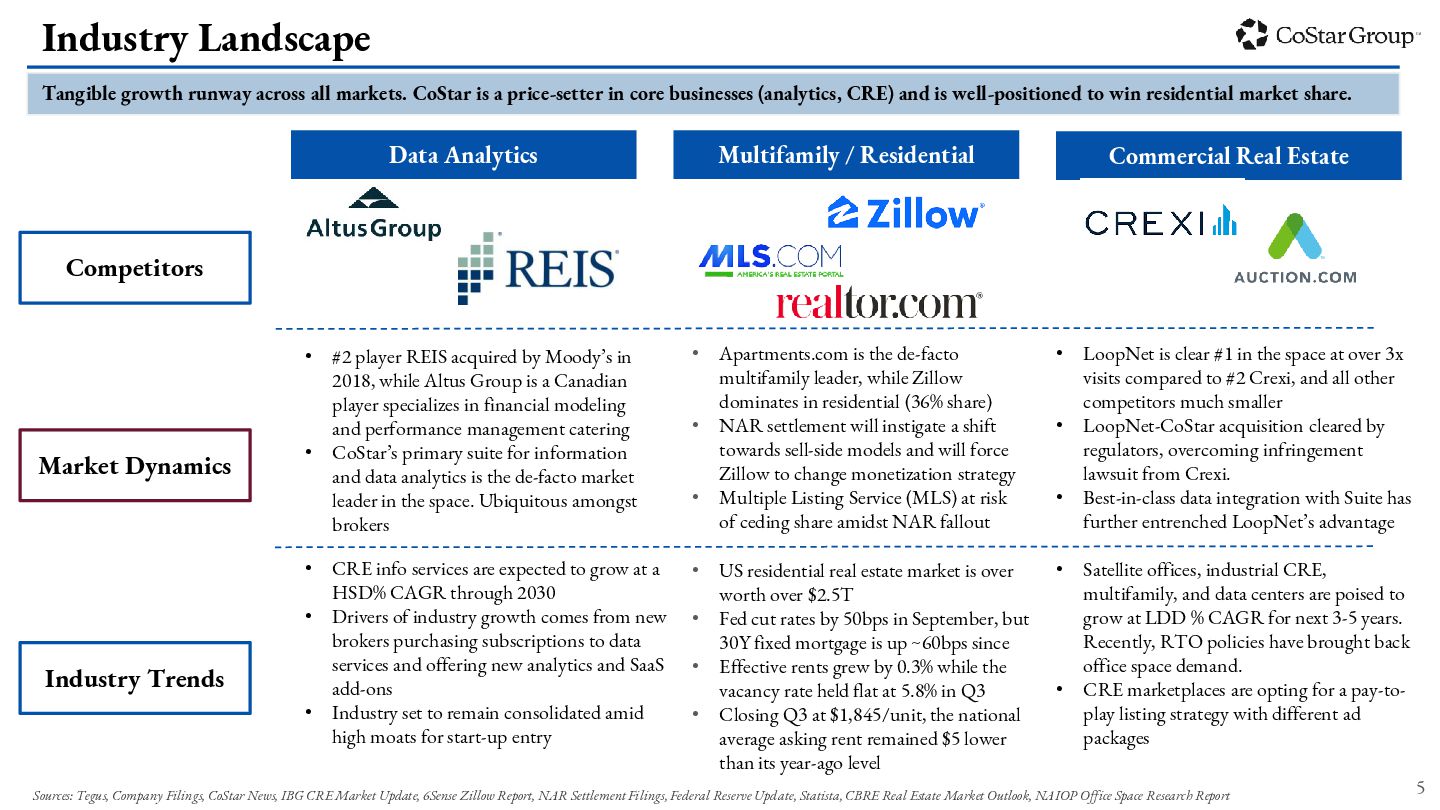
  4. Tangible growth runway across all markets. CoStar is a price-setter

    in core businesses (analytics, CRE) and is well-positioned to win residential market share. Industry Landscape Commercial Real Estate • LoopNet is clear #1 in the space at over 3x visits compared to #2 Crexi, and all other competitors much smaller • LoopNet-CoStar acquisition cleared by regulators, overcoming infringement lawsuit from Crexi. • Best-in-class data integration with Suite has further entrenched LoopNet’s advantage Data Analytics Competitors Market Dynamics Industry Trends • Satellite offices, industrial CRE, multifamily, and data centers are poised to grow at LDD % CAGR for next 3-5 years. Recently, RTO policies have brought back office space demand. • CRE marketplaces are opting for a pay-to- play listing strategy with different ad packages • #2 player REIS acquired by Moody’s in 2018, while Altus Group is a Canadian player specializes in financial modeling and performance management catering • CoStar’s primary suite for information and data analytics is the de-facto market leader in the space. Ubiquitous amongst brokers • CRE info services are expected to grow at a HSD% CAGR through 2030 • Drivers of industry growth comes from new brokers purchasing subscriptions to data services and offering new analytics and SaaS add-ons • Industry set to remain consolidated amid high moats for start-up entry Multifamily / Residential • Apartments.com is the de-facto multifamily leader, while Zillow dominates in residential (36% share) • NAR settlement will instigate a shift towards sell-side models and will force Zillow to change monetization strategy • Multiple Listing Service (MLS) at risk of ceding share amidst NAR fallout • US residential real estate market is over worth over $2.5T • Fed cut rates by 50bps in September, but 30Y fixed mortgage is up ~60bps since • Effective rents grew by 0.3% while the vacancy rate held flat at 5.8% in Q3 • Closing Q3 at $1,845/unit, the national average asking rent remained $5 lower than its year-ago level Sources: Tegus, Company Filings, CoStar News, IBG CRE Market Update, 6Sense Zillow Report, NAR Settlement Filings, Federal Reserve Update, Statista, CBRE Real Estate Market Outlook, NAIOP Office Space Research Report 5
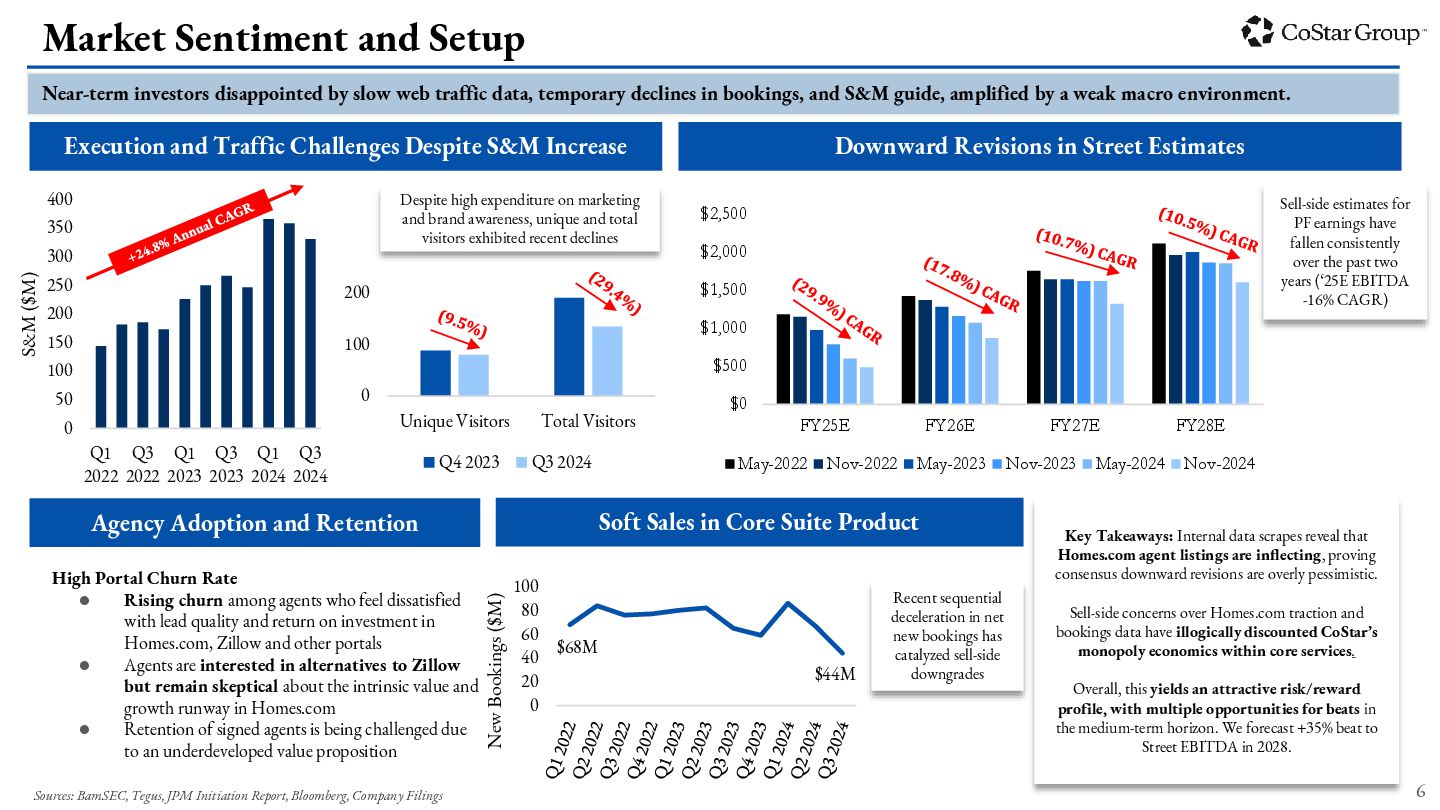
  5. 0 50 100 150 200 250 300 350 400 Q1

    2022 Q3 2022 Q1 2023 Q3 2023 Q1 2024 Q3 2024 S&M ($M) Near-term investors disappointed by slow web traffic data, temporary declines in bookings, and S&M guide, amplified by a weak macro environment. Market Sentiment and Setup Execution and Traffic Challenges Despite S&M Increase 0 100 200 Unique Visitors Total Visitors Q4 2023 Q3 2024 Despite high expenditure on marketing and brand awareness, unique and total visitors exhibited recent declines Downward Revisions in Street Estimates $0 $500 $1,000 $1,500 $2,000 $2,500 FY25E FY26E FY27E FY28E May-2022 Nov-2022 May-2023 Nov-2023 May-2024 Nov-2024 Sell-side estimates for PF earnings have fallen consistently over the past two years (‘25E EBITDA -16% CAGR) Agency Adoption and Retention High Portal Churn Rate • Rising churn among agents who feel dissatisfied with lead quality and return on investment in Homes.com, Zillow and other portals • Agents are interested in alternatives to Zillow but remain skeptical about the intrinsic value and growth runway in Homes.com • Retention of signed agents is being challenged due to an underdeveloped value proposition Soft Sales in Core Suite Product $68M $44M 0 20 40 60 80 100 New Bookings ($M) Recent sequential deceleration in net new bookings has catalyzed sell-side downgrades Key Takeaways: Internal data scrapes reveal that Homes.com agent listings are inflecting, proving consensus downward revisions are overly pessimistic. Sell-side concerns over Homes.com traction and bookings data have illogically discounted CoStar’s monopoly economics within core services. Overall, this yields an attractive risk/reward profile, with multiple opportunities for beats in the medium-term horizon. We forecast +35% beat to Street EBITDA in 2028. Sources: BamSEC, Tegus, JPM Initiation Report, Bloomberg, Company Filings 6
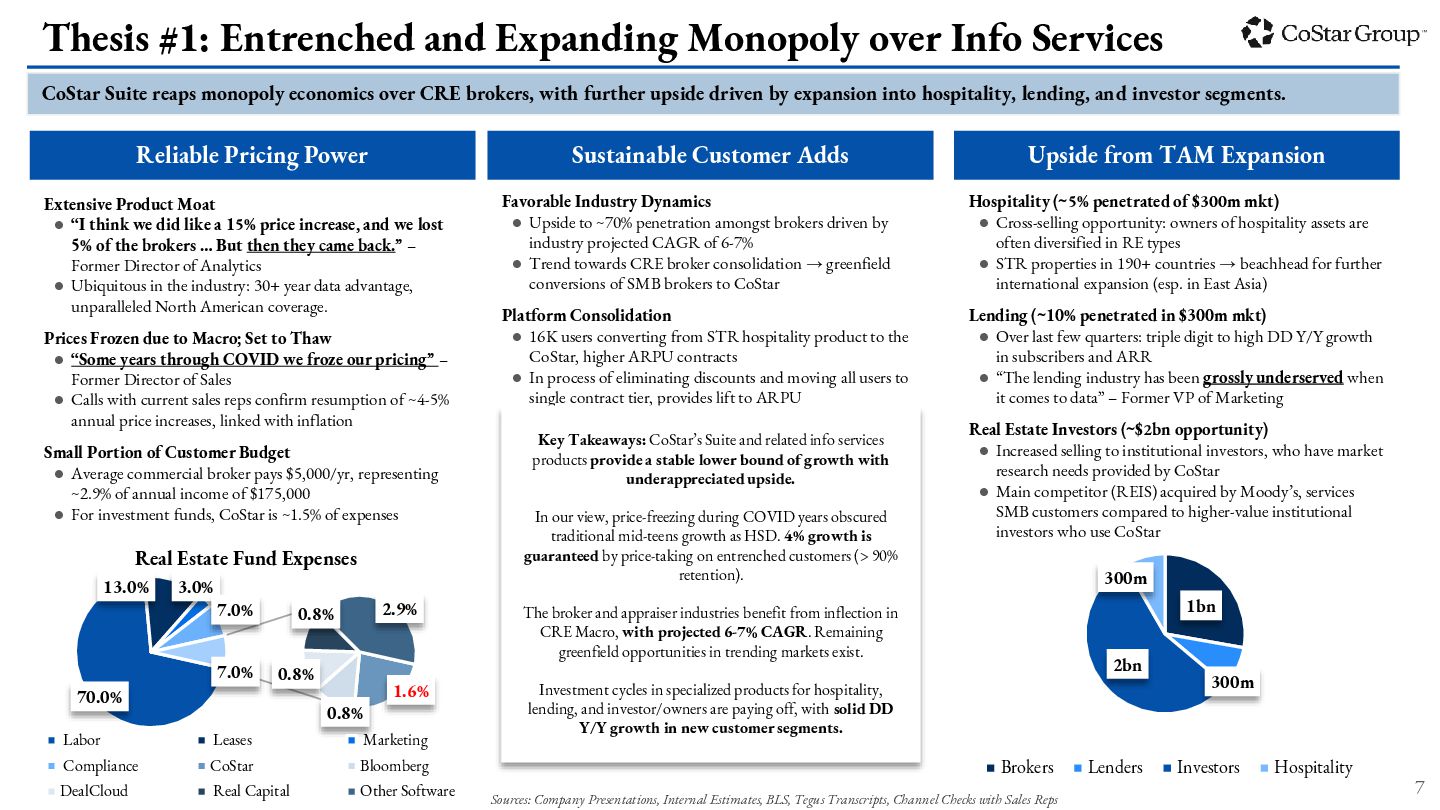
  6. CoStar Suite reaps monopoly economics over CRE brokers, with further

    upside driven by expansion into hospitality, lending, and investor segments. Thesis #1: Entrenched and Expanding Monopoly over Info Services Reliable Pricing Power Extensive Product Moat • “I think we did like a 15% price increase, and we lost 5% of the brokers … But then they came back.” – Former Director of Analytics • Ubiquitous in the industry: 30+ year data advantage, unparalleled North American coverage. Prices Frozen due to Macro; Set to Thaw • “Some years through COVID we froze our pricing” – Former Director of Sales • Calls with current sales reps confirm resumption of ~4-5% annual price increases, linked with inflation Small Portion of Customer Budget • Average commercial broker pays $5,000/yr, representing ~2.9% of annual income of $175,000 • For investment funds, CoStar is ~1.5% of expenses Sustainable Customer Adds Hospitality (~5% penetrated of $300m mkt) • Cross-selling opportunity: owners of hospitality assets are often diversified in RE types • STR properties in 190+ countries → beachhead for further international expansion (esp. in East Asia) Lending (~10% penetrated in $300m mkt) • Over last few quarters: triple digit to high DD Y/Y growth in subscribers and ARR • “The lending industry has been grossly underserved when it comes to data” – Former VP of Marketing Real Estate Investors (~$2bn opportunity) • Increased selling to institutional investors, who have market research needs provided by CoStar • Main competitor (REIS) acquired by Moody’s, services SMB customers compared to higher-value institutional investors who use CoStar Favorable Industry Dynamics • Upside to ~70% penetration amongst brokers driven by industry projected CAGR of 6-7% • Trend towards CRE broker consolidation → greenfield conversions of SMB brokers to CoStar Platform Consolidation • 16K users converting from STR hospitality product to the CoStar, higher ARPU contracts • In process of eliminating discounts and moving all users to single contract tier, provides lift to ARPU Sources: Company Presentations, Internal Estimates, BLS, Tegus Transcripts, Channel Checks with Sales Reps Key Takeaways: CoStar’s Suite and related info services products provide a stable lower bound of growth with underappreciated upside. In our view, price-freezing during COVID years obscured traditional mid-teens growth as HSD. 4% growth is guaranteed by price-taking on entrenched customers (> 90% retention). The broker and appraiser industries benefit from inflection in CRE Macro, with projected 6-7% CAGR. Remaining greenfield opportunities in trending markets exist. Investment cycles in specialized products for hospitality, lending, and investor/owners are paying off, with solid DD Y/Y growth in new customer segments. 1bn 300m 2bn 300m Brokers Lenders Investors Hospitality Upside from TAM Expansion 70.0% 13.0% 3.0% 7.0% 1.6% 0.8% 0.8% 0.8% 2.9% 7.0% Real Estate Fund Expenses Labor Leases Marketing Compliance CoStar Bloomberg DealCloud Real Capital Other Software 7
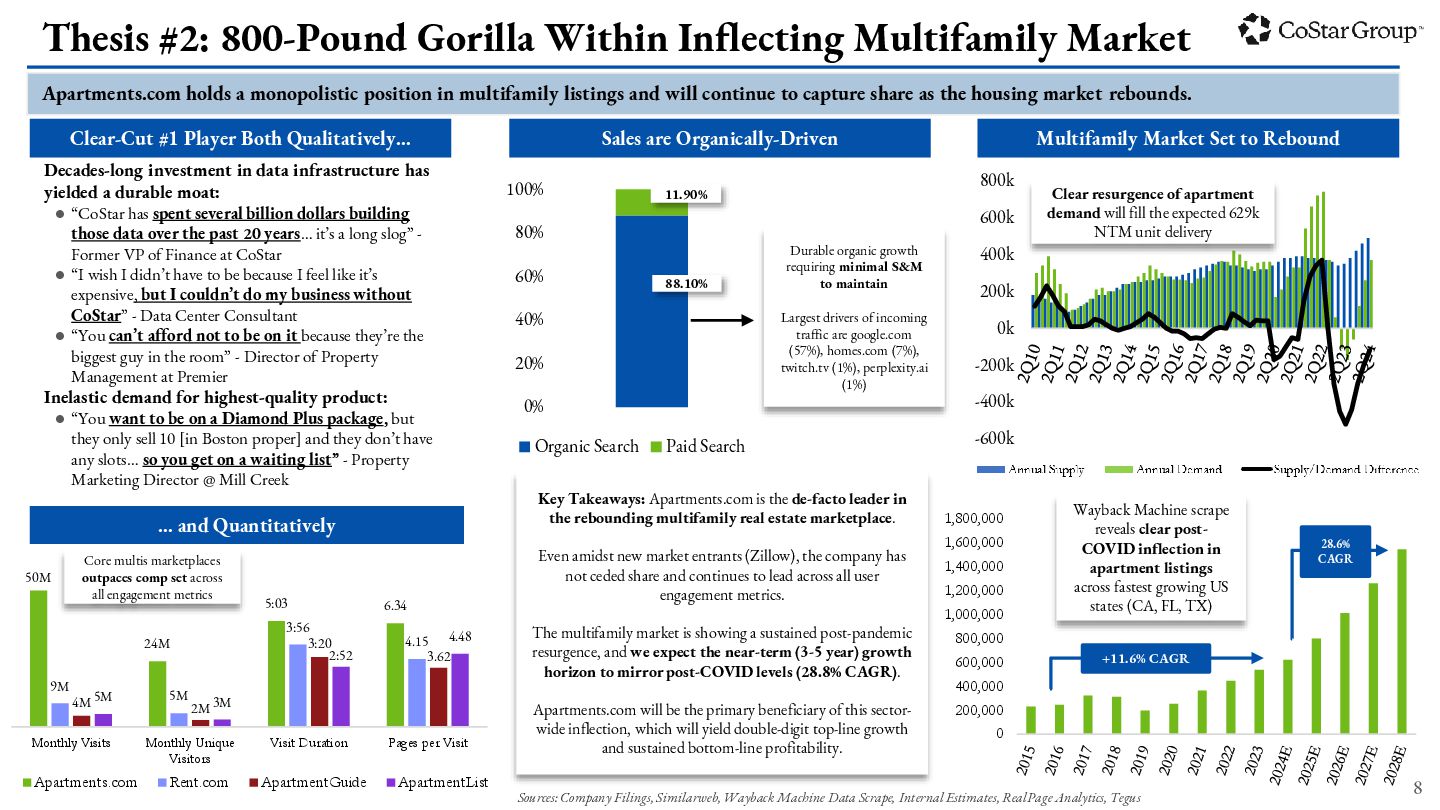
  7. 88.10% 11.90% 0% 20% 40% 60% 80% 100% Organic Search

    Paid Search 0 200,000 400,000 600,000 800,000 1,000,000 1,200,000 1,400,000 1,600,000 1,800,000 -600k -400k -200k 0k 200k 400k 600k 800k Decades-long investment in data infrastructure has yielded a durable moat: • “CoStar has spent several billion dollars building those data over the past 20 years… it’s a long slog” - Former VP of Finance at CoStar • “I wish I didn’t have to be because I feel like it’s expensive, but I couldn’t do my business without CoStar” - Data Center Consultant • “You can’t afford not to be on it because they’re the biggest guy in the room” - Director of Property Management at Premier Inelastic demand for highest-quality product: • “You want to be on a Diamond Plus package, but they only sell 10 [in Boston proper] and they don’t have any slots… so you get on a waiting list” - Property Marketing Director @ Mill Creek Apartments.com holds a monopolistic position in multifamily listings and will continue to capture share as the housing market rebounds. Thesis #2: 800-Pound Gorilla Within Inflecting Multifamily Market Clear-Cut #1 Player Both Qualitatively… Clear resurgence of apartment demand will fill the expected 629k NTM unit delivery Core multis marketplaces outpaces comp set across all engagement metrics Wayback Machine scrape reveals clear post- COVID inflection in apartment listings across fastest growing US states (CA, FL, TX) Key Takeaways: Apartments.com is the de-facto leader in the rebounding multifamily real estate marketplace. Even amidst new market entrants (Zillow), the company has not ceded share and continues to lead across all user engagement metrics. The multifamily market is showing a sustained post-pandemic resurgence, and we expect the near-term (3-5 year) growth horizon to mirror post-COVID levels (28.8% CAGR). Apartments.com will be the primary beneficiary of this sector- wide inflection, which will yield double-digit top-line growth and sustained bottom-line profitability. Sales are Organically-Driven Multifamily Market Set to Rebound … and Quantitatively Durable organic growth requiring minimal S&M to maintain Largest drivers of incoming traffic are google.com (57%), homes.com (7%), twitch.tv (1%), perplexity.ai (1%) 50M 24M 5:03 6.34 9M 5M 3:56 4.15 4M 2M 3:20 3.62 5M 3M 2:52 4.48 Monthly Visits Monthly Unique Visitors Visit Duration Pages per Visit Apartments.com Rent.com ApartmentGuide ApartmentList +11.6% CAGR 28.6% CAGR Sources: Company Filings, Similarweb, Wayback Machine Data Scrape, Internal Estimates, RealPage Analytics, Tegus 8
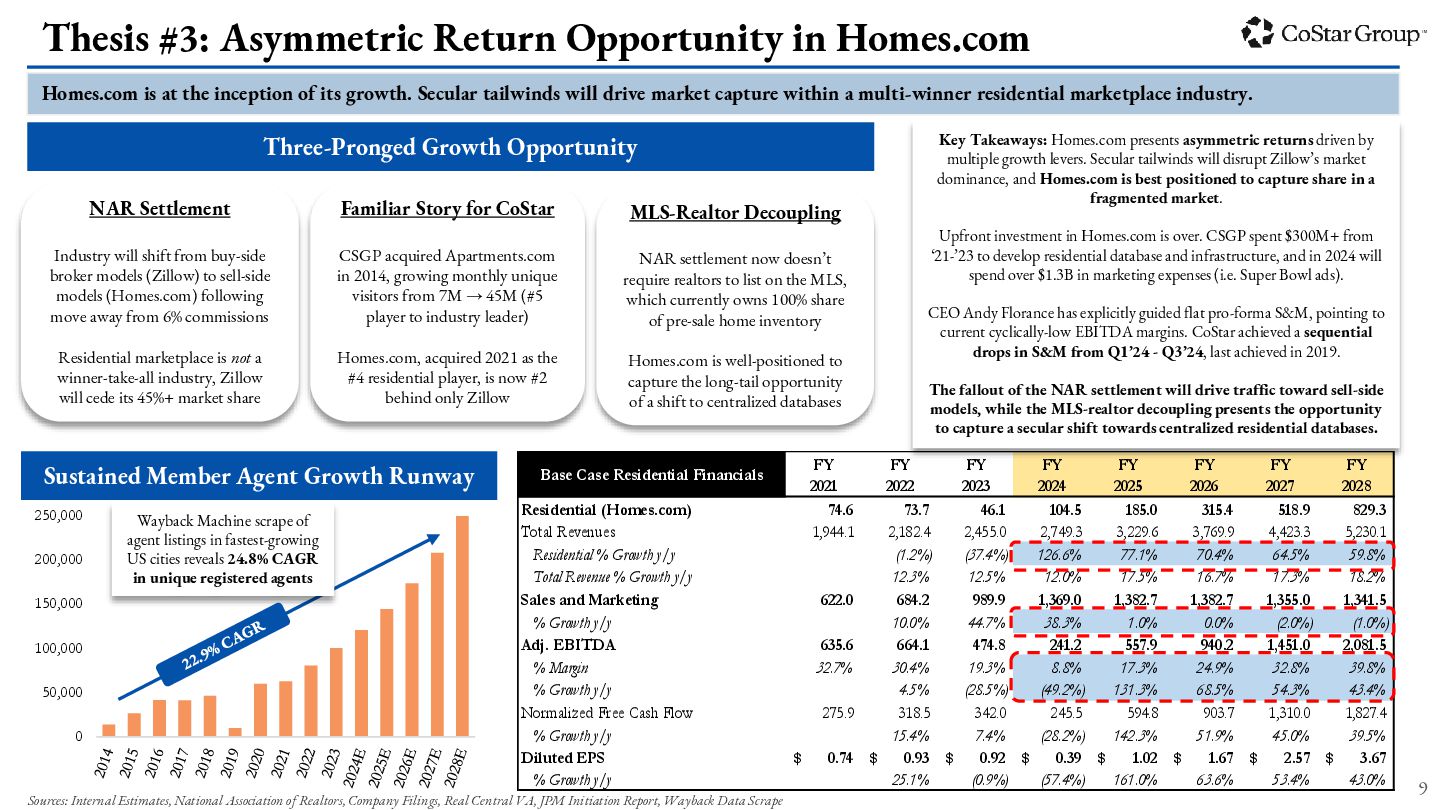
  8. FY FY FY FY FY FY FY FY 2021 2022

    2023 2024 2025 2026 2027 2028 Residential (Homes.com) 74.6 73.7 46.1 104.5 185.0 315.4 518.9 829.3 Total Revenues 1,944.1 2,182.4 2,455.0 2,749.3 3,229.6 3,769.9 4,423.3 5,230.1 Residential % Growth y/y (1.2%) (37.4%) 126.6% 77.1% 70.4% 64.5% 59.8% Total Revenue % Growth y/y 12.3% 12.5% 12.0% 17.5% 16.7% 17.3% 18.2% Sales and Marketing 622.0 684.2 989.9 1,369.0 1,382.7 1,382.7 1,355.0 1,341.5 % Growth y/y 10.0% 44.7% 38.3% 1.0% 0.0% (2.0%) (1.0%) Adj. EBITDA 635.6 664.1 474.8 241.2 557.9 940.2 1,451.0 2,081.5 % Margin 32.7% 30.4% 19.3% 8.8% 17.3% 24.9% 32.8% 39.8% % Growth y/y 4.5% (28.5%) (49.2%) 131.3% 68.5% 54.3% 43.4% Normalized Free Cash Flow 275.9 318.5 342.0 245.5 594.8 903.7 1,310.0 1,827.4 % Growth y/y 15.4% 7.4% (28.2%) 142.3% 51.9% 45.0% 39.5% Diluted EPS 0.74 $ 0.93 $ 0.92 $ 0.39 $ 1.02 $ 1.67 $ 2.57 $ 3.67 $ % Growth y/y 25.1% (0.9%) (57.4%) 161.0% 63.6% 53.4% 43.0% Base Case Residential Financials 0 50,000 100,000 150,000 200,000 250,000 Homes.com is at the inception of its growth. Secular tailwinds will drive market capture within a multi-winner residential marketplace industry. Thesis #3: Asymmetric Return Opportunity in Homes.com Three-Pronged Growth Opportunity NAR Settlement Industry will shift from buy-side broker models (Zillow) to sell-side models (Homes.com) following move away from 6% commissions Residential marketplace is not a winner-take-all industry, Zillow will cede its 45%+ market share Familiar Story for CoStar CSGP acquired Apartments.com in 2014, growing monthly unique visitors from 7M → 45M (#5 player to industry leader) Homes.com, acquired 2021 as the #4 residential player, is now #2 behind only Zillow MLS-Realtor Decoupling NAR settlement now doesn’t require realtors to list on the MLS, which currently owns 100% share of pre-sale home inventory Homes.com is well-positioned to capture the long-tail opportunity of a shift to centralized databases Sustained Member Agent Growth Runway Key Takeaways: Homes.com presents asymmetric returns driven by multiple growth levers. Secular tailwinds will disrupt Zillow’s market dominance, and Homes.com is best positioned to capture share in a fragmented market. Upfront investment in Homes.com is over. CSGP spent $300M+ from ‘21-’23 to develop residential database and infrastructure, and in 2024 will spend over $1.3B in marketing expenses (i.e. Super Bowl ads). CEO Andy Florance has explicitly guided flat pro-forma S&M, pointing to current cyclically-low EBITDA margins. CoStar achieved a sequential drops in S&M from Q1’24 - Q3’24, last achieved in 2019. The fallout of the NAR settlement will drive traffic toward sell-side models, while the MLS-realtor decoupling presents the opportunity to capture a secular shift towards centralized residential databases. Wayback Machine scrape of agent listings in fastest-growing US cities reveals 24.8% CAGR in unique registered agents Sources: Internal Estimates, National Association of Realtors, Company Filings, Real Central VA, JPM Initiation Report, Wayback Data Scrape 9
  9. • “We've got 900 people in Dallas this week with

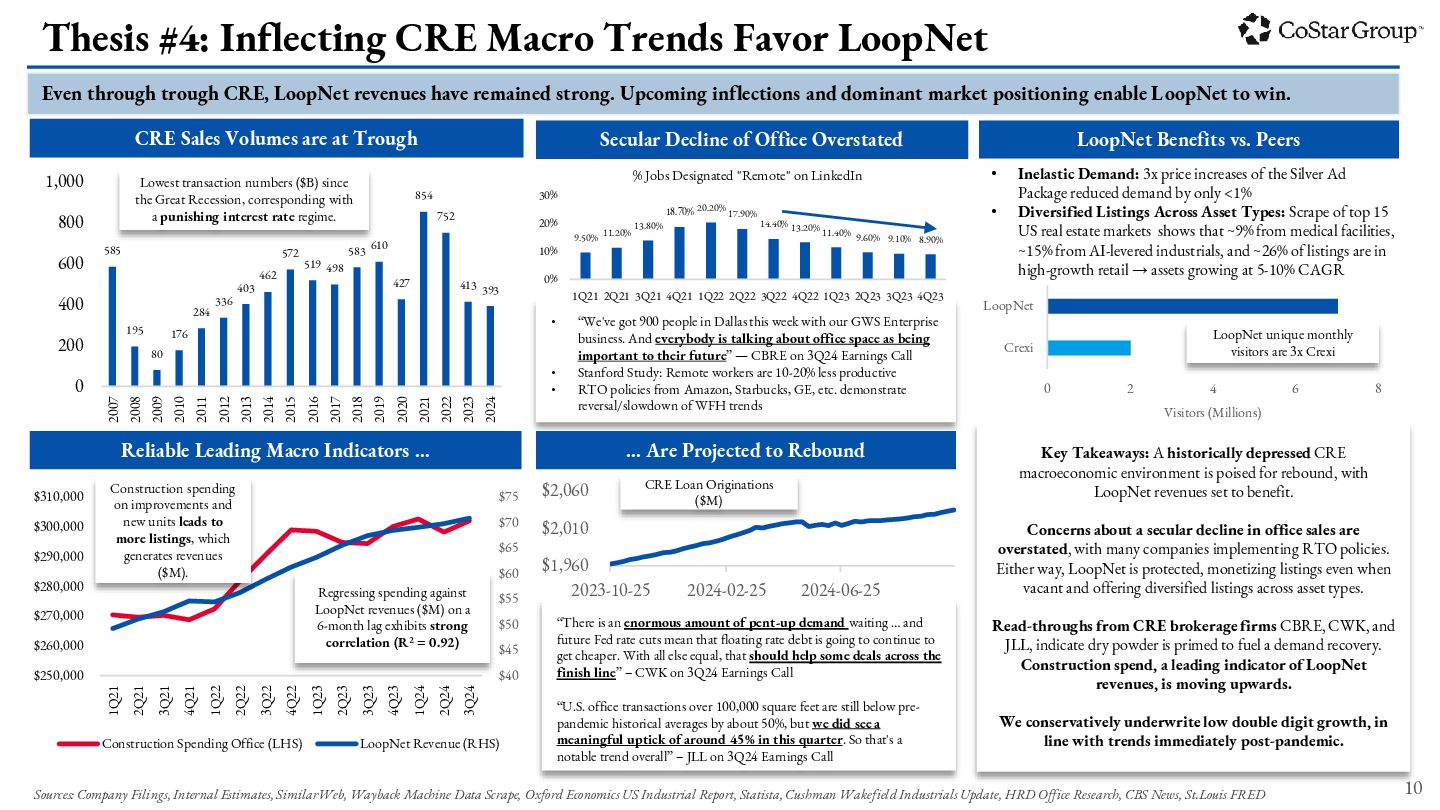
    our GWS Enterprise business. And everybody is talking about office space as being important to their future” — CBRE on 3Q24 Earnings Call • Stanford Study: Remote workers are 10-20% less productive • RTO policies from Amazon, Starbucks, GE, etc. demonstrate reversal/slowdown of WFH trends Even through trough CRE, LoopNet revenues have remained strong. Upcoming inflections and dominant market positioning enable LoopNet to win. Thesis #4: Inflecting CRE Macro Trends Favor LoopNet CRE Sales Volumes are at Trough Secular Decline of Office Overstated Reliable Leading Macro Indicators … Sources: Company Filings, Internal Estimates, SimilarWeb, Wayback Machine Data Scrape, Oxford Economics US Industrial Report, Statista, Cushman Wakefield Industrials Update, HRD Office Research, CBS News, St.Louis FRED 10 585 195 80 176 284 336 403 462 572 519 498 583 610 427 854 752 413 393 0 200 400 600 800 1,000 2007 2008 2009 2010 2011 2012 2013 2014 2015 2016 2017 2018 2019 2020 2021 2022 2023 2024 Lowest transaction numbers ($B) since the Great Recession, corresponding with a punishing interest rate regime. $40 $45 $50 $55 $60 $65 $70 $75 $250,000 $260,000 $270,000 $280,000 $290,000 $300,000 $310,000 1Q21 2Q21 3Q21 4Q21 1Q22 2Q22 3Q22 4Q22 1Q23 2Q23 3Q23 4Q23 1Q24 2Q24 3Q24 Construction Spending Office (LHS) LoopNet Revenue (RHS) Regressing spending against LoopNet revenues ($M) on a 6-month lag exhibits strong correlation (R2 = 0.92) … Are Projected to Rebound Construction spending on improvements and new units leads to more listings, which generates revenues ($M). 9.50% 11.20% 13.80% 18.70% 20.20% 17.90% 14.40% 13.20% 11.40% 9.60% 9.10% 8.90% 0% 10% 20% 30% 1Q21 2Q21 3Q21 4Q21 1Q22 2Q22 3Q22 4Q22 1Q23 2Q23 3Q23 4Q23 % Jobs Designated "Remote" on LinkedIn LoopNet Benefits vs. Peers • Inelastic Demand: 3x price increases of the Silver Ad Package reduced demand by only <1% • Diversified Listings Across Asset Types: Scrape of top 15 US real estate markets shows that ~9% from medical facilities, ~15% from AI-levered industrials, and ~26% of listings are in high-growth retail → assets growing at 5-10% CAGR “There is an enormous amount of pent-up demand waiting … and future Fed rate cuts mean that floating rate debt is going to continue to get cheaper. With all else equal, that should help some deals across the finish line” – CWK on 3Q24 Earnings Call “U.S. office transactions over 100,000 square feet are still below pre- pandemic historical averages by about 50%, but we did see a meaningful uptick of around 45% in this quarter. So that's a notable trend overall” – JLL on 3Q24 Earnings Call 0 2 4 6 8 Crexi LoopNet Visitors (Millions) LoopNet unique monthly visitors are 3x Crexi Key Takeaways: A historically depressed CRE macroeconomic environment is poised for rebound, with LoopNet revenues set to benefit. Concerns about a secular decline in office sales are overstated, with many companies implementing RTO policies. Either way, LoopNet is protected, monetizing listings even when vacant and offering diversified listings across asset types. Read-throughs from CRE brokerage firms CBRE, CWK, and JLL, indicate dry powder is primed to fuel a demand recovery. Construction spend, a leading indicator of LoopNet revenues, is moving upwards. We conservatively underwrite low double digit growth, in line with trends immediately post-pandemic. $1,960 $2,010 $2,060 2023-10-25 2024-02-25 2024-06-25 CRE Loan Originations ($M)
  10. Capitalization Summary Financials (BASE CASE) (Figures in millions USD) 11/1/2024

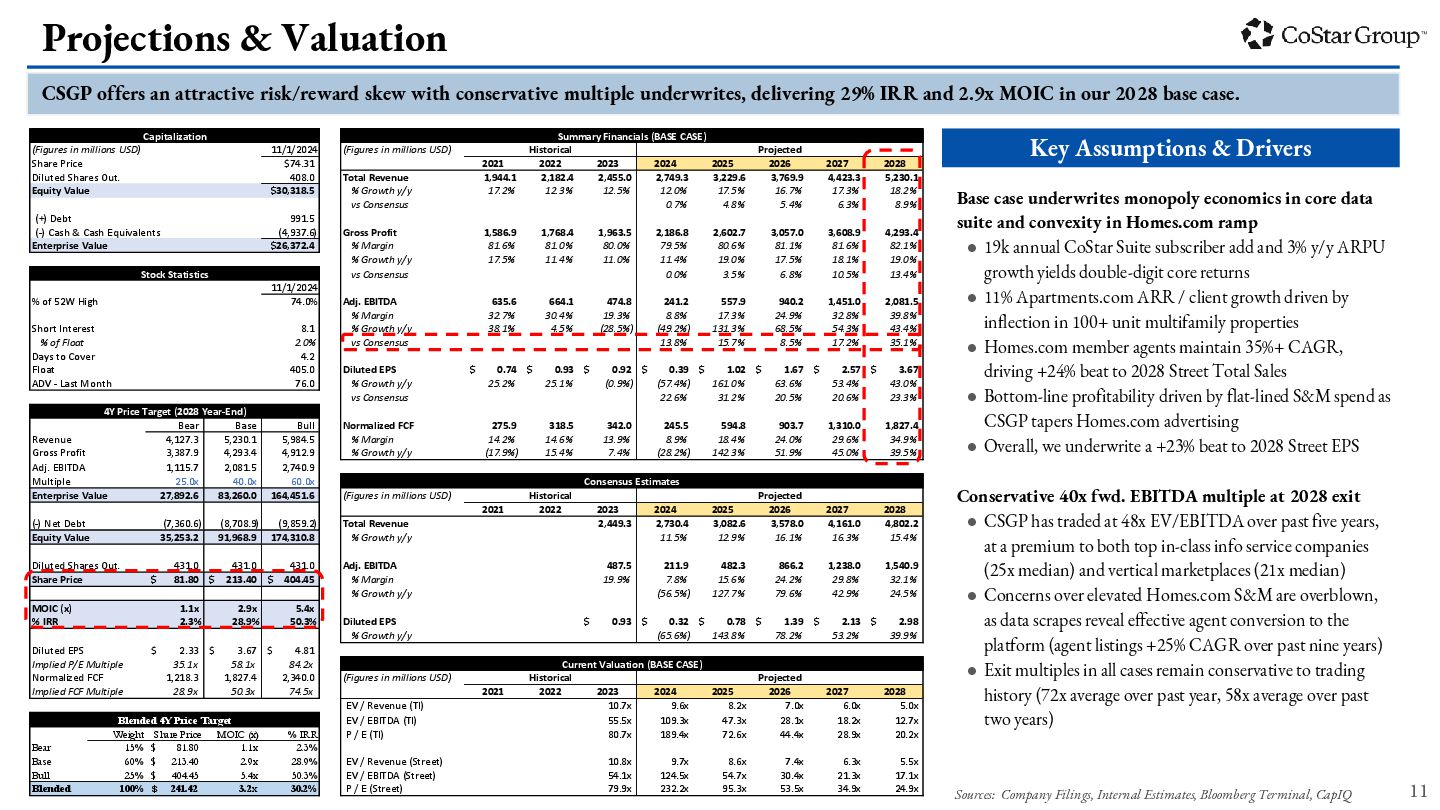
    (Figures in millions USD) Historical Projected Share Price $74.31 2021 2022 2023 2024 2025 2026 2027 2028 Diluted Shares Out. 408.0 Total Revenue 1,944.1 2,182.4 2,455.0 2,749.3 3,229.6 3,769.9 4,423.3 5,230.1 Equity Value $30,318.5 % Growth y/y 17.2% 12.3% 12.5% 12.0% 17.5% 16.7% 17.3% 18.2% vs Consensus 0.7% 4.8% 5.4% 6.3% 8.9% (+) Debt 991.5 (-) Cash & Cash Equivalents (4,937.6) Gross Profit 1,586.9 1,768.4 1,963.5 2,186.8 2,602.7 3,057.0 3,608.9 4,293.4 Enterprise Value $26,372.4 % Margin 81.6% 81.0% 80.0% 79.5% 80.6% 81.1% 81.6% 82.1% % Growth y/y 17.5% 11.4% 11.0% 11.4% 19.0% 17.5% 18.1% 19.0% Stock Statistics vs Consensus 0.0% 3.5% 6.8% 10.5% 13.4% 11/1/2024 % of 52W High 74.0% Adj. EBITDA 635.6 664.1 474.8 241.2 557.9 940.2 1,451.0 2,081.5 % Margin 32.7% 30.4% 19.3% 8.8% 17.3% 24.9% 32.8% 39.8% Short Interest 8.1 % Growth y/y 38.1% 4.5% (28.5%) (49.2%) 131.3% 68.5% 54.3% 43.4% % of Float 2.0% vs Consensus 13.8% 15.7% 8.5% 17.2% 35.1% Days to Cover 4.2 Float 405.0 Diluted EPS 0.74 $ 0.93 $ 0.92 $ 0.39 $ 1.02 $ 1.67 $ 2.57 $ 3.67 $ ADV - Last Month 76.0 % Growth y/y 25.2% 25.1% (0.9%) (57.4%) 161.0% 63.6% 53.4% 43.0% vs Consensus 22.6% 31.2% 20.5% 20.6% 23.3% 4Y Price Target (2028 Year-End) Bear Base Bull Normalized FCF 275.9 318.5 342.0 245.5 594.8 903.7 1,310.0 1,827.4 Revenue 4,127.3 5,230.1 5,984.5 % Margin 14.2% 14.6% 13.9% 8.9% 18.4% 24.0% 29.6% 34.9% Gross Profit 3,387.9 4,293.4 4,912.9 % Growth y/y (17.9%) 15.4% 7.4% (28.2%) 142.3% 51.9% 45.0% 39.5% Adj. EBITDA 1,115.7 2,081.5 2,740.9 Multiple 25.0x 40.0x 60.0x Consensus Estimates Enterprise Value 27,892.6 83,260.0 164,451.6 (Figures in millions USD) Historical Projected 2021 2022 2023 2024 2025 2026 2027 2028 (-) Net Debt (7,360.6) (8,708.9) (9,859.2) Total Revenue 2,449.3 2,730.4 3,082.6 3,578.0 4,161.0 4,802.2 Equity Value 35,253.2 91,968.9 174,310.8 % Growth y/y 11.5% 12.9% 16.1% 16.3% 15.4% Diluted Shares Out. 431.0 431.0 431.0 Adj. EBITDA 487.5 211.9 482.3 866.2 1,238.0 1,540.9 Share Price 81.80 $ 213.40 $ 404.45 $ % Margin 19.9% 7.8% 15.6% 24.2% 29.8% 32.1% % Growth y/y (56.5%) 127.7% 79.6% 42.9% 24.5% MOIC (x) 1.1x 2.9x 5.4x % IRR 2.3% 28.9% 50.3% Diluted EPS 0.93 $ 0.32 $ 0.78 $ 1.39 $ 2.13 $ 2.98 $ % Growth y/y (65.6%) 143.8% 78.2% 53.2% 39.9% Diluted EPS 2.33 $ 3.67 $ 4.81 $ Implied P/E Multiple 35.1x 58.1x 84.2x Current Valuation (BASE CASE) Normalized FCF 1,218.3 1,827.4 2,340.0 (Figures in millions USD) Historical Projected Implied FCF Multiple 28.9x 50.3x 74.5x 2021 2022 2023 2024 2025 2026 2027 2028 EV / Revenue (TI) 10.7x 9.6x 8.2x 7.0x 6.0x 5.0x Blended 4Y Price Target EV / EBITDA (TI) 55.5x 109.3x 47.3x 28.1x 18.2x 12.7x Weight Share Price MOIC (x) % IRR P / E (TI) 80.7x 189.4x 72.6x 44.4x 28.9x 20.2x Bear 15% 81.80 $ 1.1x 2.3% Base 60% 213.40 $ 2.9x 28.9% EV / Revenue (Street) 10.8x 9.7x 8.6x 7.4x 6.3x 5.5x Bull 25% 404.45 $ 5.4x 50.3% EV / EBITDA (Street) 54.1x 124.5x 54.7x 30.4x 21.3x 17.1x Blended 100% 241.42 $ 3.2x 30.2% P / E (Street) 79.9x 232.2x 95.3x 53.5x 34.9x 24.9x CSGP offers an attractive risk/reward skew with conservative multiple underwrites, delivering 29% IRR and 2.9x MOIC in our 2028 base case. Projections & Valuation Base case underwrites monopoly economics in core data suite and convexity in Homes.com ramp • 19k annual CoStar Suite subscriber add and 3% y/y ARPU growth yields double-digit core returns • 11% Apartments.com ARR / client growth driven by inflection in 100+ unit multifamily properties • Homes.com member agents maintain 35%+ CAGR, driving +24% beat to 2028 Street Total Sales • Bottom-line profitability driven by flat-lined S&M spend as CSGP tapers Homes.com advertising • Overall, we underwrite a +23% beat to 2028 Street EPS Conservative 40x fwd. EBITDA multiple at 2028 exit • CSGP has traded at 48x EV/EBITDA over past five years, at a premium to both top in-class info service companies (25x median) and vertical marketplaces (21x median) • Concerns over elevated Homes.com S&M are overblown, as data scrapes reveal effective agent conversion to the platform (agent listings +25% CAGR over past nine years) • Exit multiples in all cases remain conservative to trading history (72x average over past year, 58x average over past two years) Key Assumptions & Drivers 11 Sources: Company Filings, Internal Estimates, Bloomberg Terminal, CapIQ
  11. 2024 - 2028 Revenue CAGR (%) 10.8% 17.4% 21.4% 2028

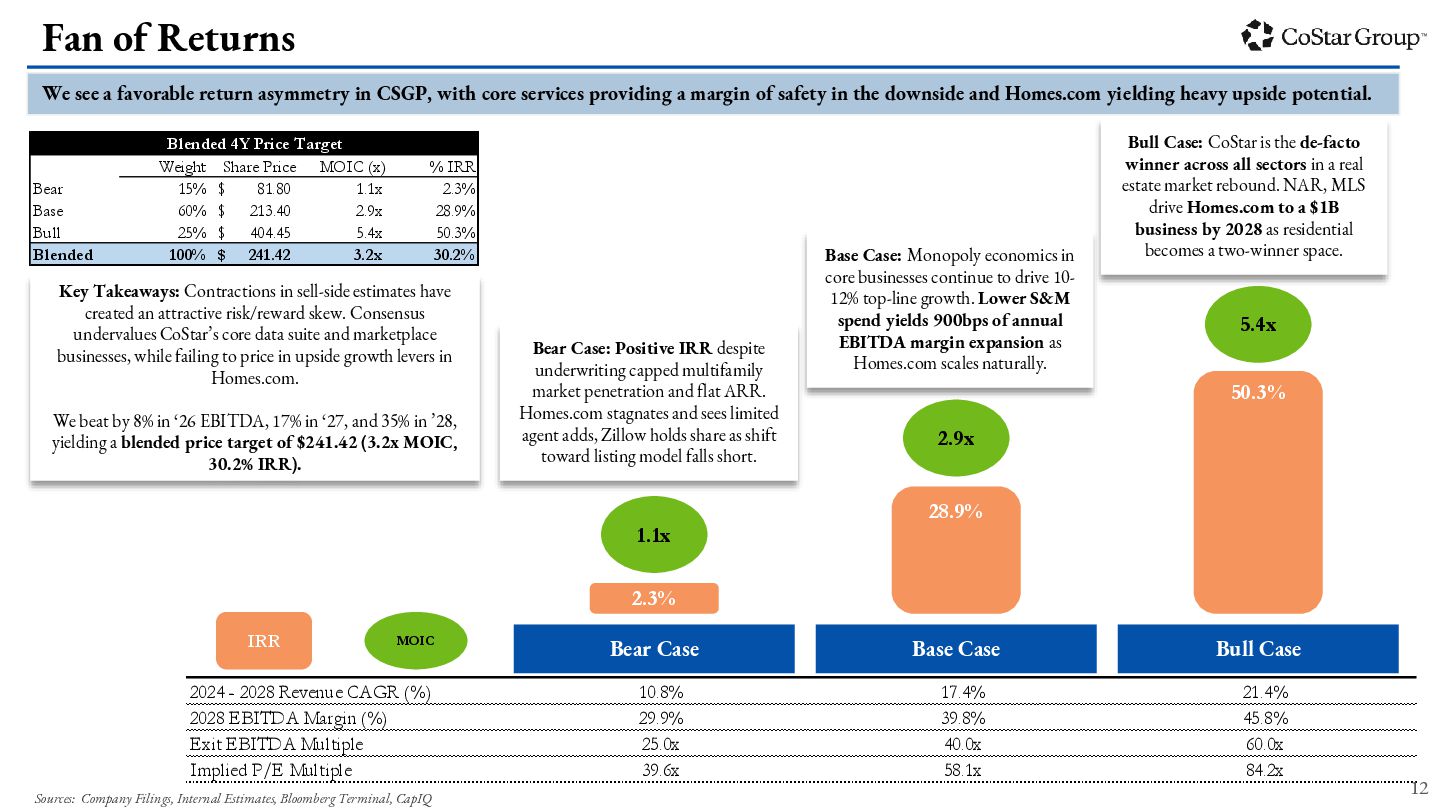
    EBITDA Margin (%) 29.9% 39.8% 45.8% Exit EBITDA Multiple 25.0x 40.0x 60.0x Implied P/E Multiple 39.6x 58.1x 84.2x We see a favorable return asymmetry in CSGP, with core services providing a margin of safety in the downside and Homes.com yielding heavy upside potential. Fan of Returns Base Case: Monopoly economics in core businesses continue to drive 10- 12% top-line growth. Lower S&M spend yields 900bps of annual EBITDA margin expansion as Homes.com scales naturally. Bull Case: CoStar is the de-facto winner across all sectors in a real estate market rebound. NAR, MLS drive Homes.com to a $1B business by 2028 as residential becomes a two-winner space. Bear Case: Positive IRR despite underwriting capped multifamily market penetration and flat ARR. Homes.com stagnates and sees limited agent adds, Zillow holds share as shift toward listing model falls short. 2.3% Bear Case Base Case Bull Case 28.9% 50.3% IRR 1.1x 2.9x 5.4x MOIC Key Takeaways: Contractions in sell-side estimates have created an attractive risk/reward skew. Consensus undervalues CoStar’s core data suite and marketplace businesses, while failing to price in upside growth levers in Homes.com. We beat by 8% in ‘26 EBITDA, 17% in ‘27, and 35% in ’28, yielding a blended price target of $241.42 (3.2x MOIC, 30.2% IRR). Blended 4Y Price Target Weight Share Price MOIC (x) % IRR Bear 15% 81.80 $ 1.1x 2.3% Base 60% 213.40 $ 2.9x 28.9% Bull 25% 404.45 $ 5.4x 50.3% Blended 100% 241.42 $ 3.2x 30.2% 12 Sources: Company Filings, Internal Estimates, Bloomberg Terminal, CapIQ
  12. Comps CoStar trades at a discount to comparable info services

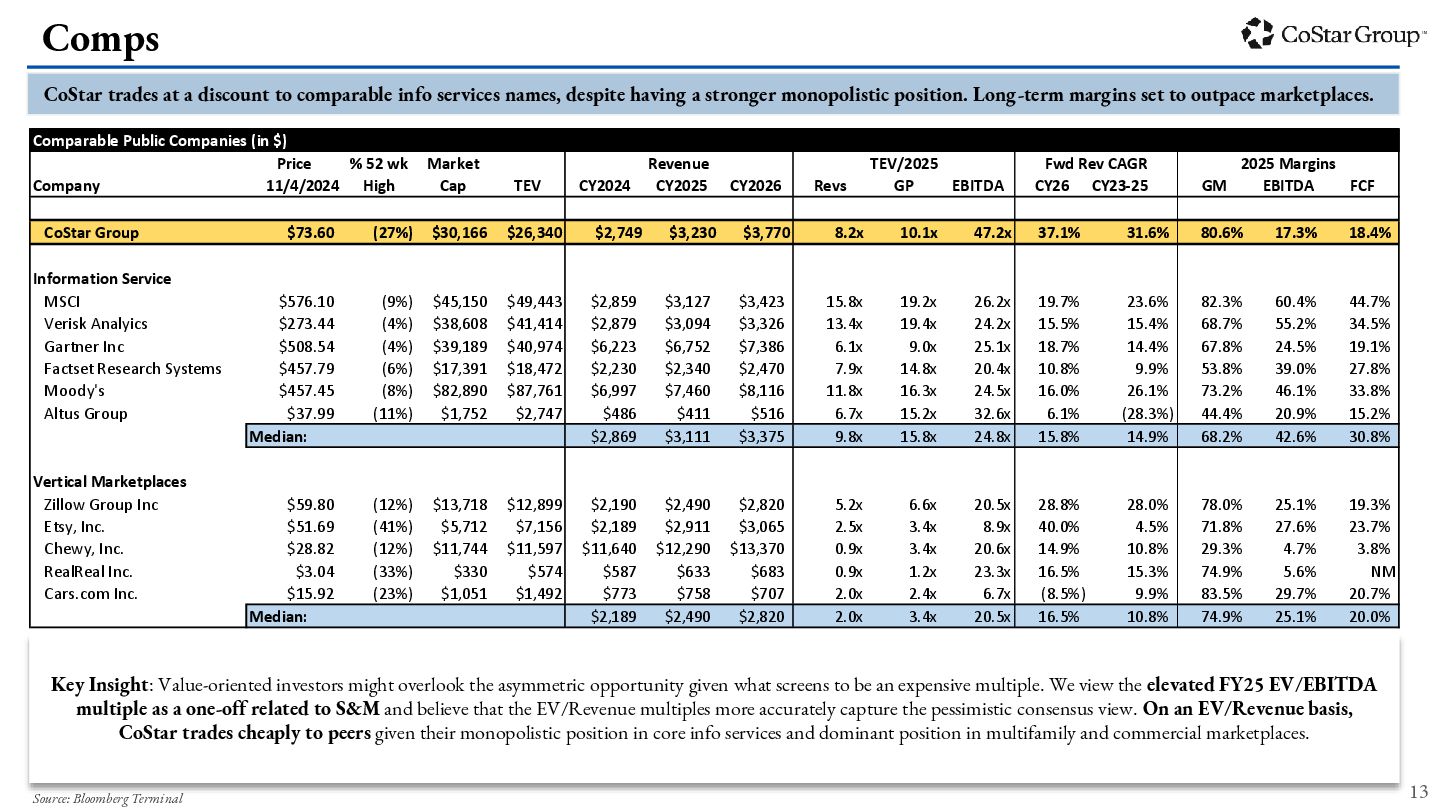
    names, despite having a stronger monopolistic position. Long-term margins set to outpace marketplaces. Comparable Public Companies (in $) Price % 52 wk Market Revenue TEV/2025 Fwd Rev CAGR 2025 Margins Company 11/4/2024 High Cap TEV CY2024 CY2025 CY2026 Revs GP EBITDA CY26 CY23-25 GM EBITDA FCF CoStar Group $73.60 (27%) $30,166 $26,340 $2,749 $3,230 $3,770 8.2x 10.1x 47.2x 37.1% 31.6% 80.6% 17.3% 18.4% Information Service MSCI $576.10 (9%) $45,150 $49,443 $2,859 $3,127 $3,423 15.8x 19.2x 26.2x 19.7% 23.6% 82.3% 60.4% 44.7% Verisk Analyics $273.44 (4%) $38,608 $41,414 $2,879 $3,094 $3,326 13.4x 19.4x 24.2x 15.5% 15.4% 68.7% 55.2% 34.5% Gartner Inc $508.54 (4%) $39,189 $40,974 $6,223 $6,752 $7,386 6.1x 9.0x 25.1x 18.7% 14.4% 67.8% 24.5% 19.1% Factset Research Systems $457.79 (6%) $17,391 $18,472 $2,230 $2,340 $2,470 7.9x 14.8x 20.4x 10.8% 9.9% 53.8% 39.0% 27.8% Moody's $457.45 (8%) $82,890 $87,761 $6,997 $7,460 $8,116 11.8x 16.3x 24.5x 16.0% 26.1% 73.2% 46.1% 33.8% Altus Group $37.99 (11%) $1,752 $2,747 $486 $411 $516 6.7x 15.2x 32.6x 6.1% (28.3%) 44.4% 20.9% 15.2% Median: $2,869 $3,111 $3,375 9.8x 15.8x 24.8x 15.8% 14.9% 68.2% 42.6% 30.8% Vertical Marketplaces Zillow Group Inc $59.80 (12%) $13,718 $12,899 $2,190 $2,490 $2,820 5.2x 6.6x 20.5x 28.8% 28.0% 78.0% 25.1% 19.3% Etsy, Inc. $51.69 (41%) $5,712 $7,156 $2,189 $2,911 $3,065 2.5x 3.4x 8.9x 40.0% 4.5% 71.8% 27.6% 23.7% Chewy, Inc. $28.82 (12%) $11,744 $11,597 $11,640 $12,290 $13,370 0.9x 3.4x 20.6x 14.9% 10.8% 29.3% 4.7% 3.8% RealReal Inc. $3.04 (33%) $330 $574 $587 $633 $683 0.9x 1.2x 23.3x 16.5% 15.3% 74.9% 5.6% NM Cars.com Inc. $15.92 (23%) $1,051 $1,492 $773 $758 $707 2.0x 2.4x 6.7x (8.5%) 9.9% 83.5% 29.7% 20.7% Median: $2,189 $2,490 $2,820 2.0x 3.4x 20.5x 16.5% 10.8% 74.9% 25.1% 20.0% Key Insight: Value-oriented investors might overlook the asymmetric opportunity given what screens to be an expensive multiple. We view the elevated FY25 EV/EBITDA multiple as a one-off related to S&M and believe that the EV/Revenue multiples more accurately capture the pessimistic consensus view. On an EV/Revenue basis, CoStar trades cheaply to peers given their monopolistic position in core info services and dominant position in multifamily and commercial marketplaces. 13 Source: Bloomberg Terminal
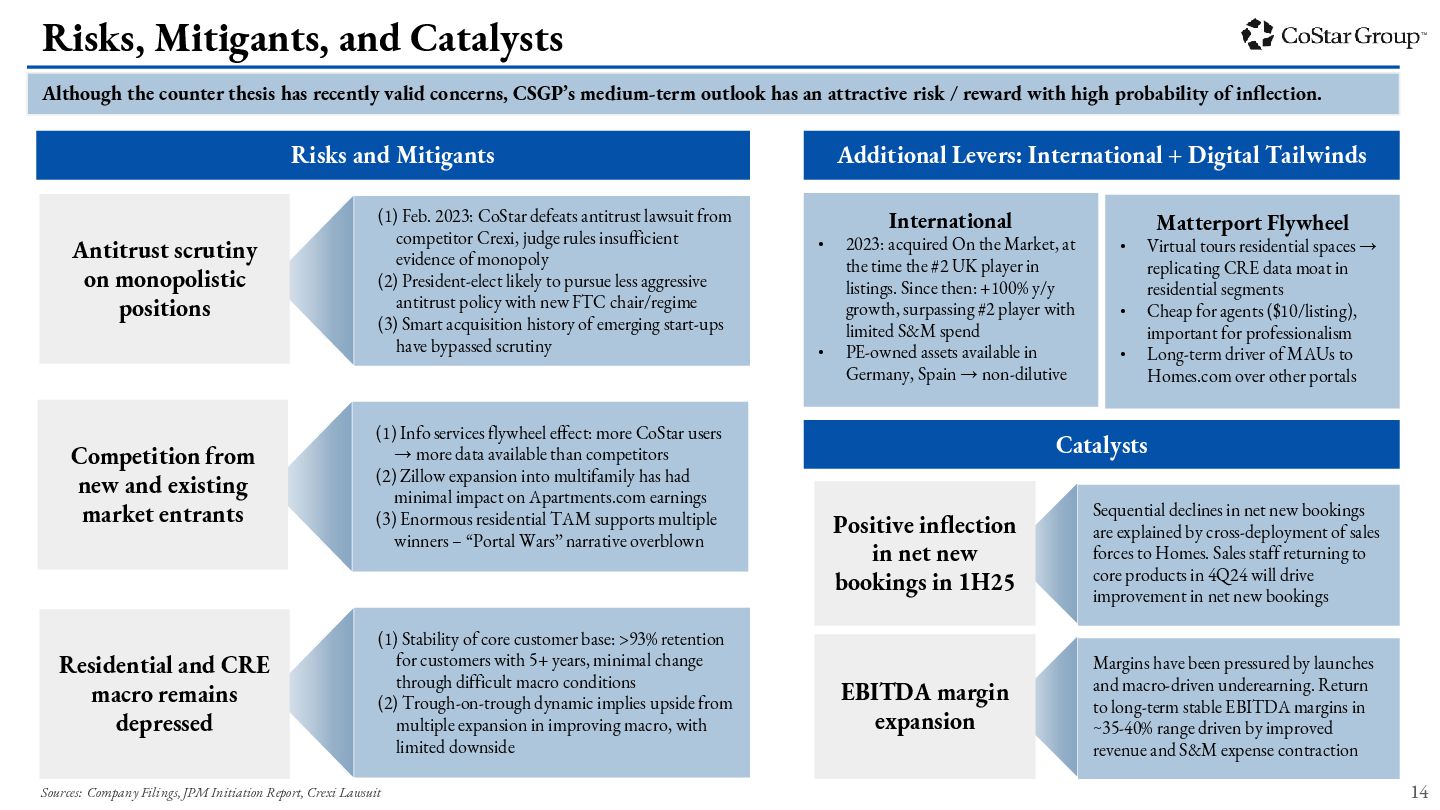
  13. Although the counter thesis has recently valid concerns, CSGP’s medium-term

    outlook has an attractive risk / reward with high probability of inflection. Risks, Mitigants, and Catalysts Risks and Mitigants Catalysts Antitrust scrutiny on monopolistic positions Competition from new and existing market entrants Residential and CRE macro remains depressed (1) Feb. 2023: CoStar defeats antitrust lawsuit from competitor Crexi, judge rules insufficient evidence of monopoly (2) President-elect likely to pursue less aggressive antitrust policy with new FTC chair/regime (3) Smart acquisition history of emerging start-ups have bypassed scrutiny (1) Info services flywheel effect: more CoStar users → more data available than competitors (2) Zillow expansion into multifamily has had minimal impact on Apartments.com earnings (3) Enormous residential TAM supports multiple winners – “Portal Wars” narrative overblown (1) Stability of core customer base: >93% retention for customers with 5+ years, minimal change through difficult macro conditions (2) Trough-on-trough dynamic implies upside from multiple expansion in improving macro, with limited downside Positive inflection in net new bookings in 1H25 EBITDA margin expansion Sequential declines in net new bookings are explained by cross-deployment of sales forces to Homes. Sales staff returning to core products in 4Q24 will drive improvement in net new bookings Margins have been pressured by launches and macro-driven underearning. Return to long-term stable EBITDA margins in ~35-40% range driven by improved revenue and S&M expense contraction Additional Levers: International + Digital Tailwinds International • 2023: acquired On the Market, at the time the #2 UK player in listings. Since then: +100% y/y growth, surpassing #2 player with limited S&M spend • PE-owned assets available in Germany, Spain → non-dilutive Matterport Flywheel • Virtual tours residential spaces → replicating CRE data moat in residential segments • Cheap for agents ($10/listing), important for professionalism • Long-term driver of MAUs to Homes.com over other portals 14 Sources: Company Filings, JPM Initiation Report, Crexi Lawsuit
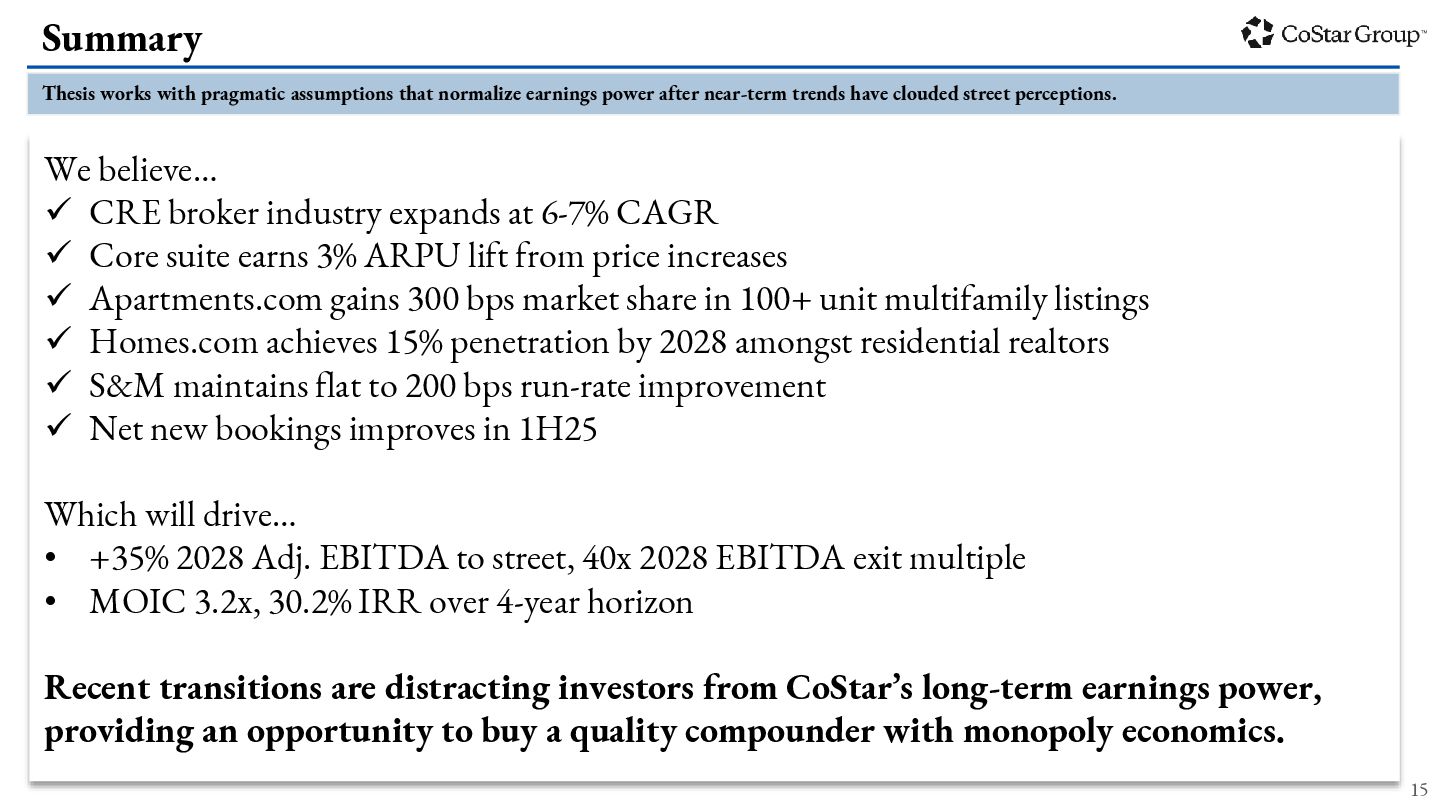
  14. Thesis works with pragmatic assumptions that normalize earnings power after

    near-term trends have clouded street perceptions. Summary We believe… ✓ CRE broker industry expands at 6-7% CAGR ✓ Core suite earns 3% ARPU lift from price increases ✓ Apartments.com gains 300 bps market share in 100+ unit multifamily listings ✓ Homes.com achieves 15% penetration by 2028 amongst residential realtors ✓ S&M maintains flat to 200 bps run-rate improvement ✓ Net new bookings improves in 1H25 Which will drive… • +35% 2028 Adj. EBITDA to street, 40x 2028 EBITDA exit multiple • MOIC 3.2x, 30.2% IRR over 4-year horizon Recent transitions are distracting investors from CoStar’s long-term earnings power, providing an opportunity to buy a quality compounder with monopoly economics. 15