Upgrade to Pro — share decks privately, control downloads, hide ads and more …

PostgreSQL Performance Mysteries When low IOPS ...

PostgreSQL Performance Mysteries When low IOPS still means high latency

PostgreSQL performance problems are not always what they appear to be. In production systems, teams often encounter increased query latency, disk bandwidth saturation, or application slowdowns—even when traditional indicators like IOPS remain low or unchanged. This talk examines real-world PostgreSQL incidents where performance degradation was driven not by slow queries, CPU pressure, or missing indexes, but by memory behavior, cache eviction, and interactions between PostgreSQL shared buffers, the operating system page cache, and storage layers. We’ll walk through scenarios where: Query execution times appeared normal, yet applications experienced latency Disk bandwidth increased without a corresponding rise in IOPS Restart events or memory pressure triggered cascading I/O activity Increasing shared_buffers did not improve performance The session highlights how to correlate PostgreSQL internal statistics, wait events, and storage behavior to uncover bottlenecks that are often overlooked. Practical techniques using tools such as pg_buffercache, pg_stat_statements, wait event analysis, and cache warming strategies (including pg_prewarm) will be covered. The focus is on understanding behavior at scale, identifying the metrics that matter, and applying effective diagnostic and mitigation approaches in production environments.

Avatar for Gayathri Reddy Paderla

Gayathri Reddy Paderla

October 05, 2026

Other Decks in Technology

Transcript

  1. PostgreSQL Performance Mysteries When low IOPS still means high latency

    Gayathri Paderla PostgreSQL Summit US | PostgreSQL 17 + 18 1
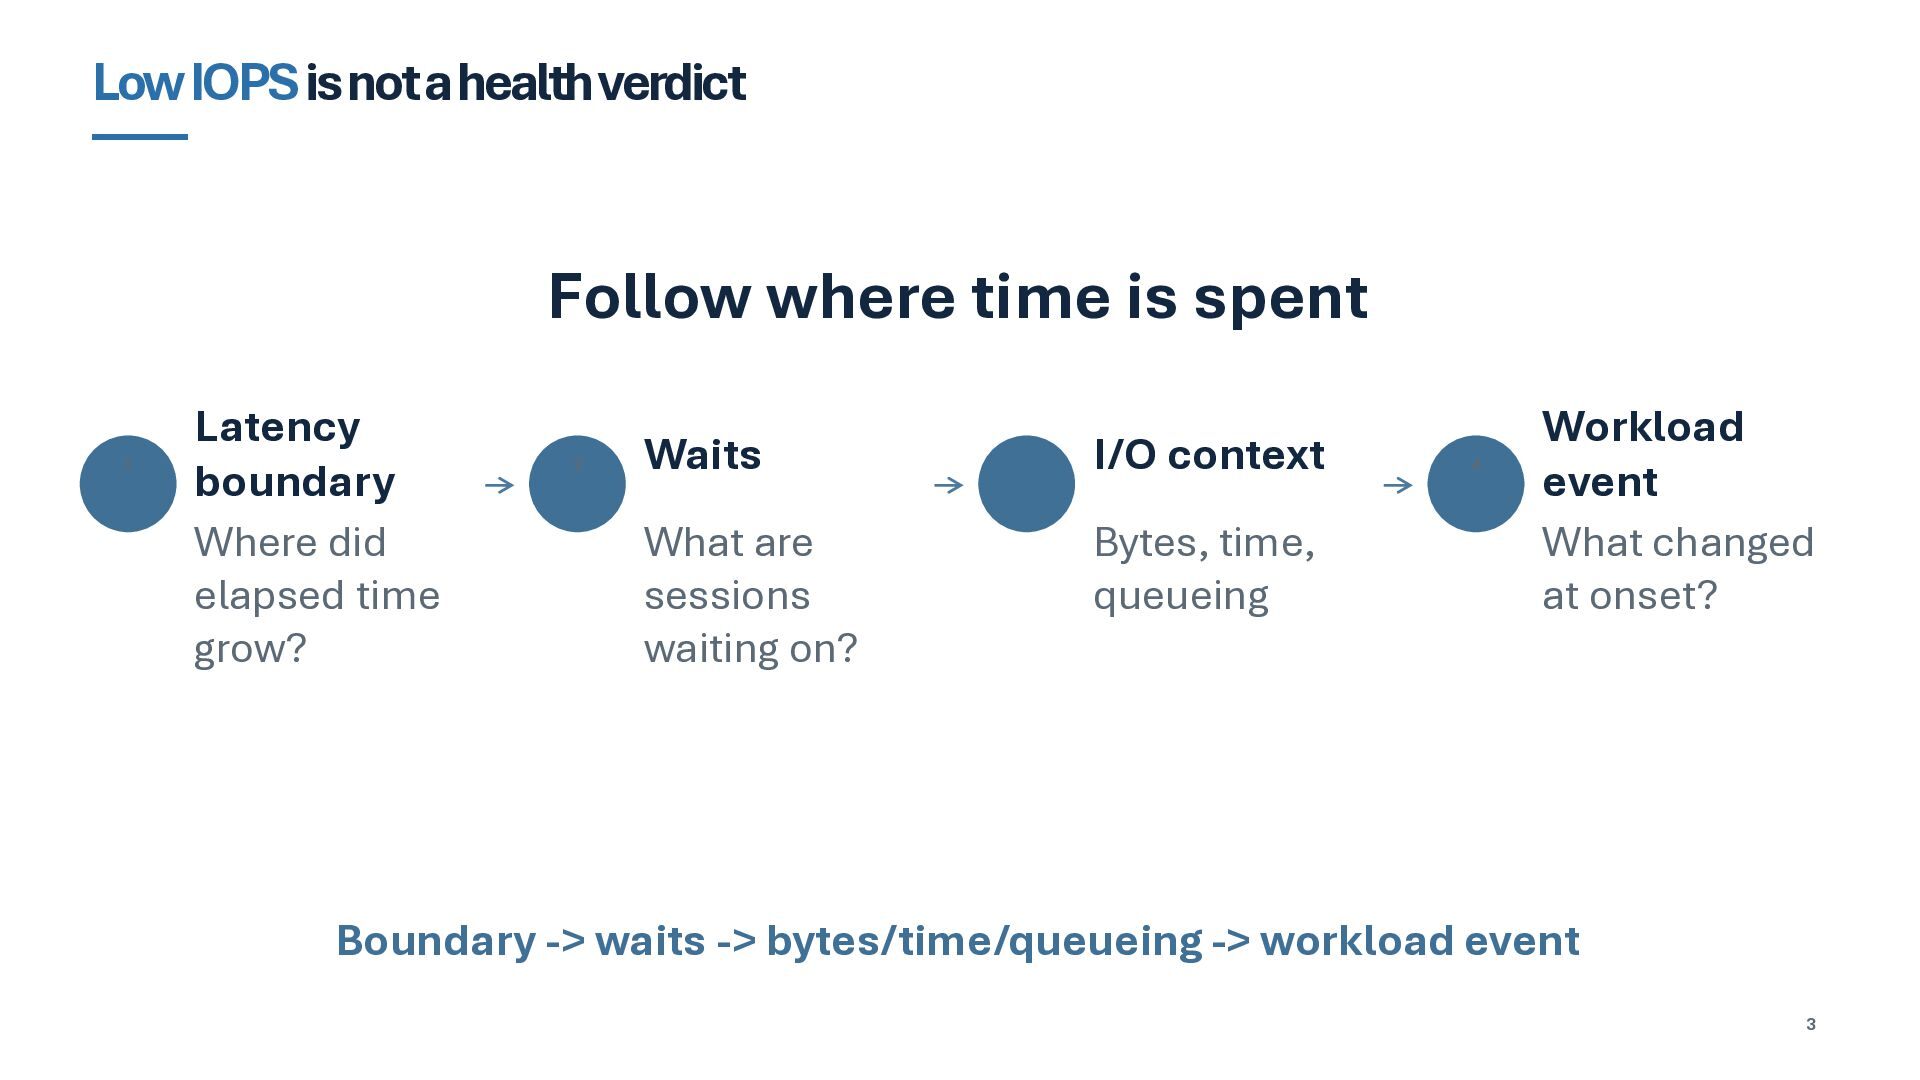
  2. Low IOPSis not a health verdict Follow where time is

    spent 1 Latency boundary Where did elapsed time grow? 2 Waits I/O context What are sessions waiting on? Bytes, time, queueing 4 Workload event What changed at onset? Boundary -> waits -> bytes/time/queueing -> workload event 3
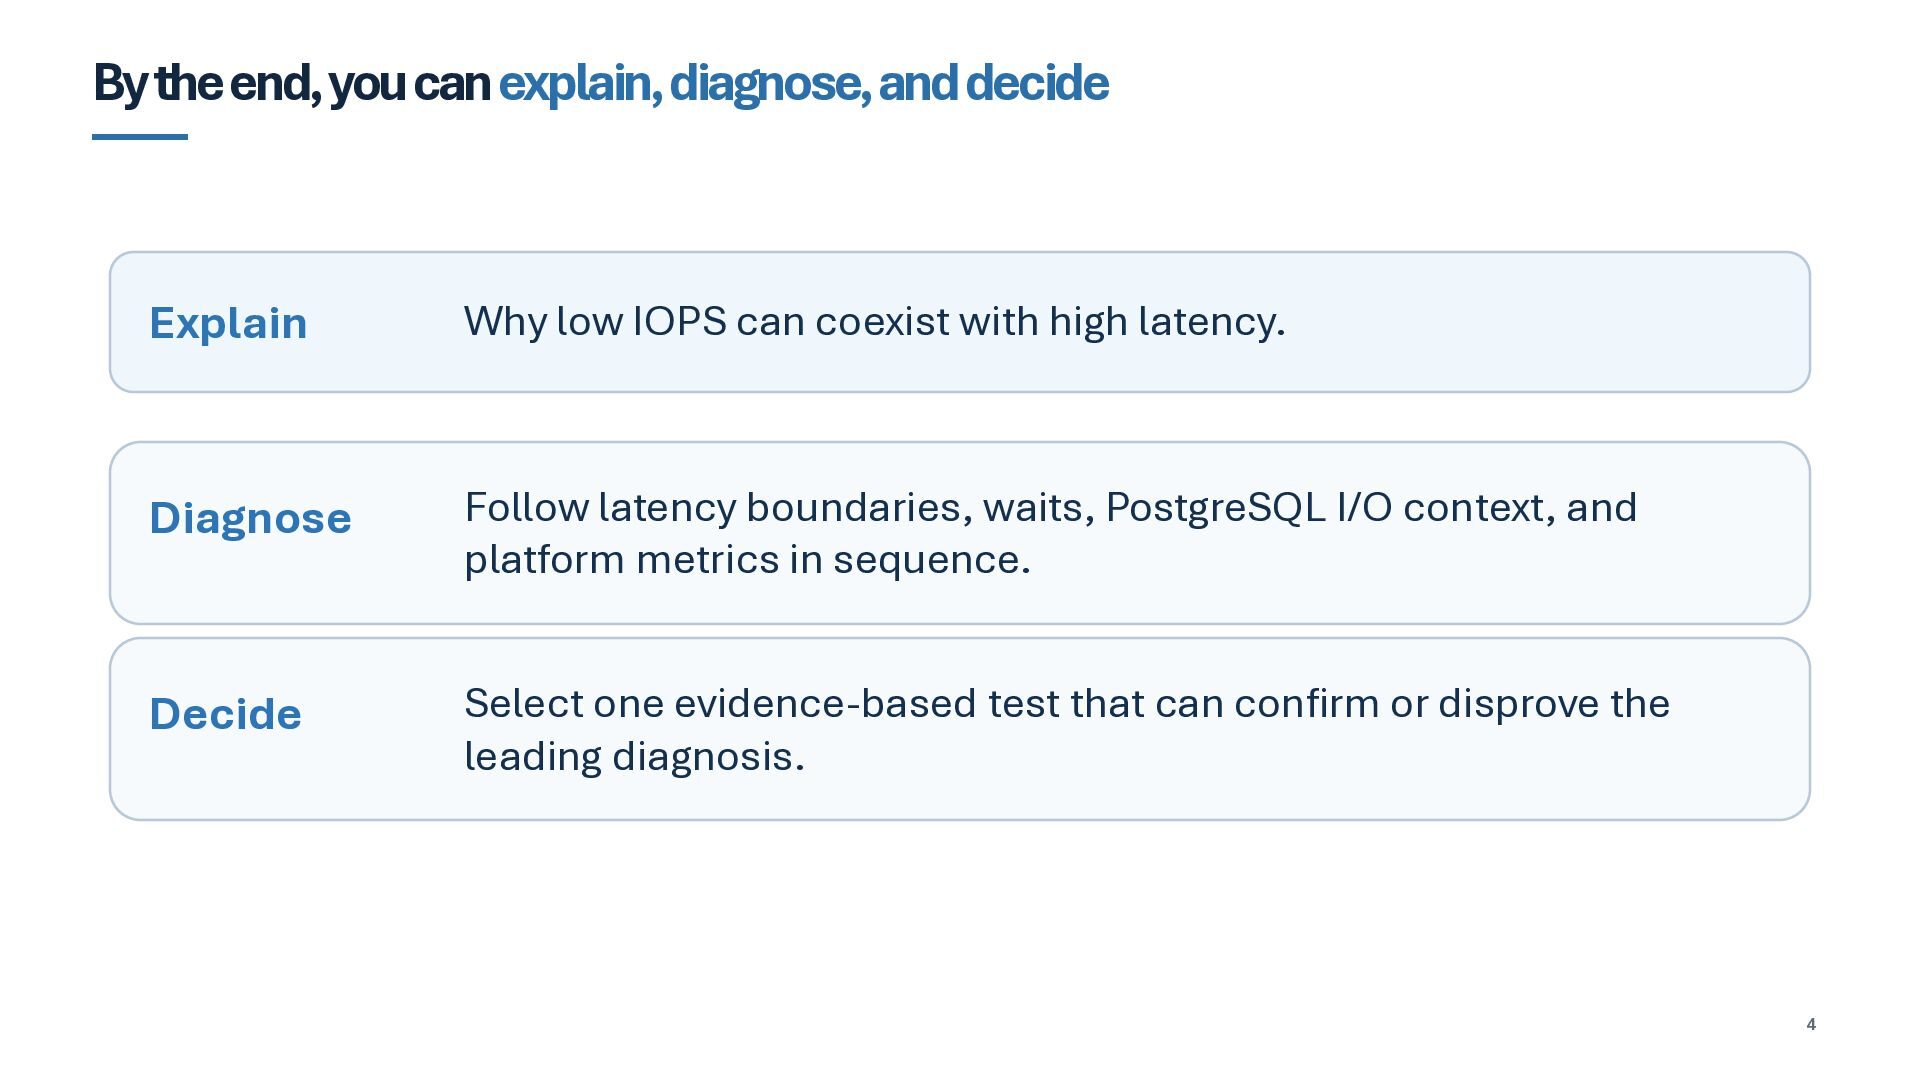
  3. By the end, you can explain, diagnose, and decide Explain

    Why low IOPS can coexist with high latency. Diagnose Follow latency boundaries, waits, PostgreSQL I/O context, and platform metrics in sequence. Decide Select one evidence-based test that can confirm or disprove the leading diagnosis. 4
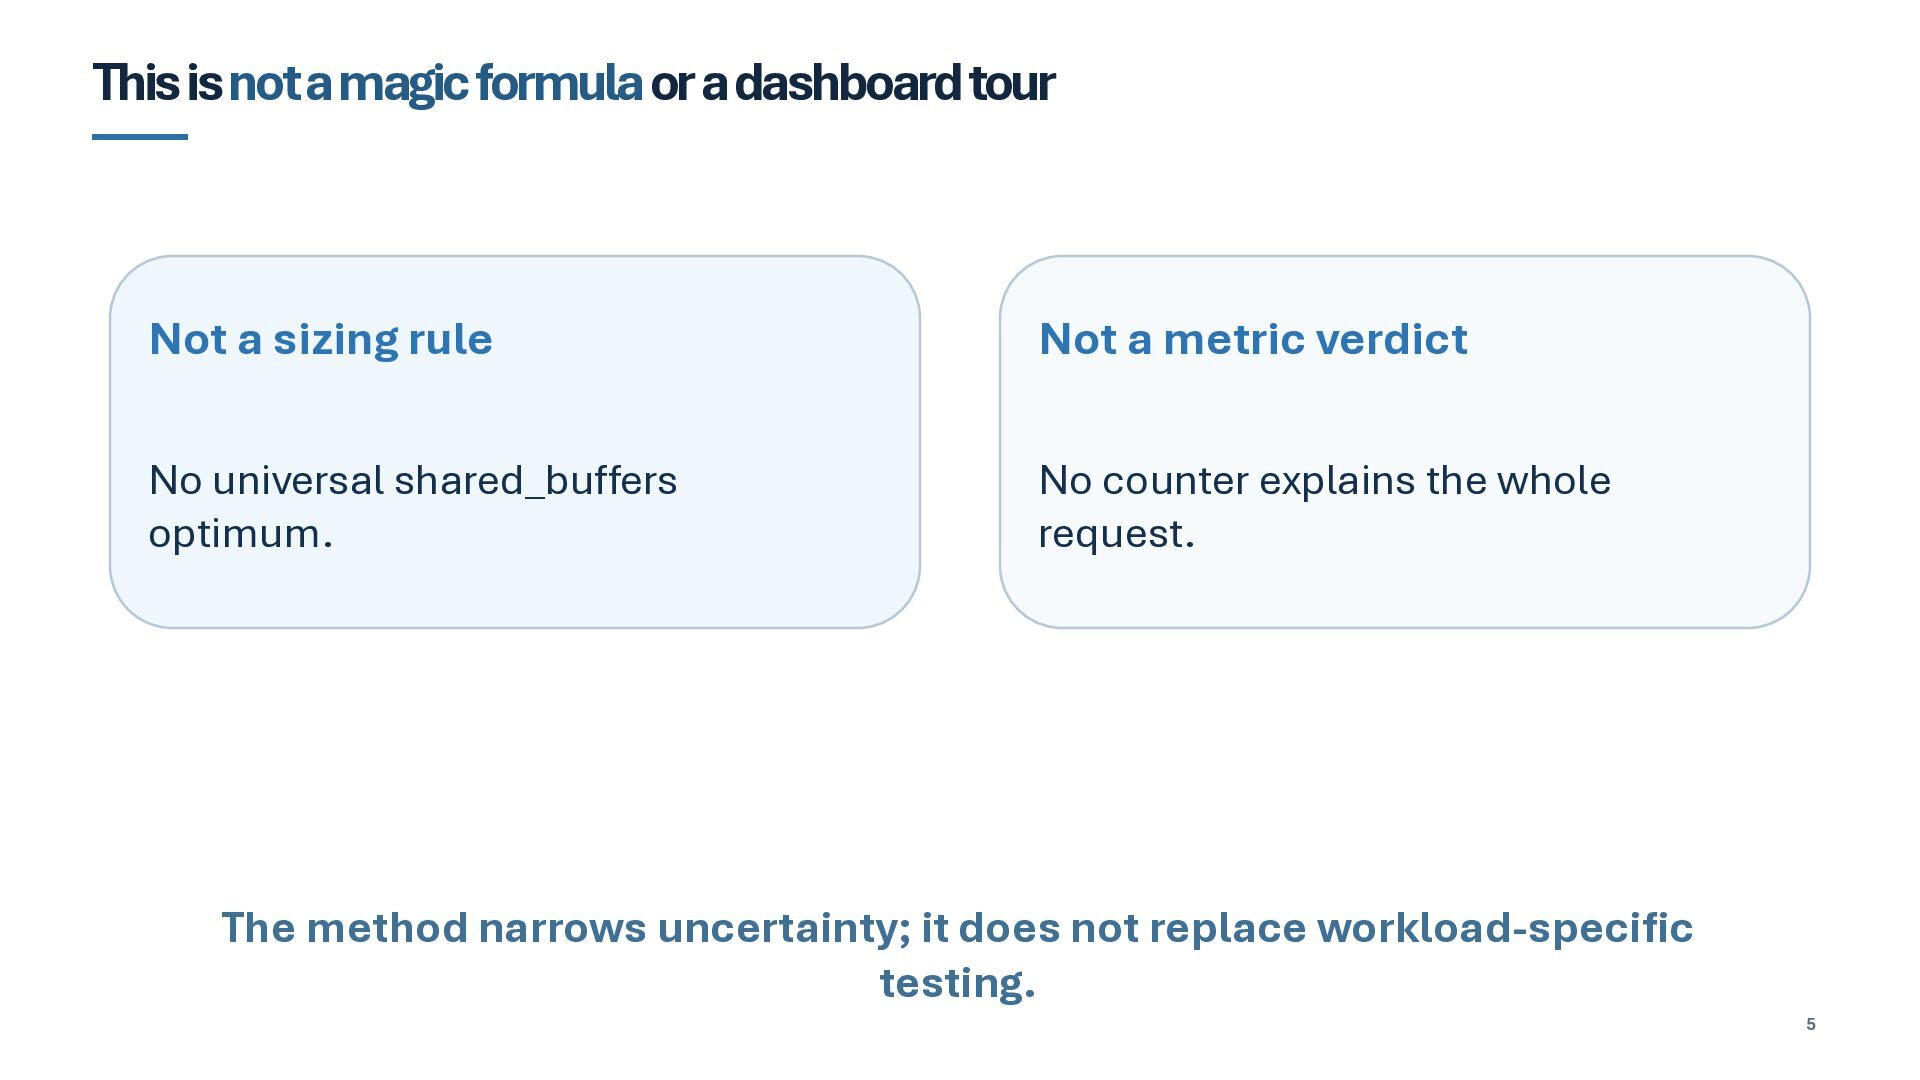
  4. This is not a magic formulaor a dashboard tour Not

    a sizing rule Not a metric verdict No universal shared_buffers optimum. No counter explains the whole request. The method narrows uncertainty; it does not replace workload-specific testing. 5
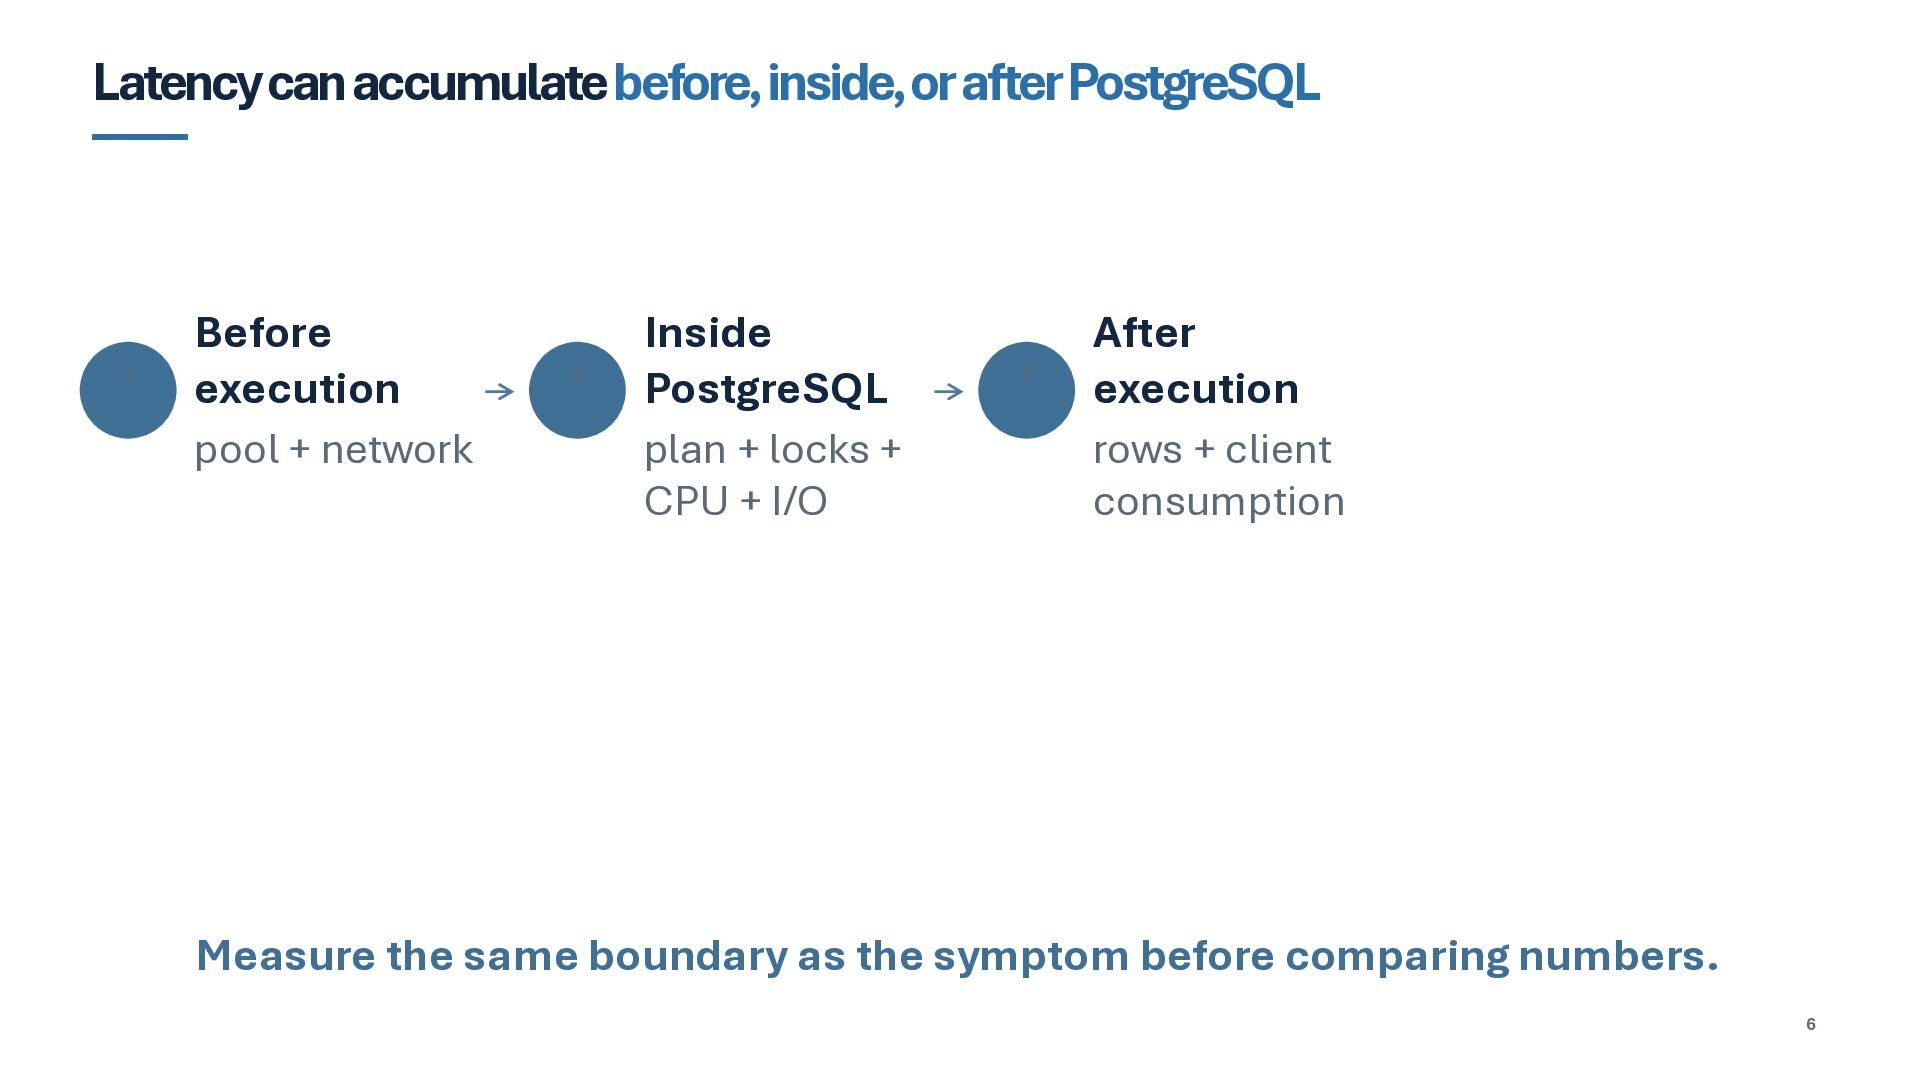
  5. Latency can accumulate before, inside, or after PostgreSQL 1 Before

    execution pool + network 2 Inside PostgreSQL plan + locks + CPU + I/O 3 After execution rows + client consumption Measure the same boundary as the symptom before comparing numbers. 6
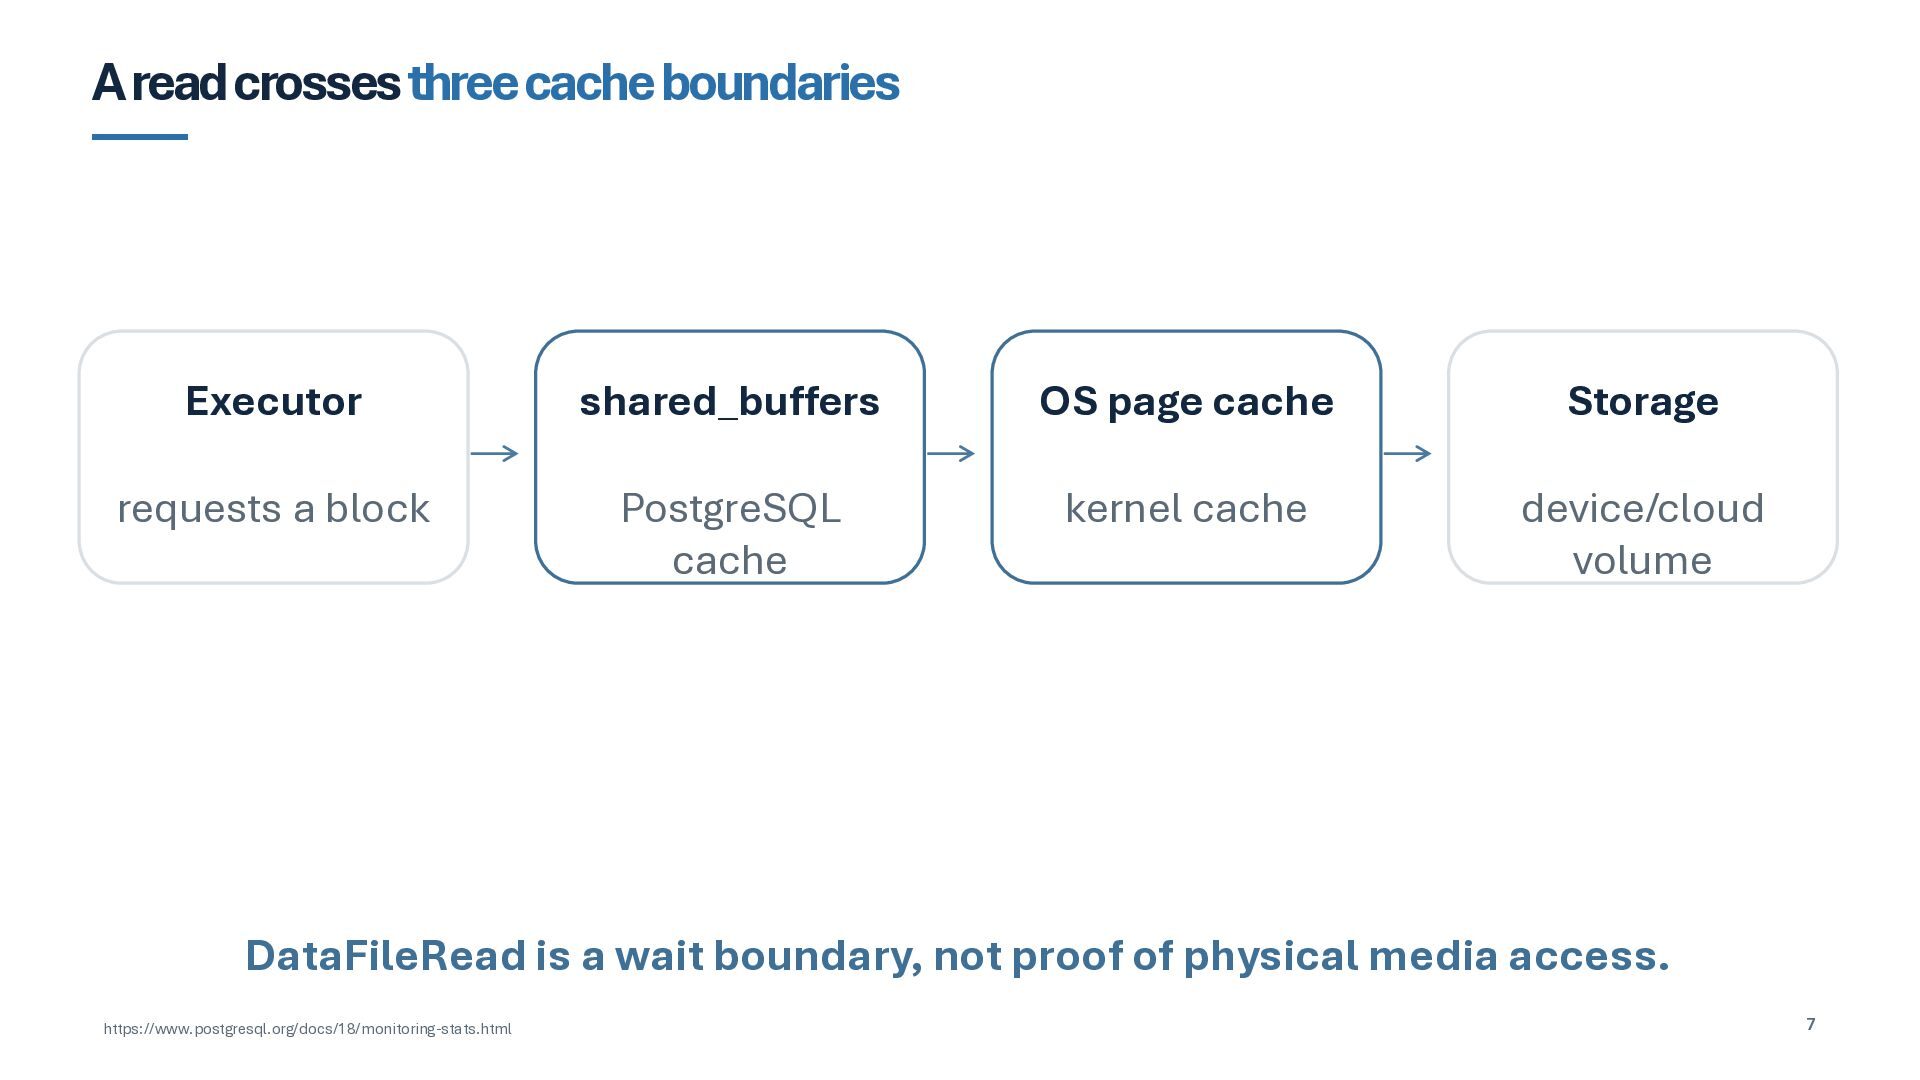
  6. A read crosses three cache boundaries Executor shared_buffers OS page

    cache Storage requests a block PostgreSQL cache kernel cache device/cloud volume DataFileRead is a wait boundary, not proof of physical media access. https://www.postgresql.org/docs/18/monitoring-stats.html 7
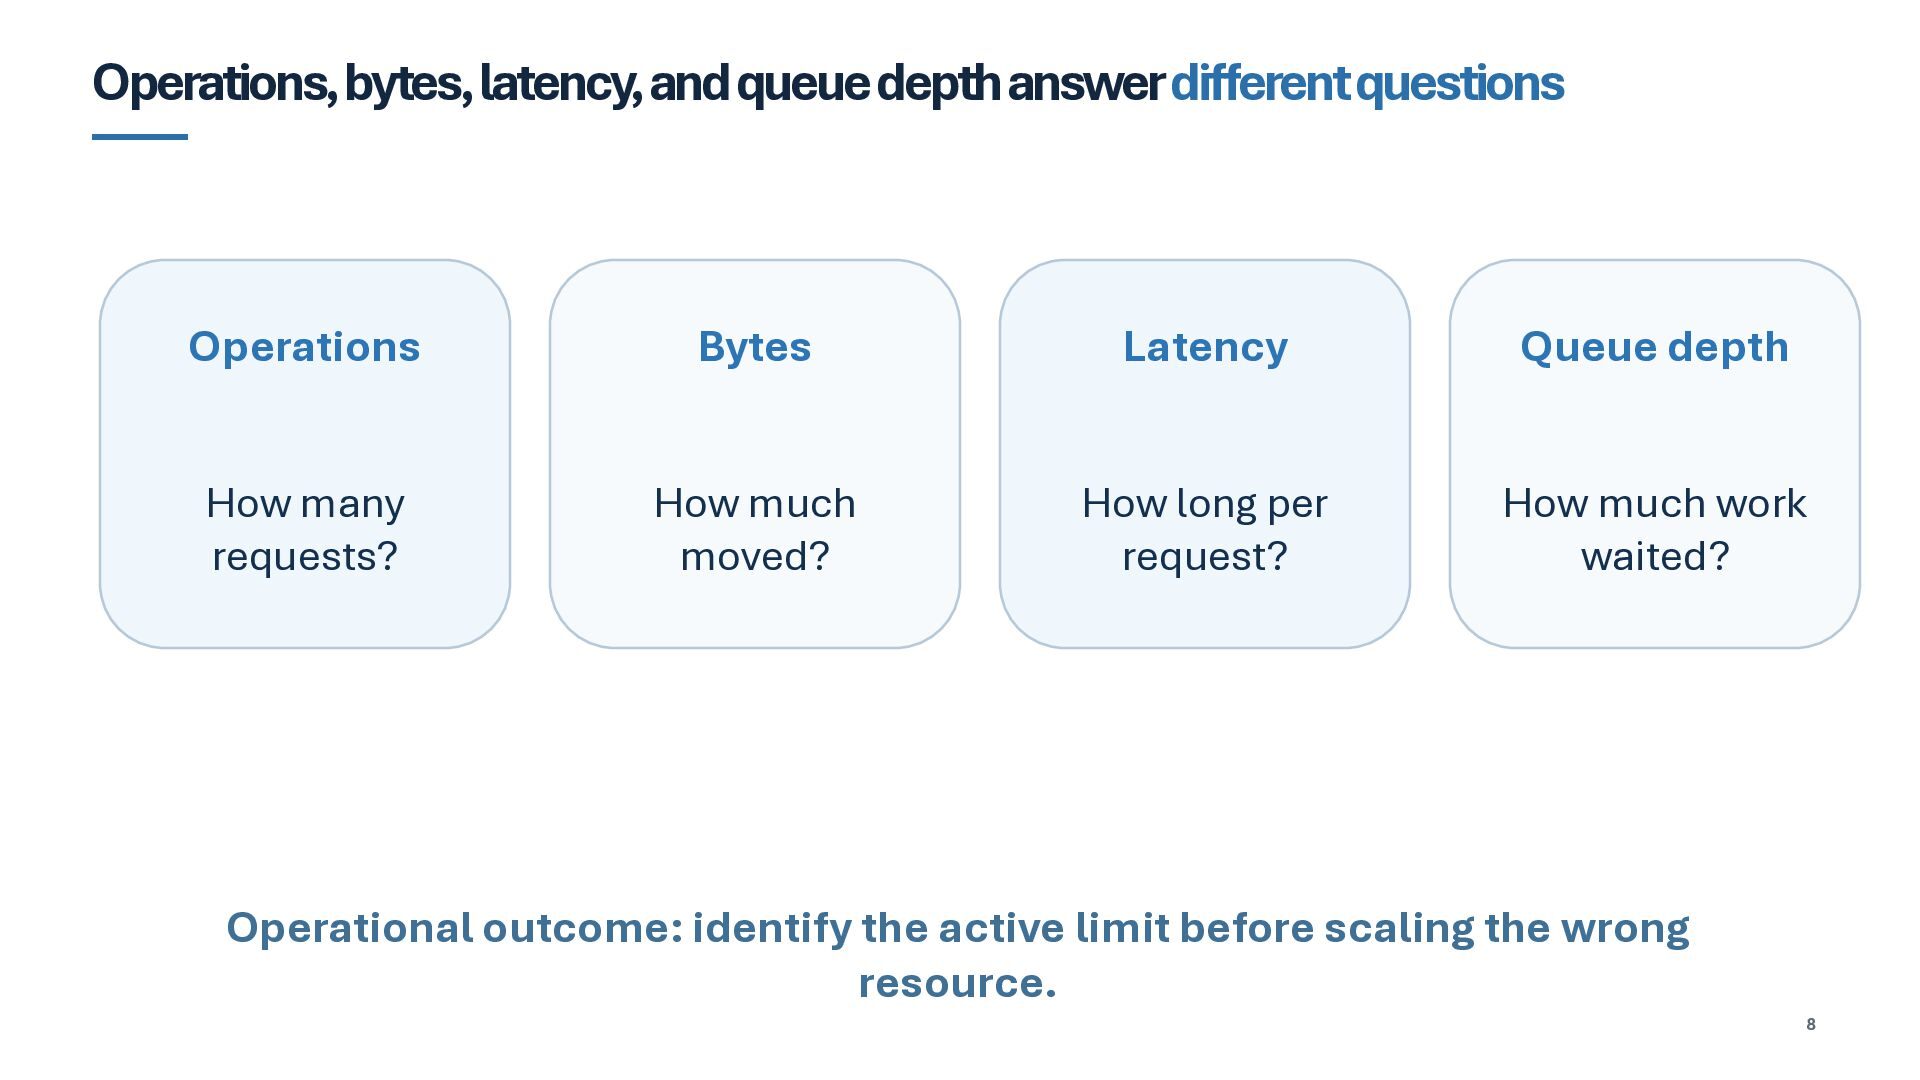
  7. Operations, bytes, latency, and queue depth answer different questions Operations

    Bytes Latency Queue depth How many requests? How much moved? How long per request? How much work waited? Operational outcome: identify the active limit before scaling the wrong resource. 8
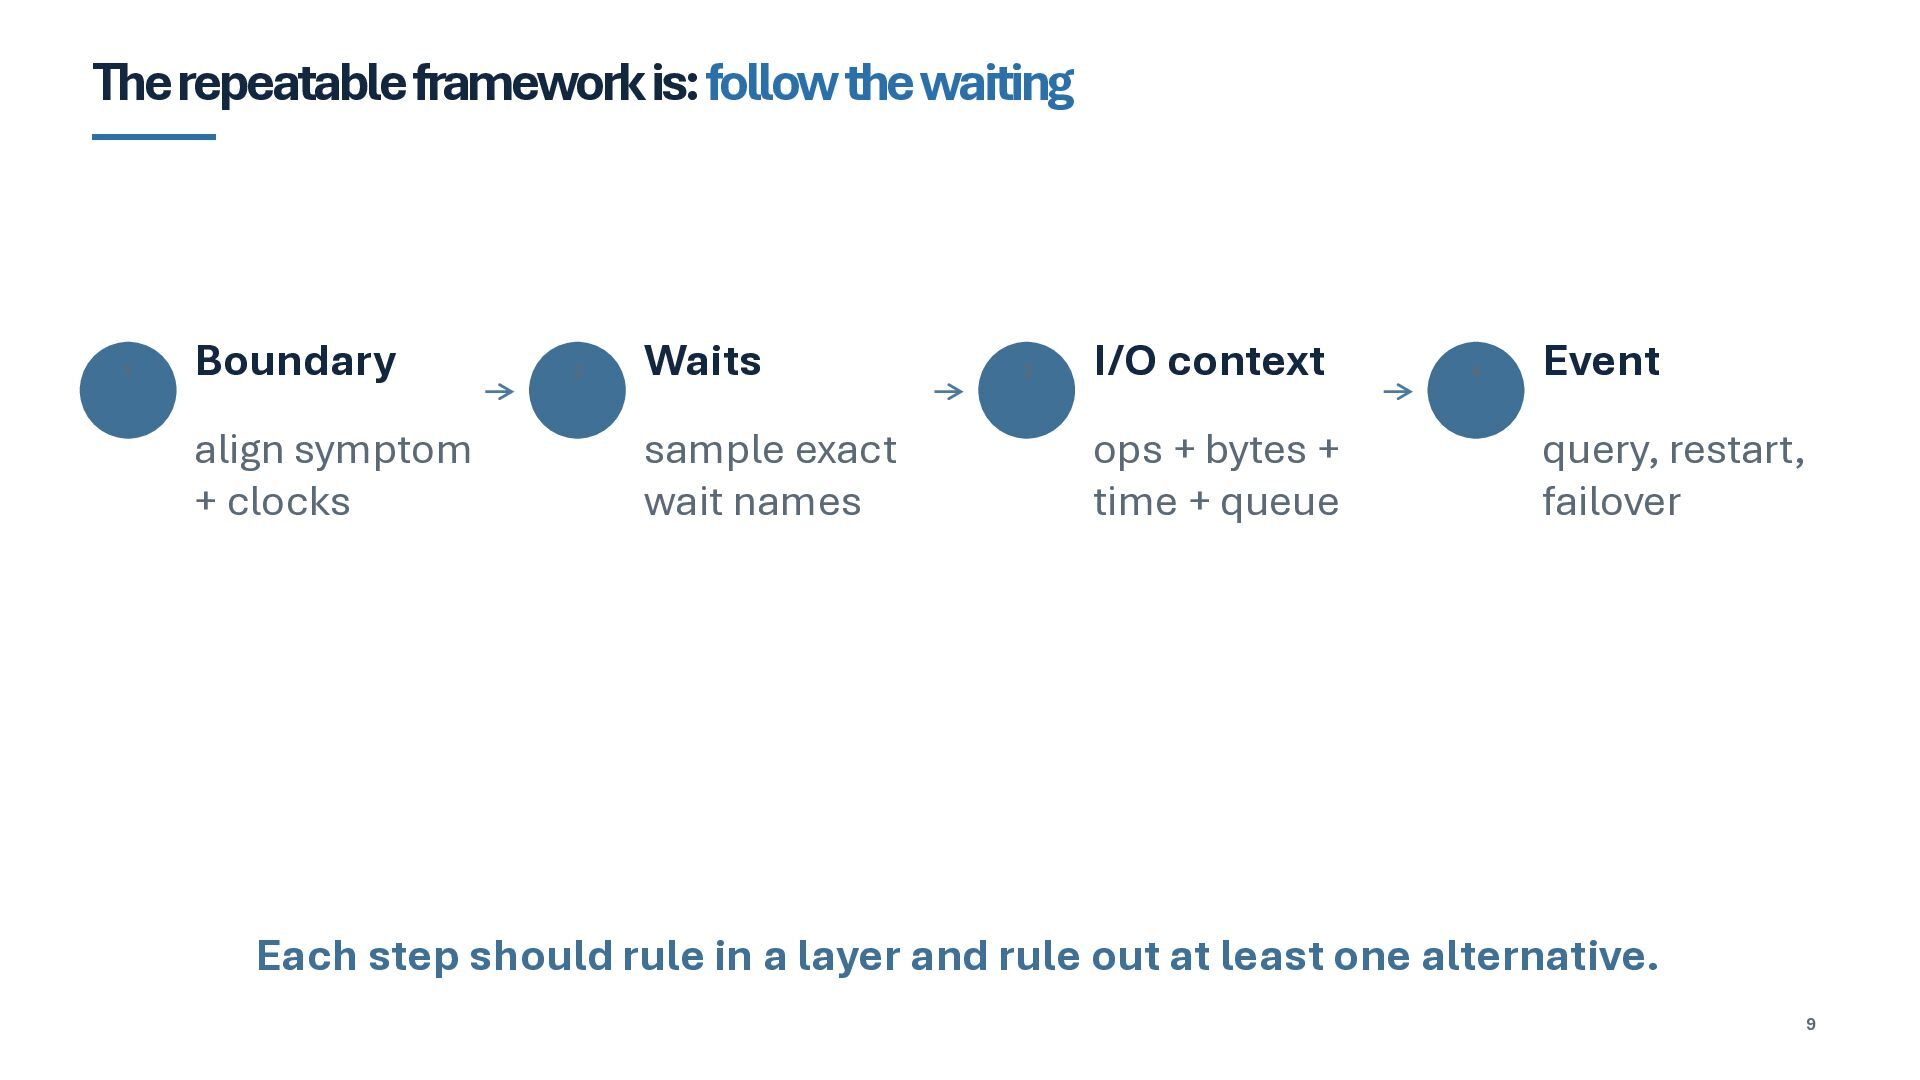
  8. The repeatable framework is: follow the waiting 1 Boundary align

    symptom + clocks 2 Waits sample exact wait names 3 I/O context ops + bytes + time + queue 4 Event query, restart, failover Each step should rule in a layer and rule out at least one alternative. 9
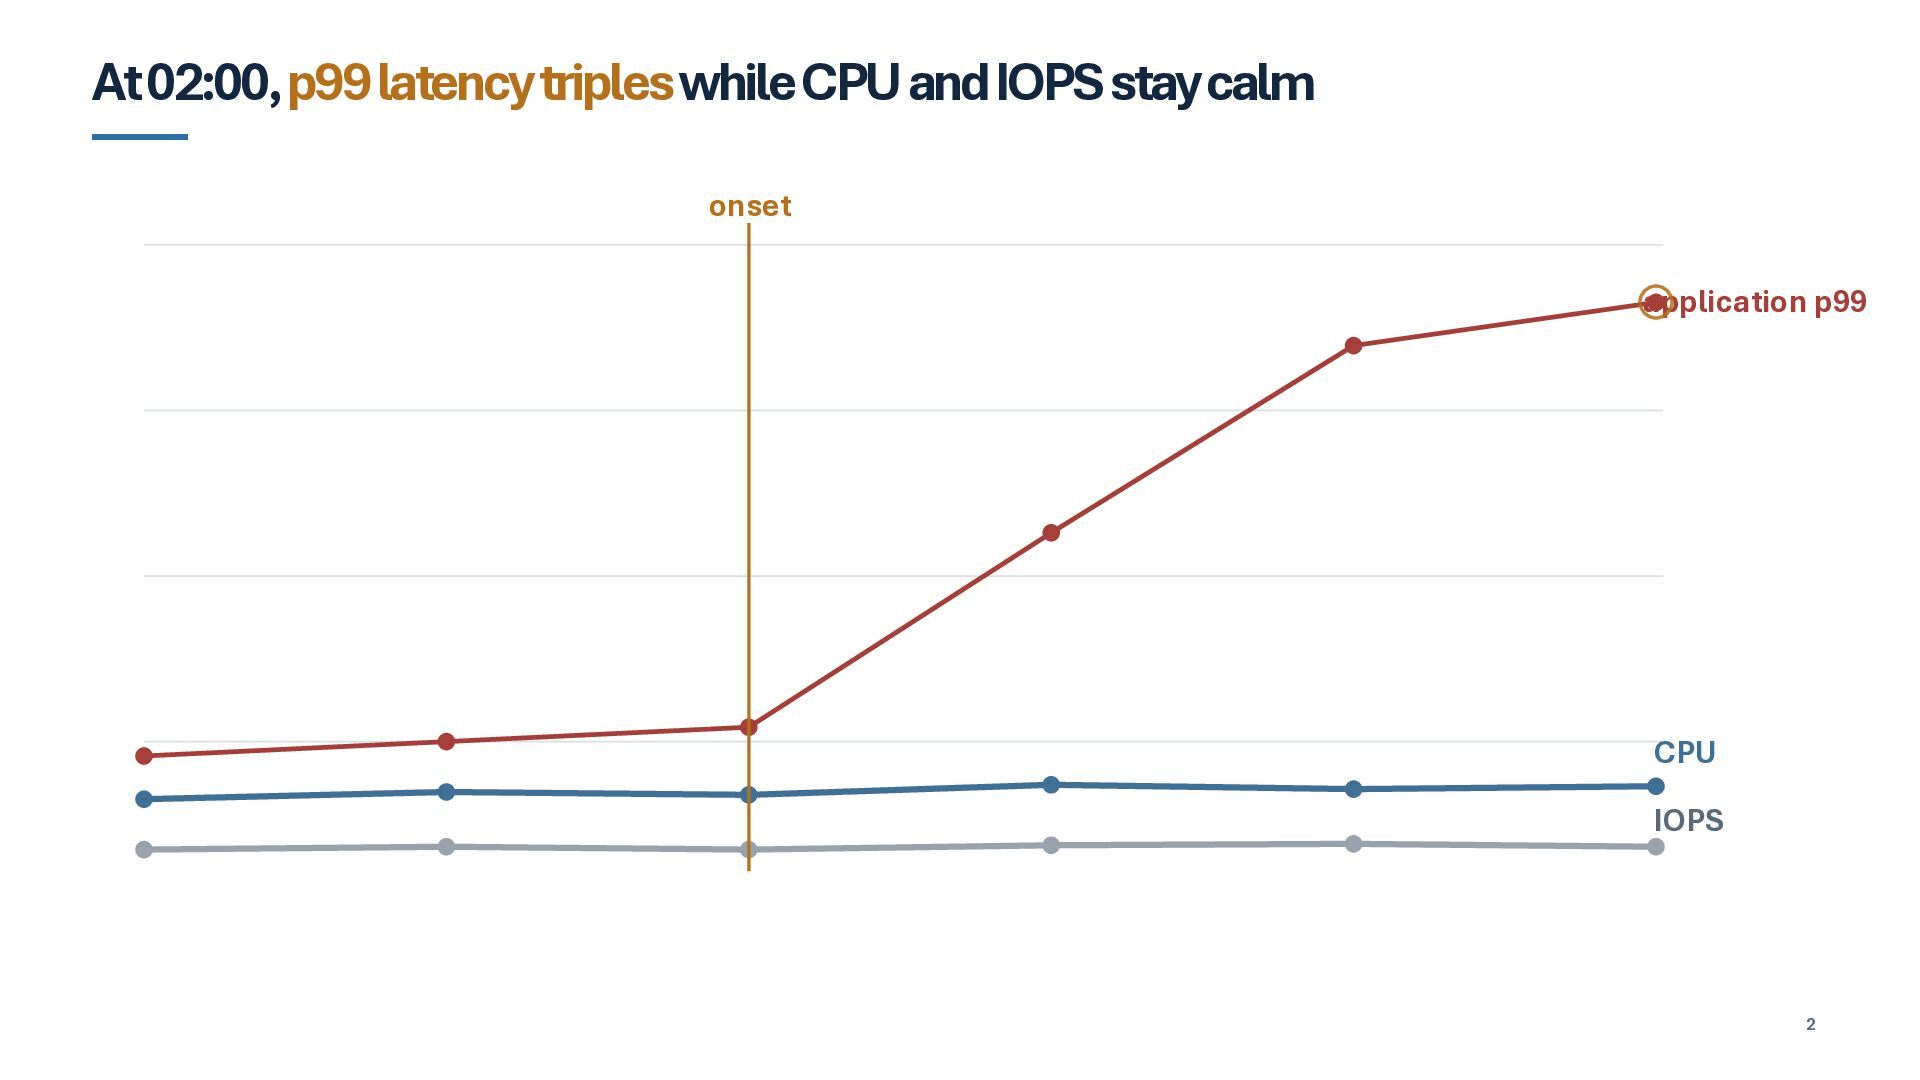
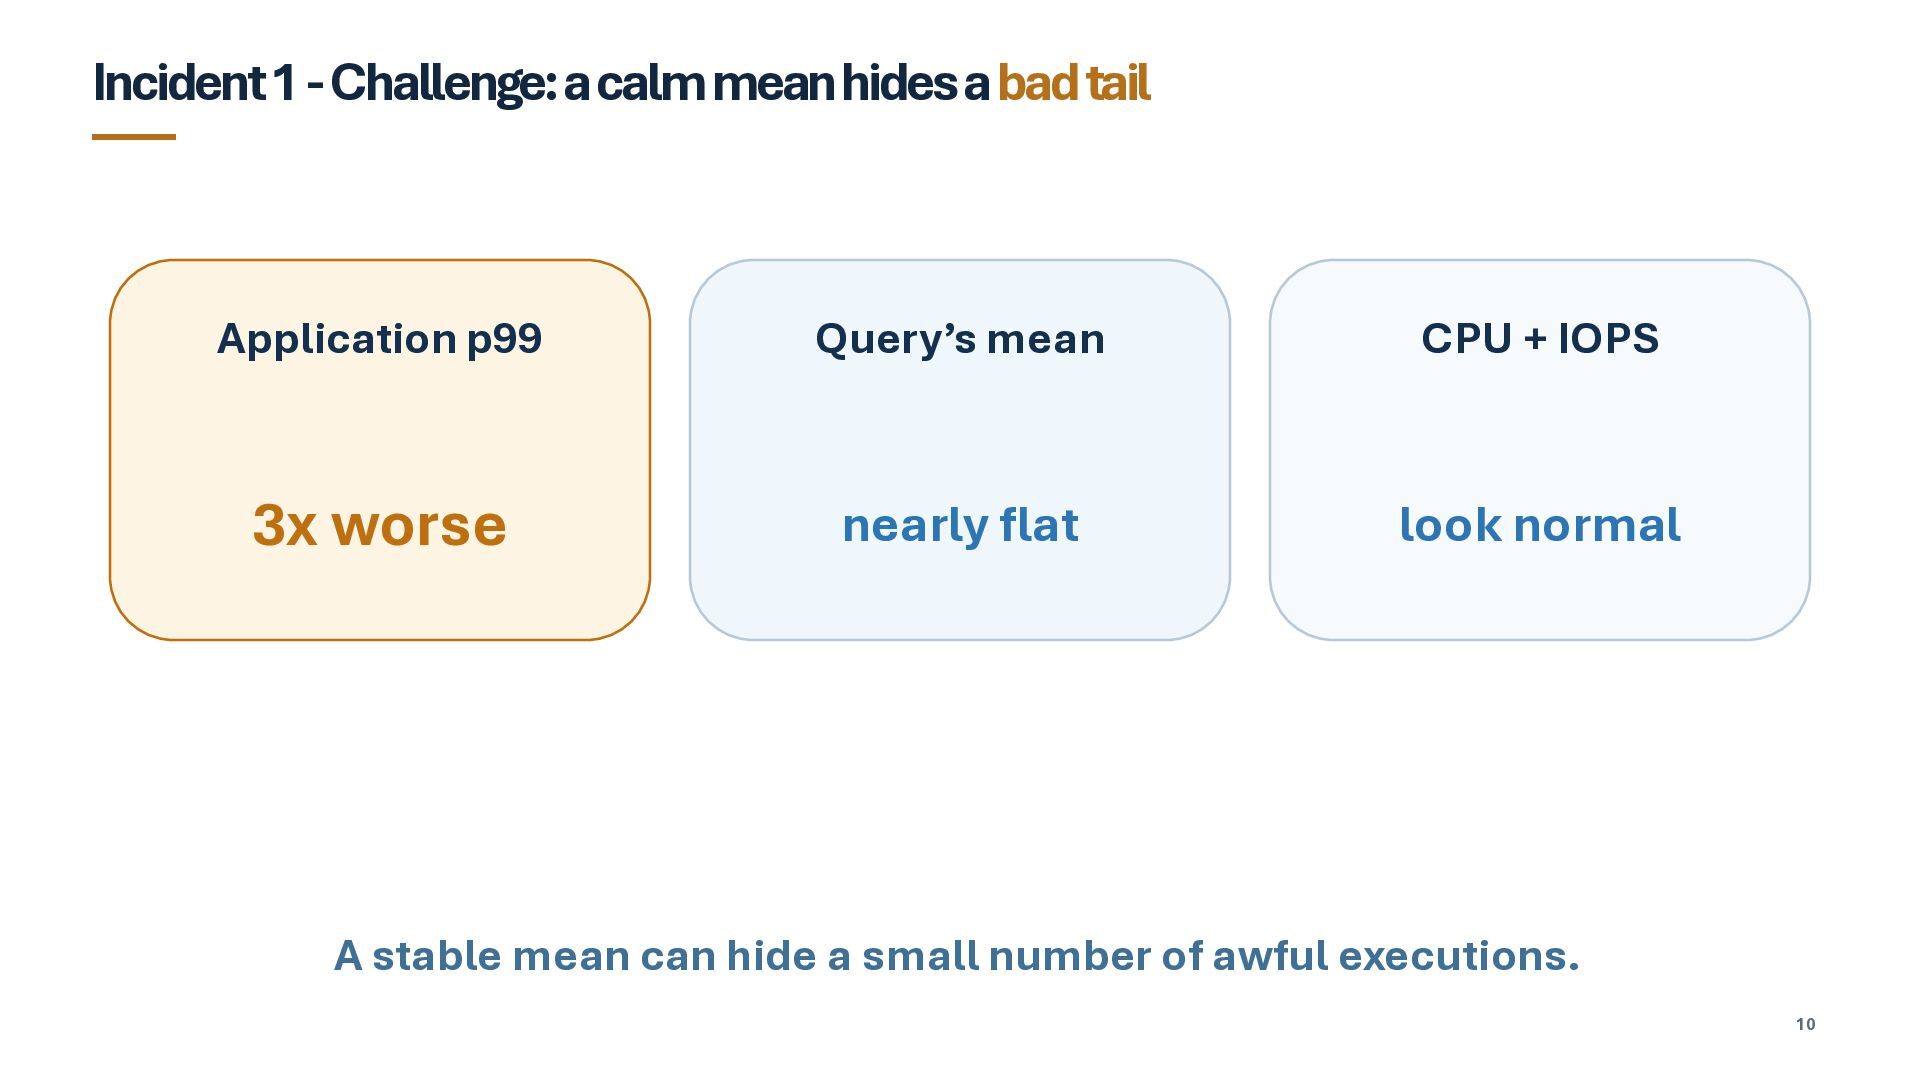
  9. Incident 1 -Challenge: a calm mean hides a bad tail

    Application p99 Query’s mean CPU + IOPS 3x worse nearly flat look normal A stable mean can hide a small number of awful executions. 10
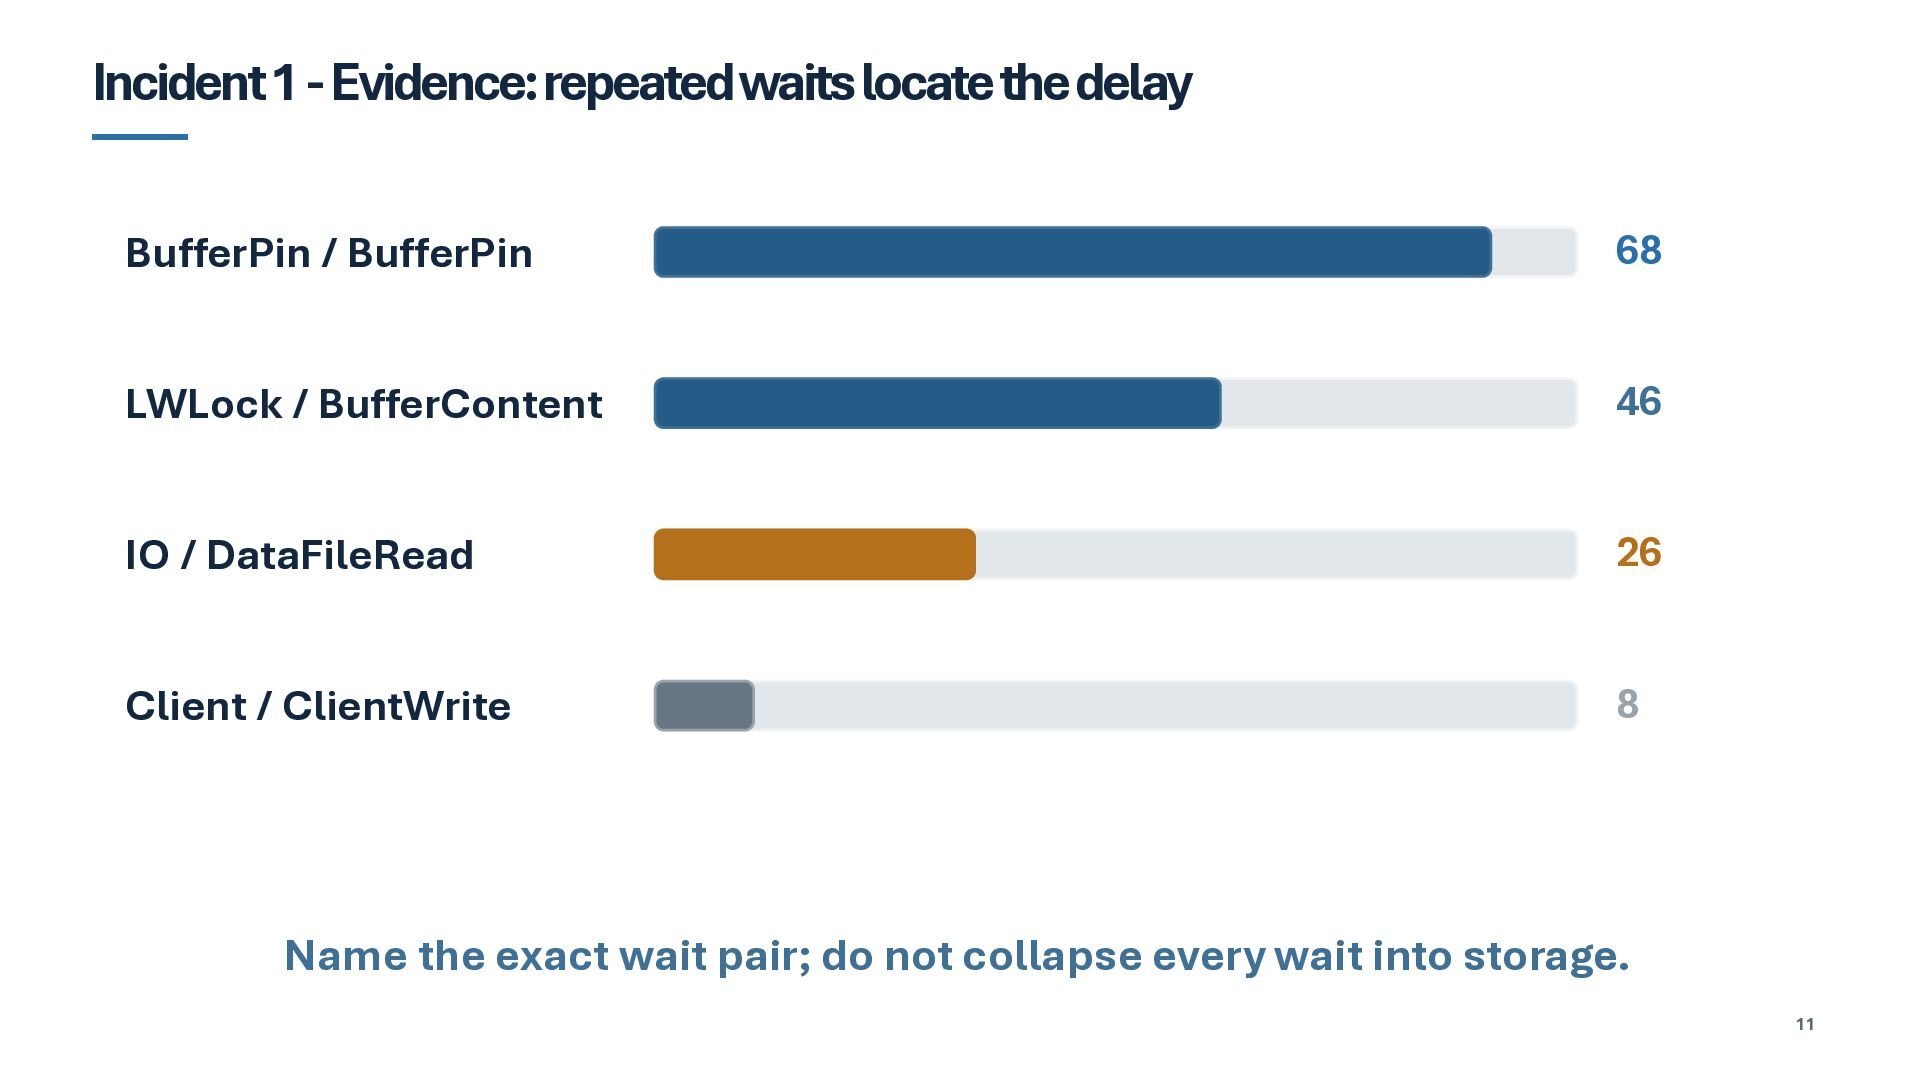
  10. Incident 1 -Evidence: repeated waits locate the delay BufferPin /

    BufferPin 68 LWLock / BufferContent 46 IO / DataFileRead 26 Client / ClientWrite 8 Name the exact wait pair; do not collapse every wait into storage. 11
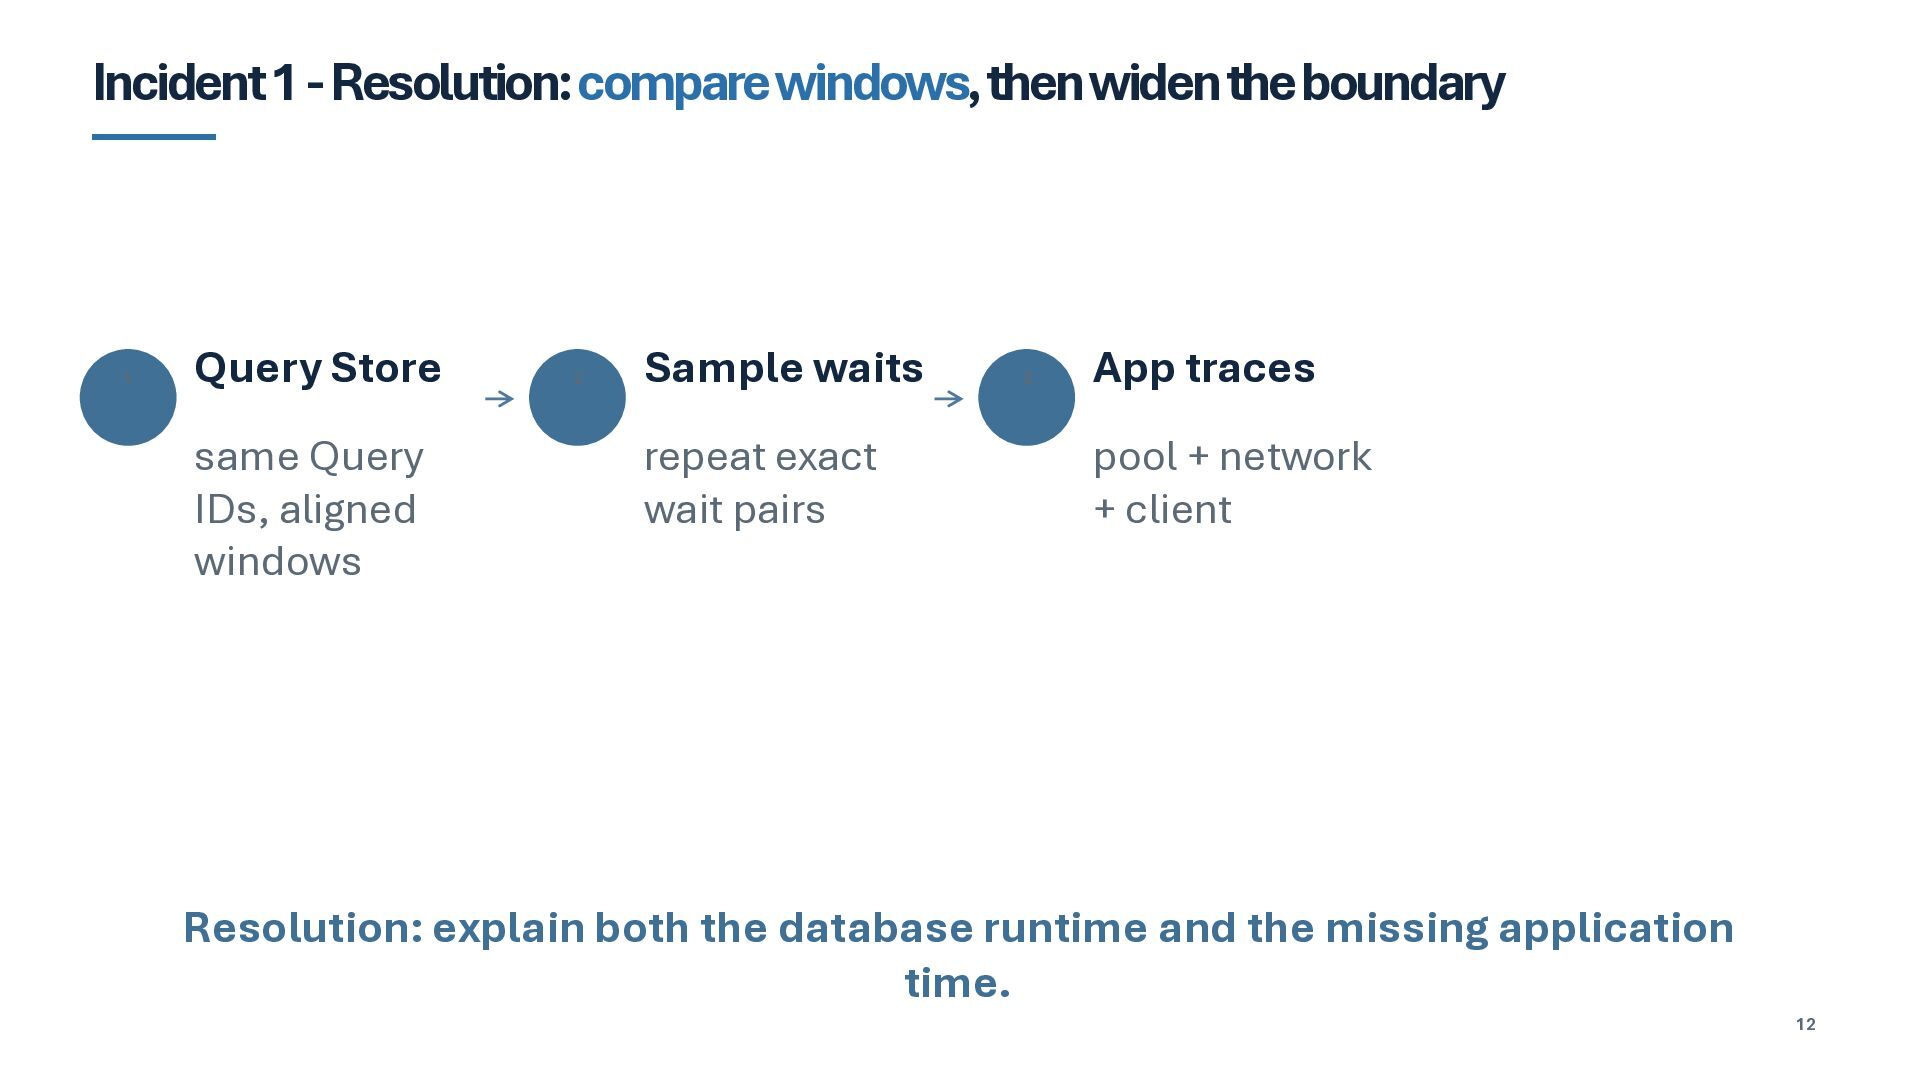
  11. Incident 1 -Resolution: compare windows, then widen the boundary 1

    Query Store same Query IDs, aligned windows 2 Sample waits repeat exact wait pairs 3 App traces pool + network + client Resolution: explain both the database runtime and the missing application time. 12
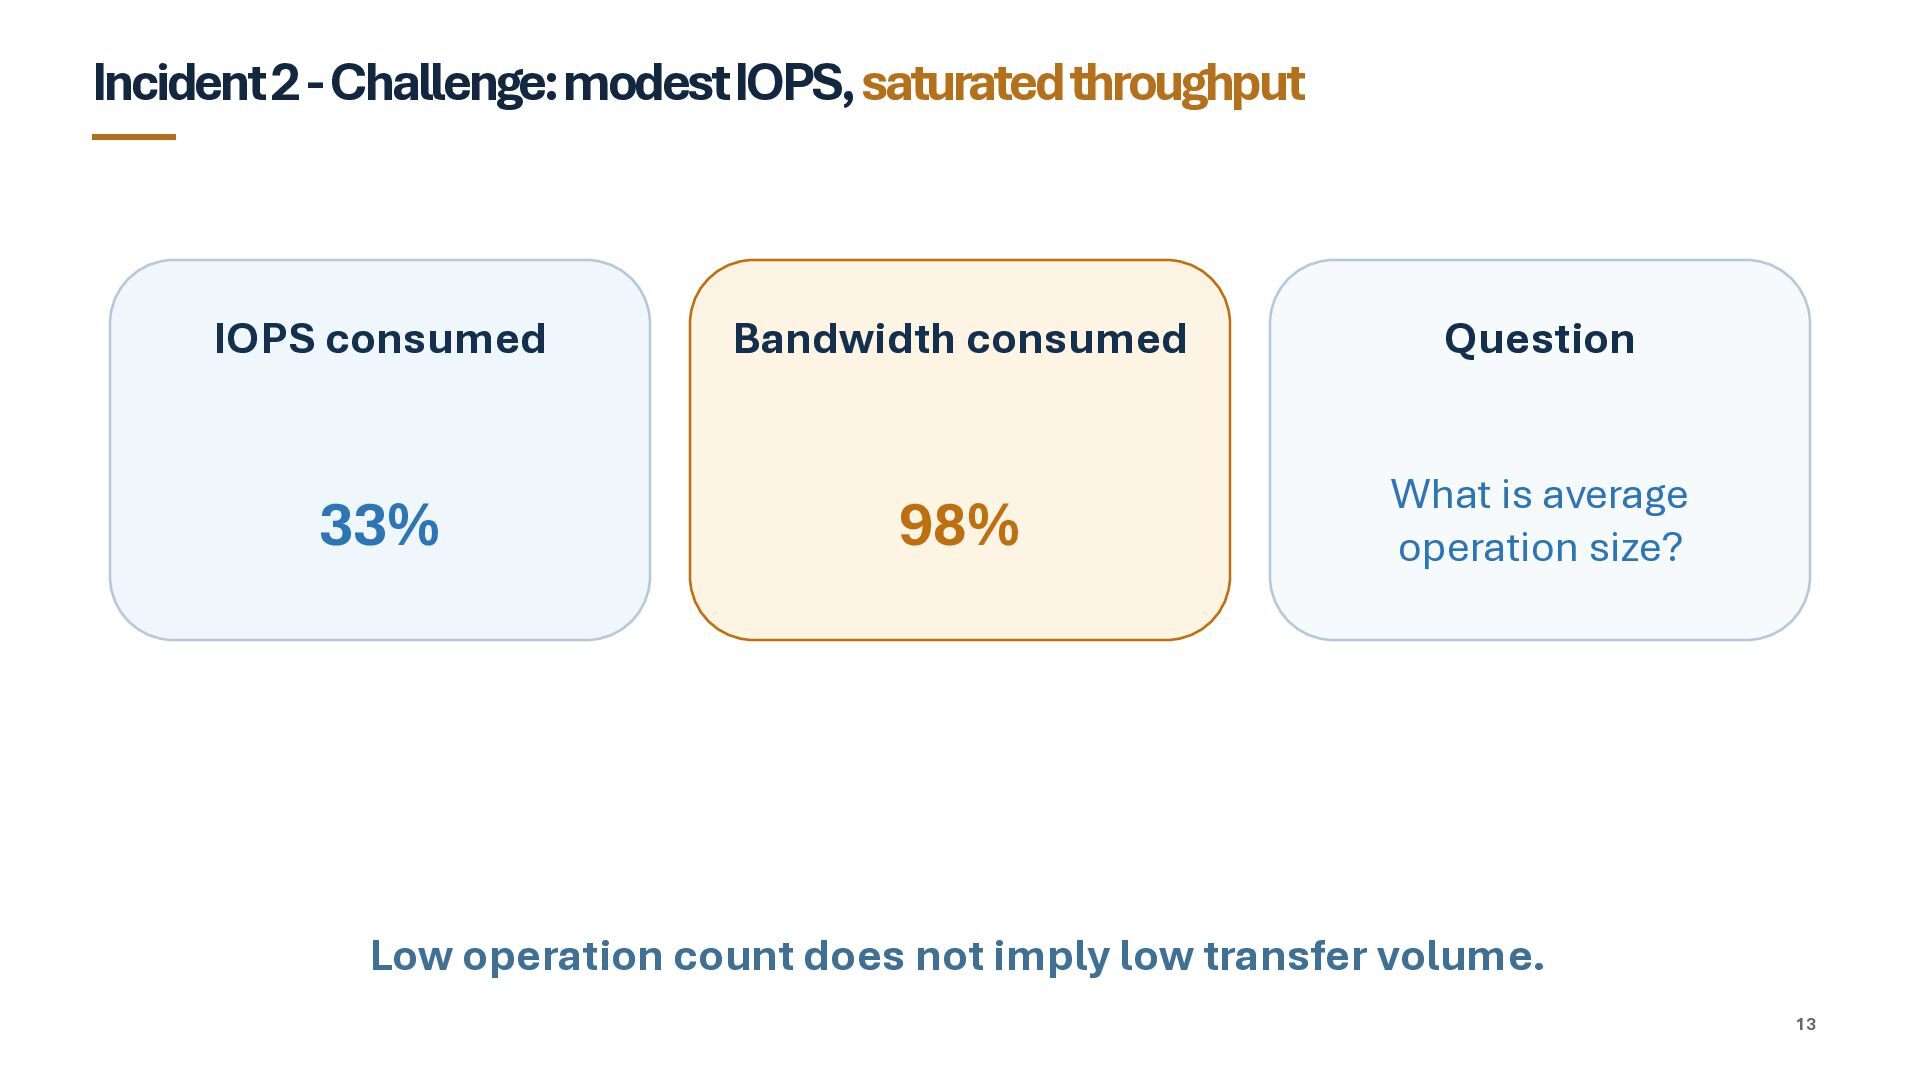
  12. Incident 2 -Challenge: modest IOPS, saturated throughput IOPS consumed 33%

    Bandwidth consumed Question 98% What is average operation size? Low operation count does not imply low transfer volume. 13
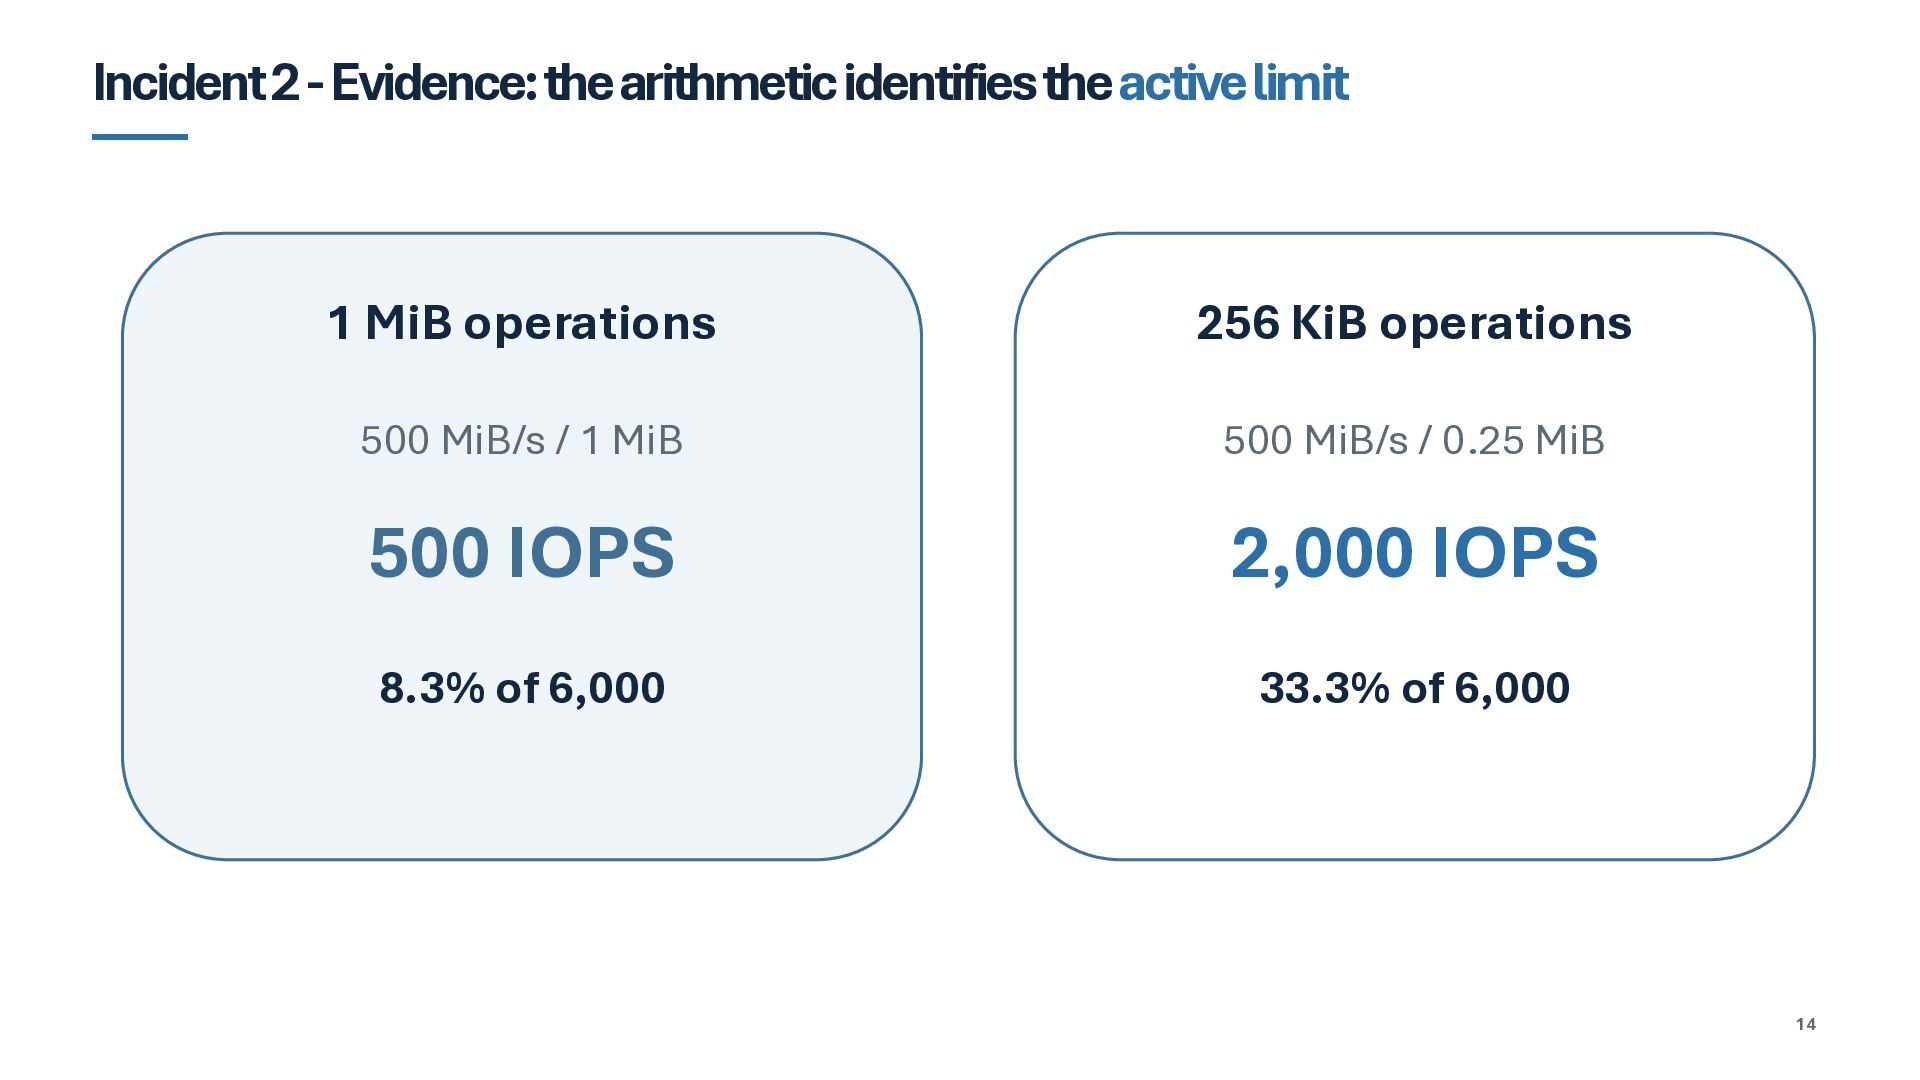
  13. Incident 2 -Evidence: the arithmetic identifies the active limit 1

    MiB operations 256 KiB operations 500 MiB/s / 1 MiB 500 MiB/s / 0.25 MiB 500 IOPS 2,000 IOPS 8.3% of 6,000 33.3% of 6,000 14
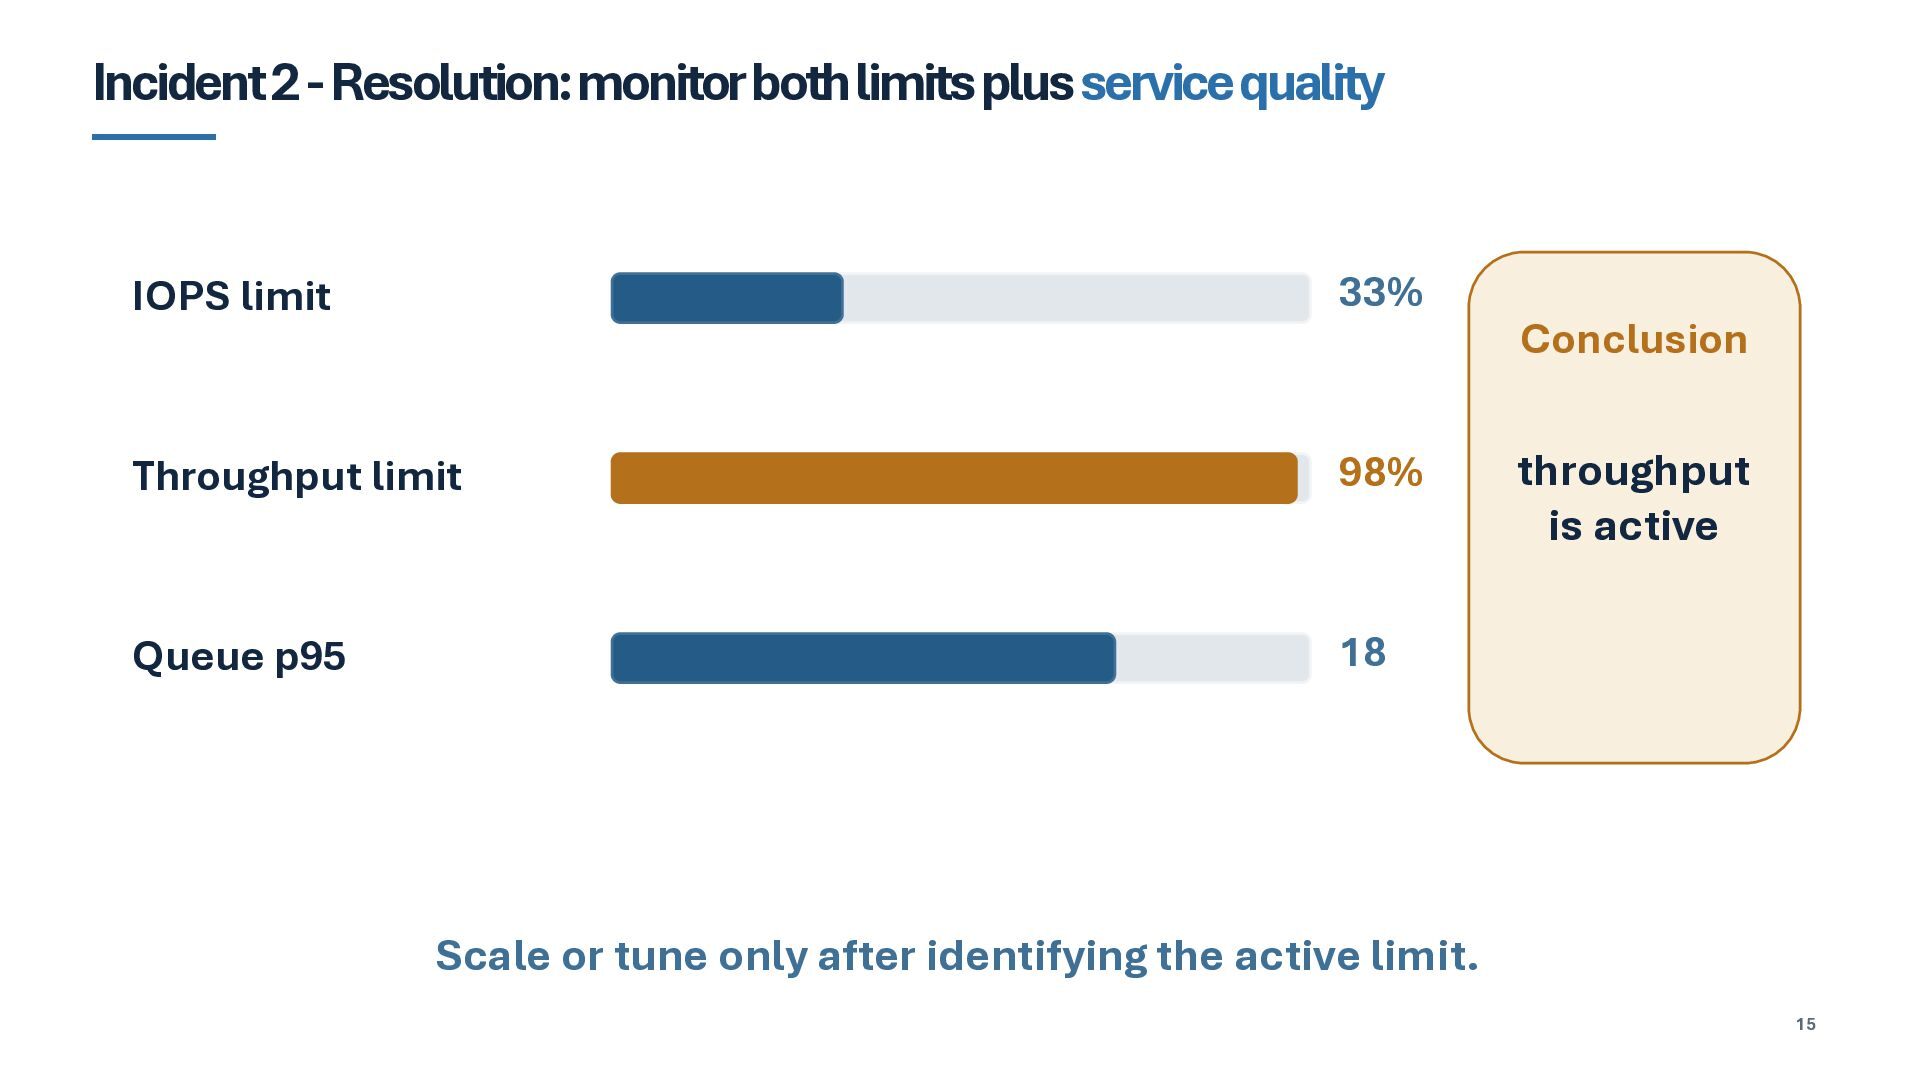
  14. Incident 2 -Resolution: monitor both limits plus service quality IOPS

    limit 33% Throughput limit 98% Queue p95 18 Conclusion throughput is active Scale or tune only after identifying the active limit. 15
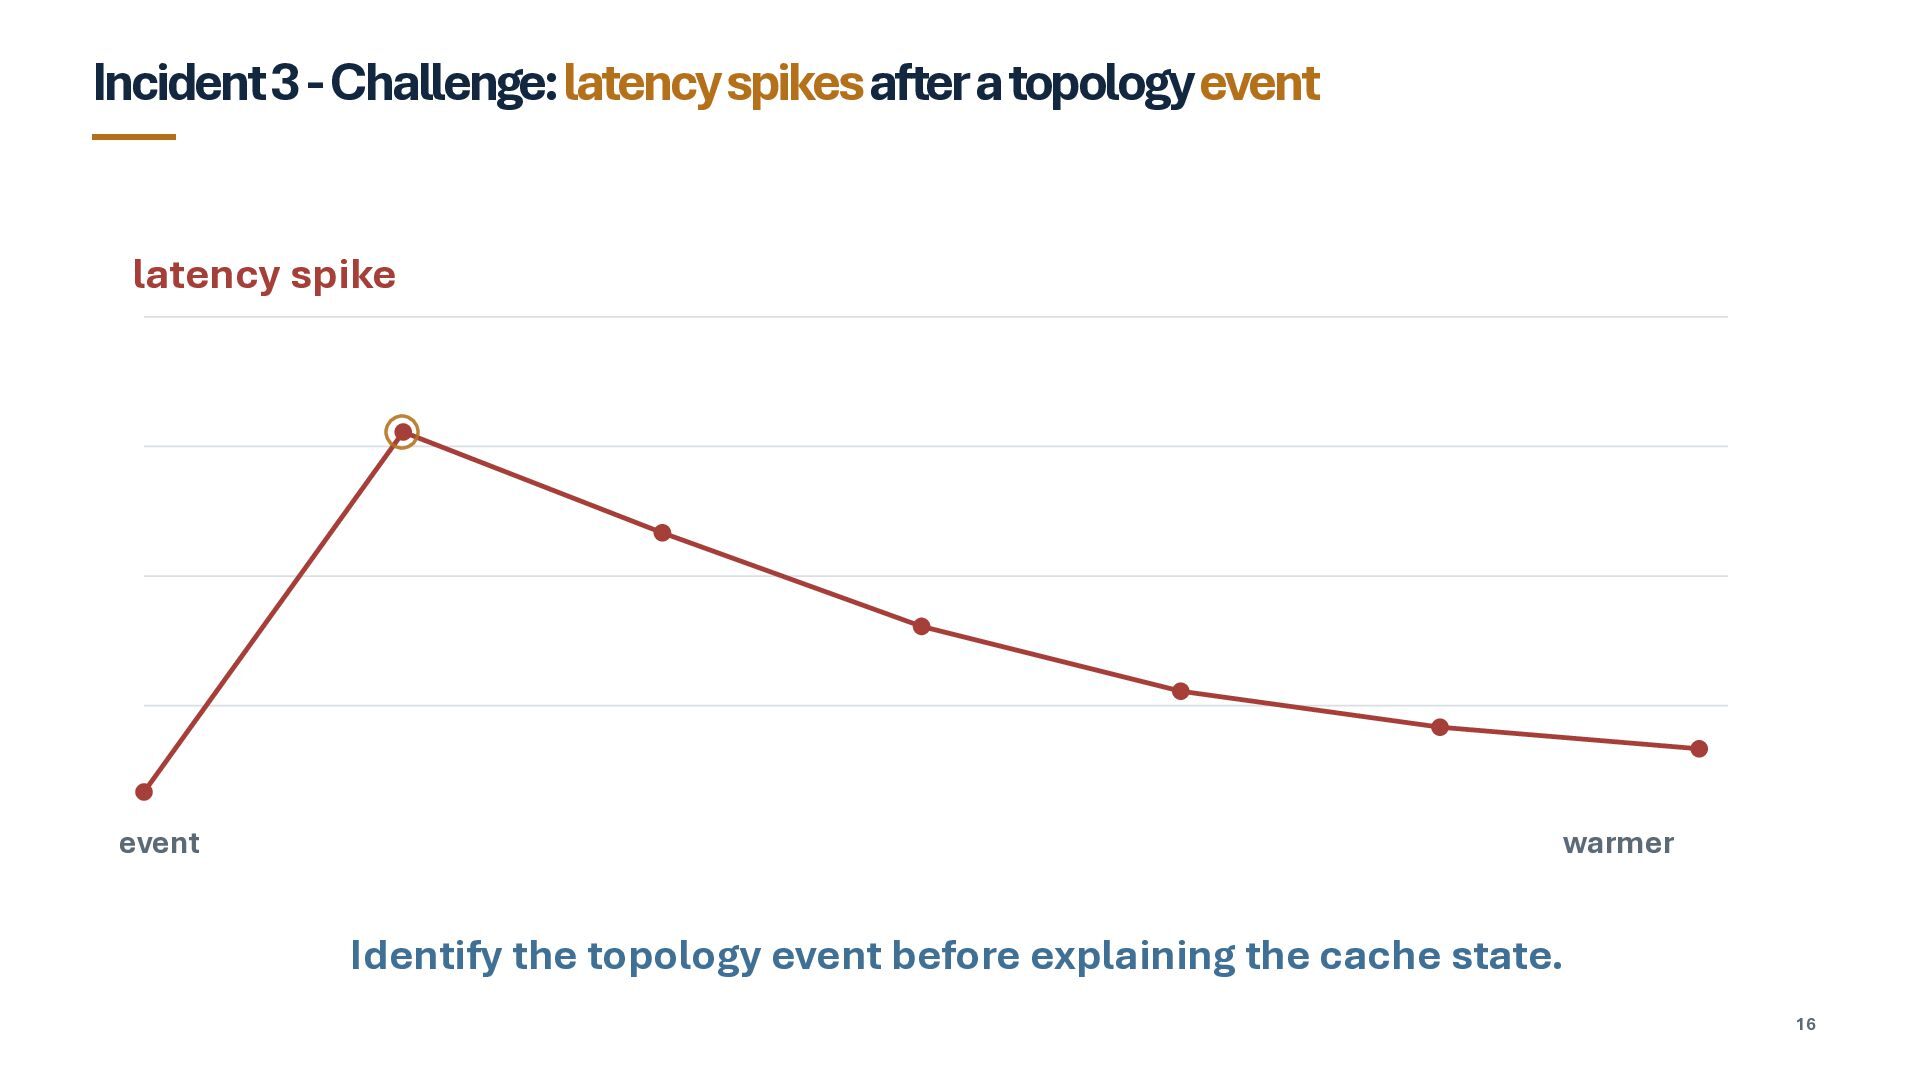
  15. Incident 3 -Challenge: latency spikesafter a topology event latency spike

    event warmer Identify the topology event before explaining the cache state. 16
  16. Incident 3 -Evidence: same-host restart differs from failover Same host

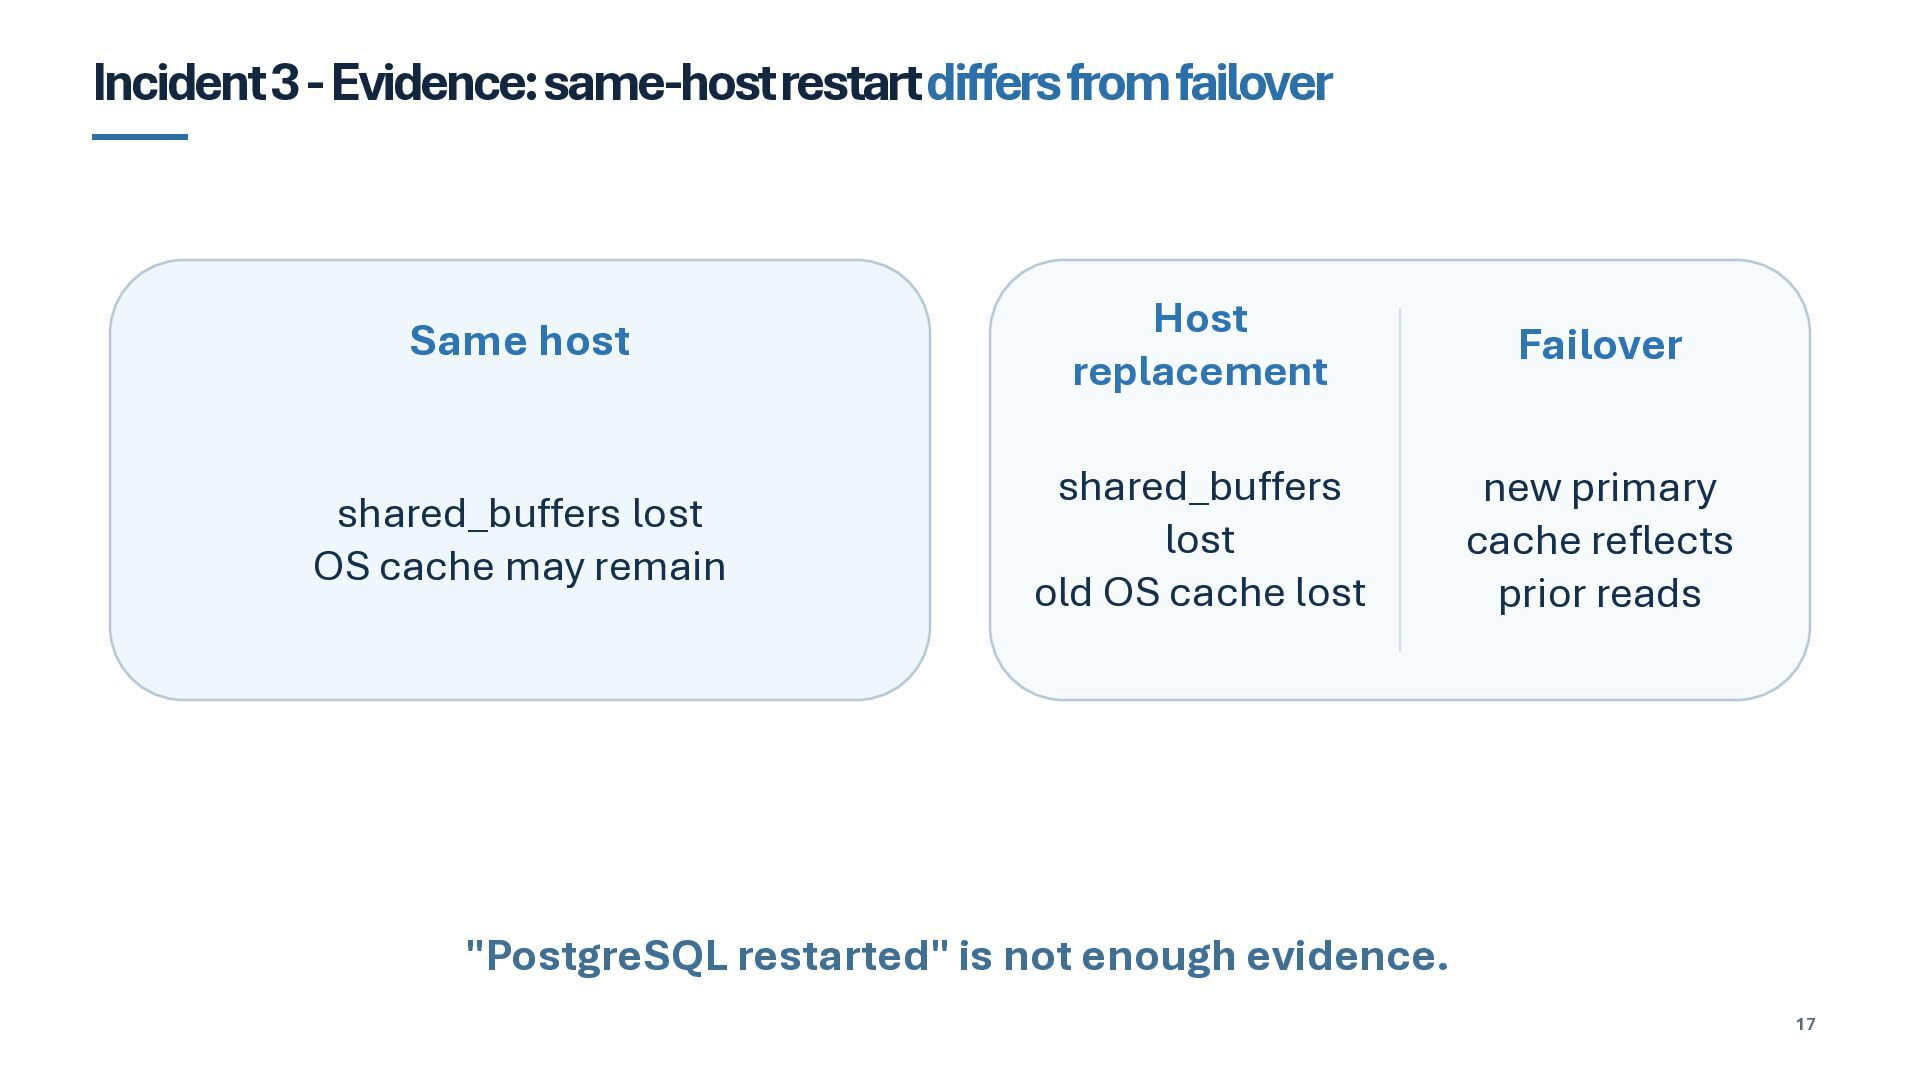
    Host replacement Failover shared_buffers lost OS cache may remain shared_buffers lost old OS cache lost new primary cache reflects prior reads "PostgreSQL restarted" is not enough evidence. 17
  17. Incident 3 -Resolution: prewarma bounded set, then gate traffic 1

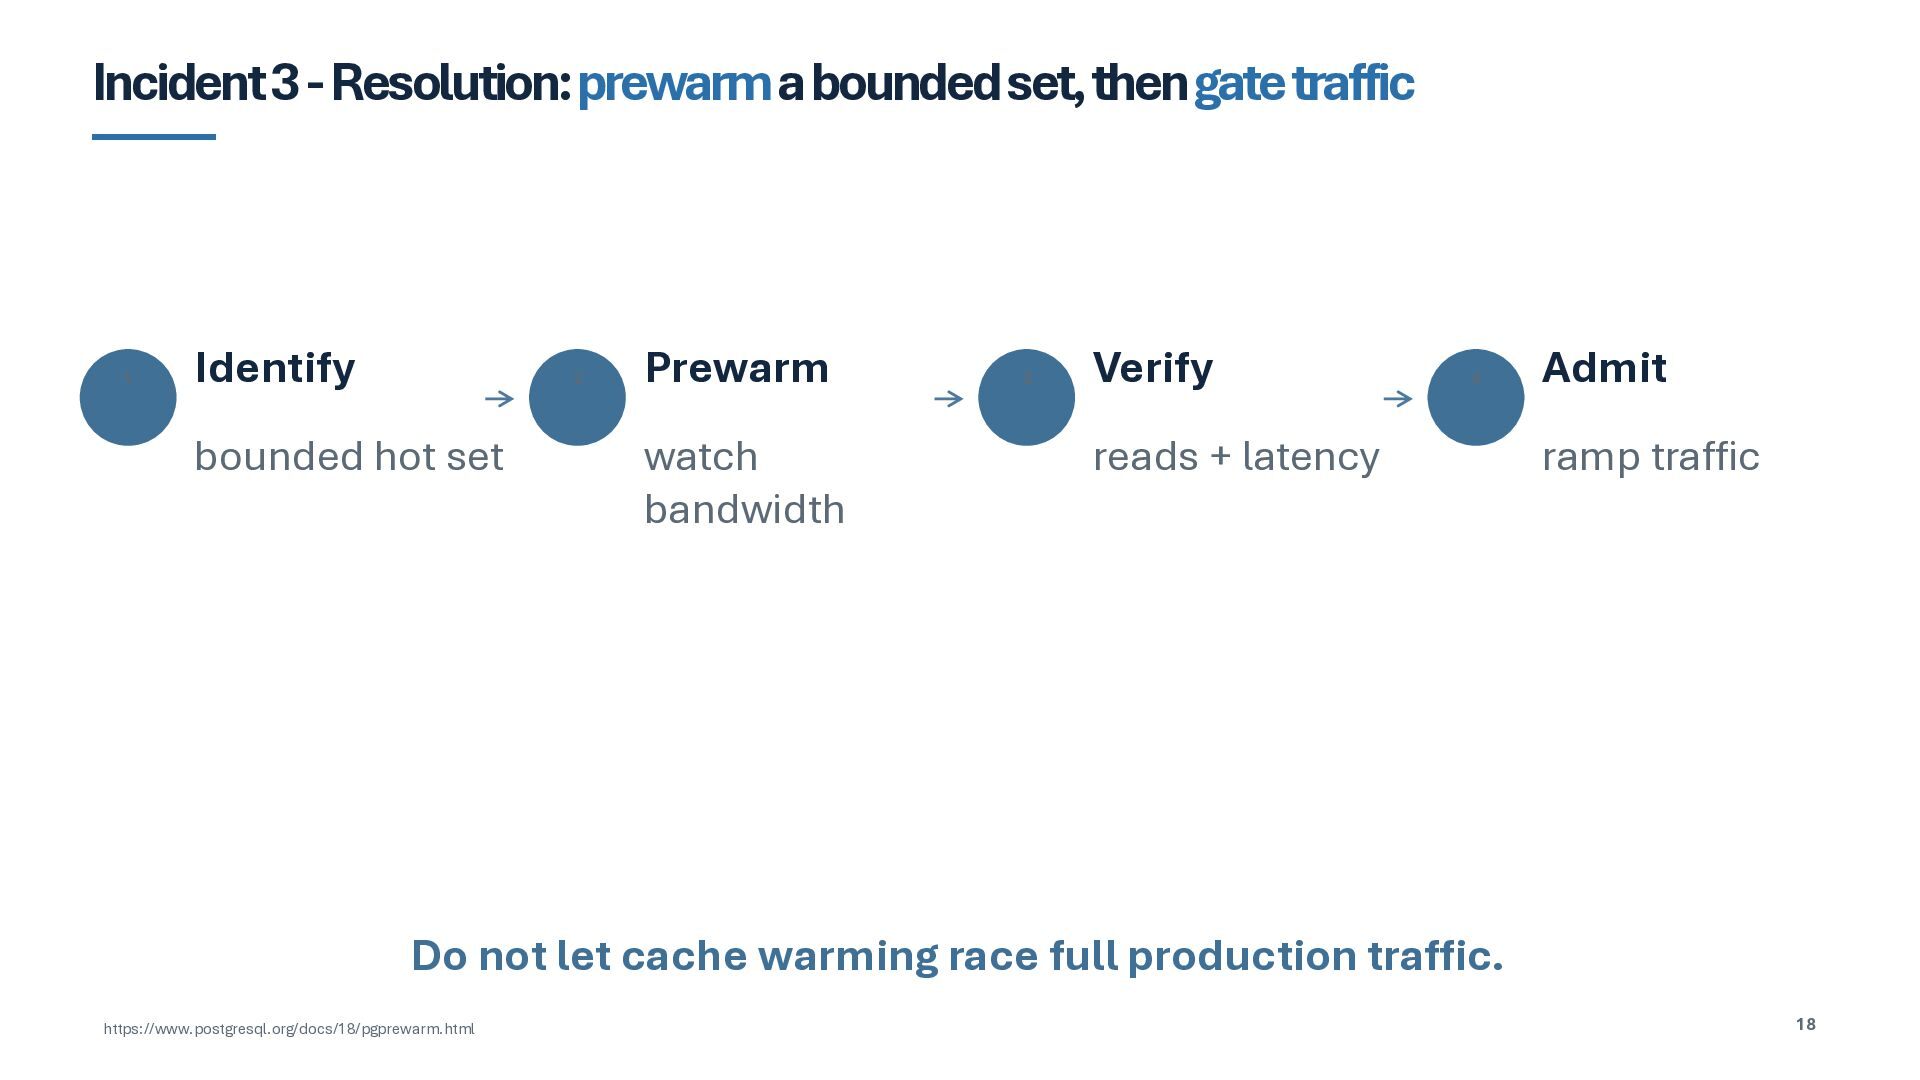
    Identify 2 bounded hot set Prewarm watch bandwidth 3 Verify 4 reads + latency Admit ramp traffic Do not let cache warming race full production traffic. https://www.postgresql.org/docs/18/pgprewarm.html 18
  18. Incident 4 — Increasing shared_buffers did not reduce p99 latency

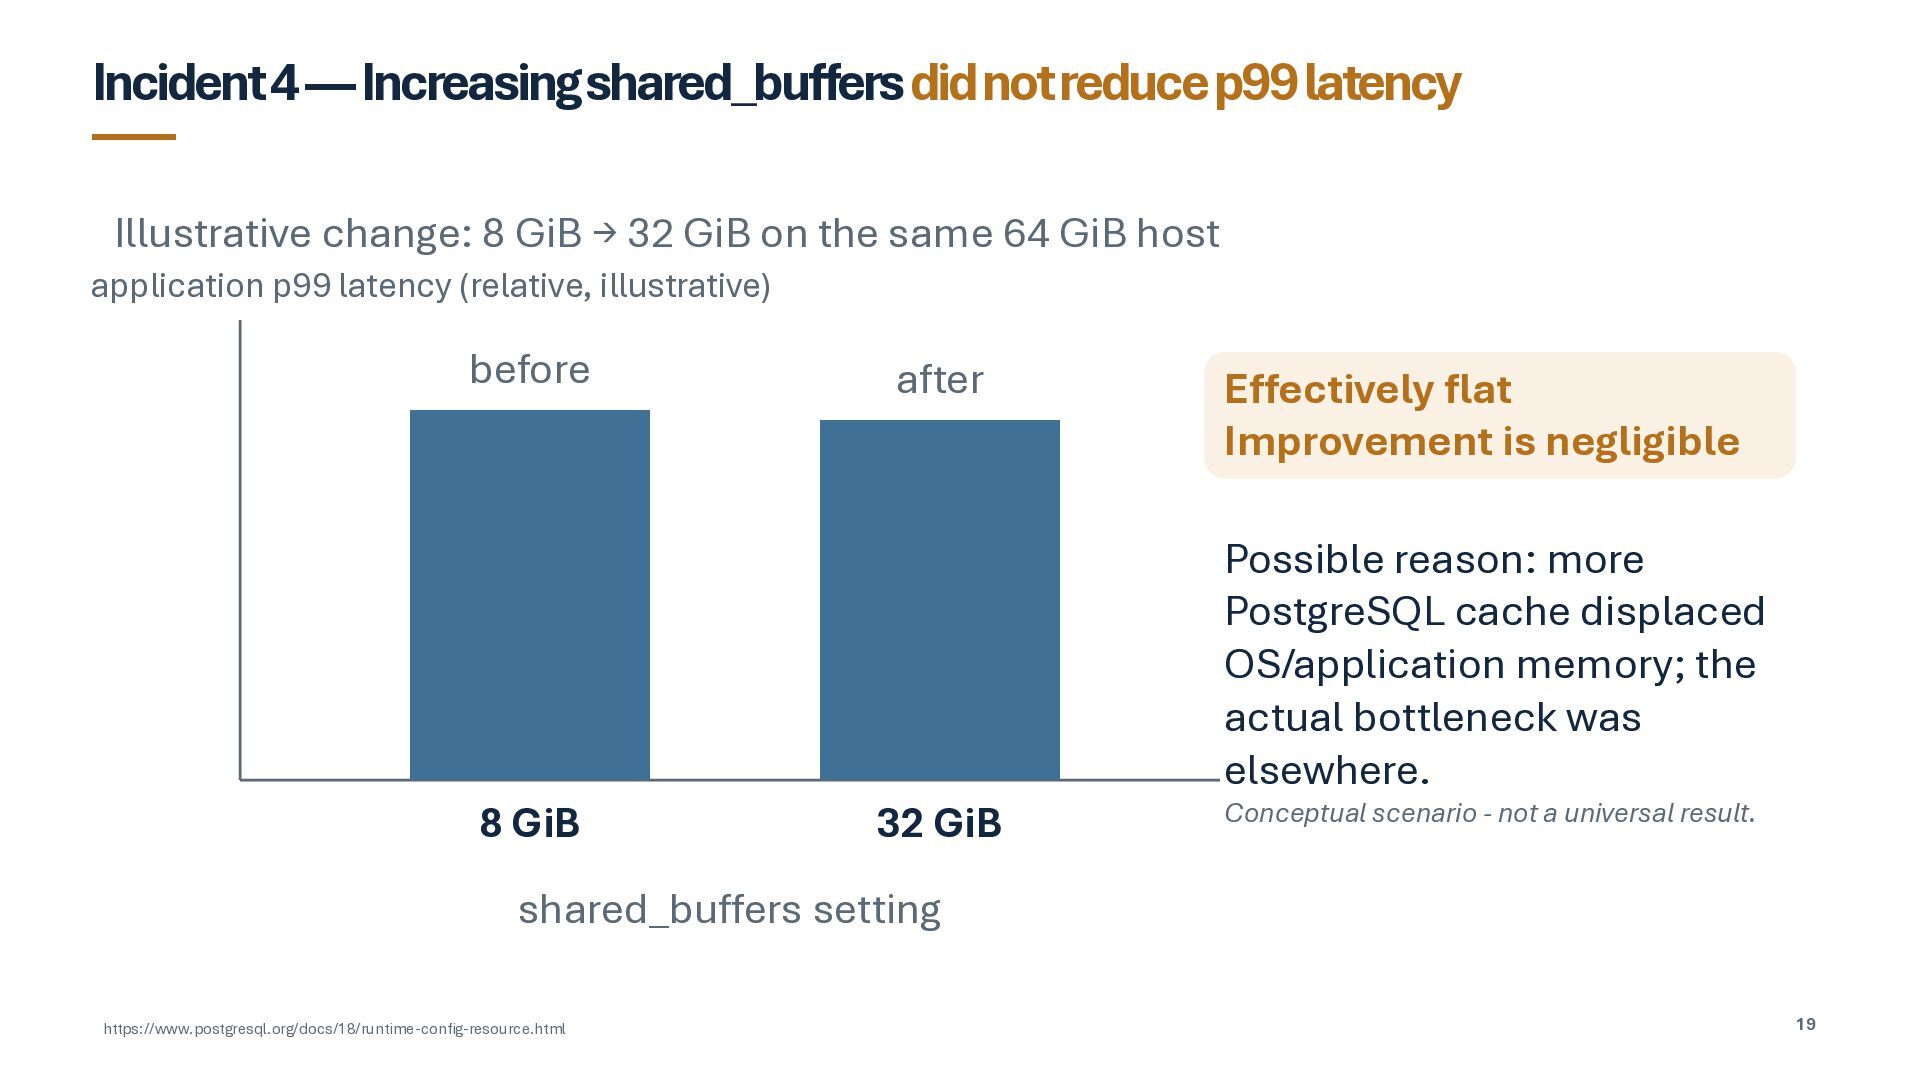
    Illustrative change: 8 GiB → 32 GiB on the same 64 GiB host application p99 latency (relative, illustrative) before 8 GiB after 32 GiB Effectively flat Improvement is negligible Possible reason: more PostgreSQL cache displaced OS/application memory; the actual bottleneck was elsewhere. Conceptual scenario - not a universal result. shared_buffers setting https://www.postgresql.org/docs/18/runtime-config-resource.html 19
  19. Incident 4 -Resolution: size by repeated measurement 1 Snapshot 2

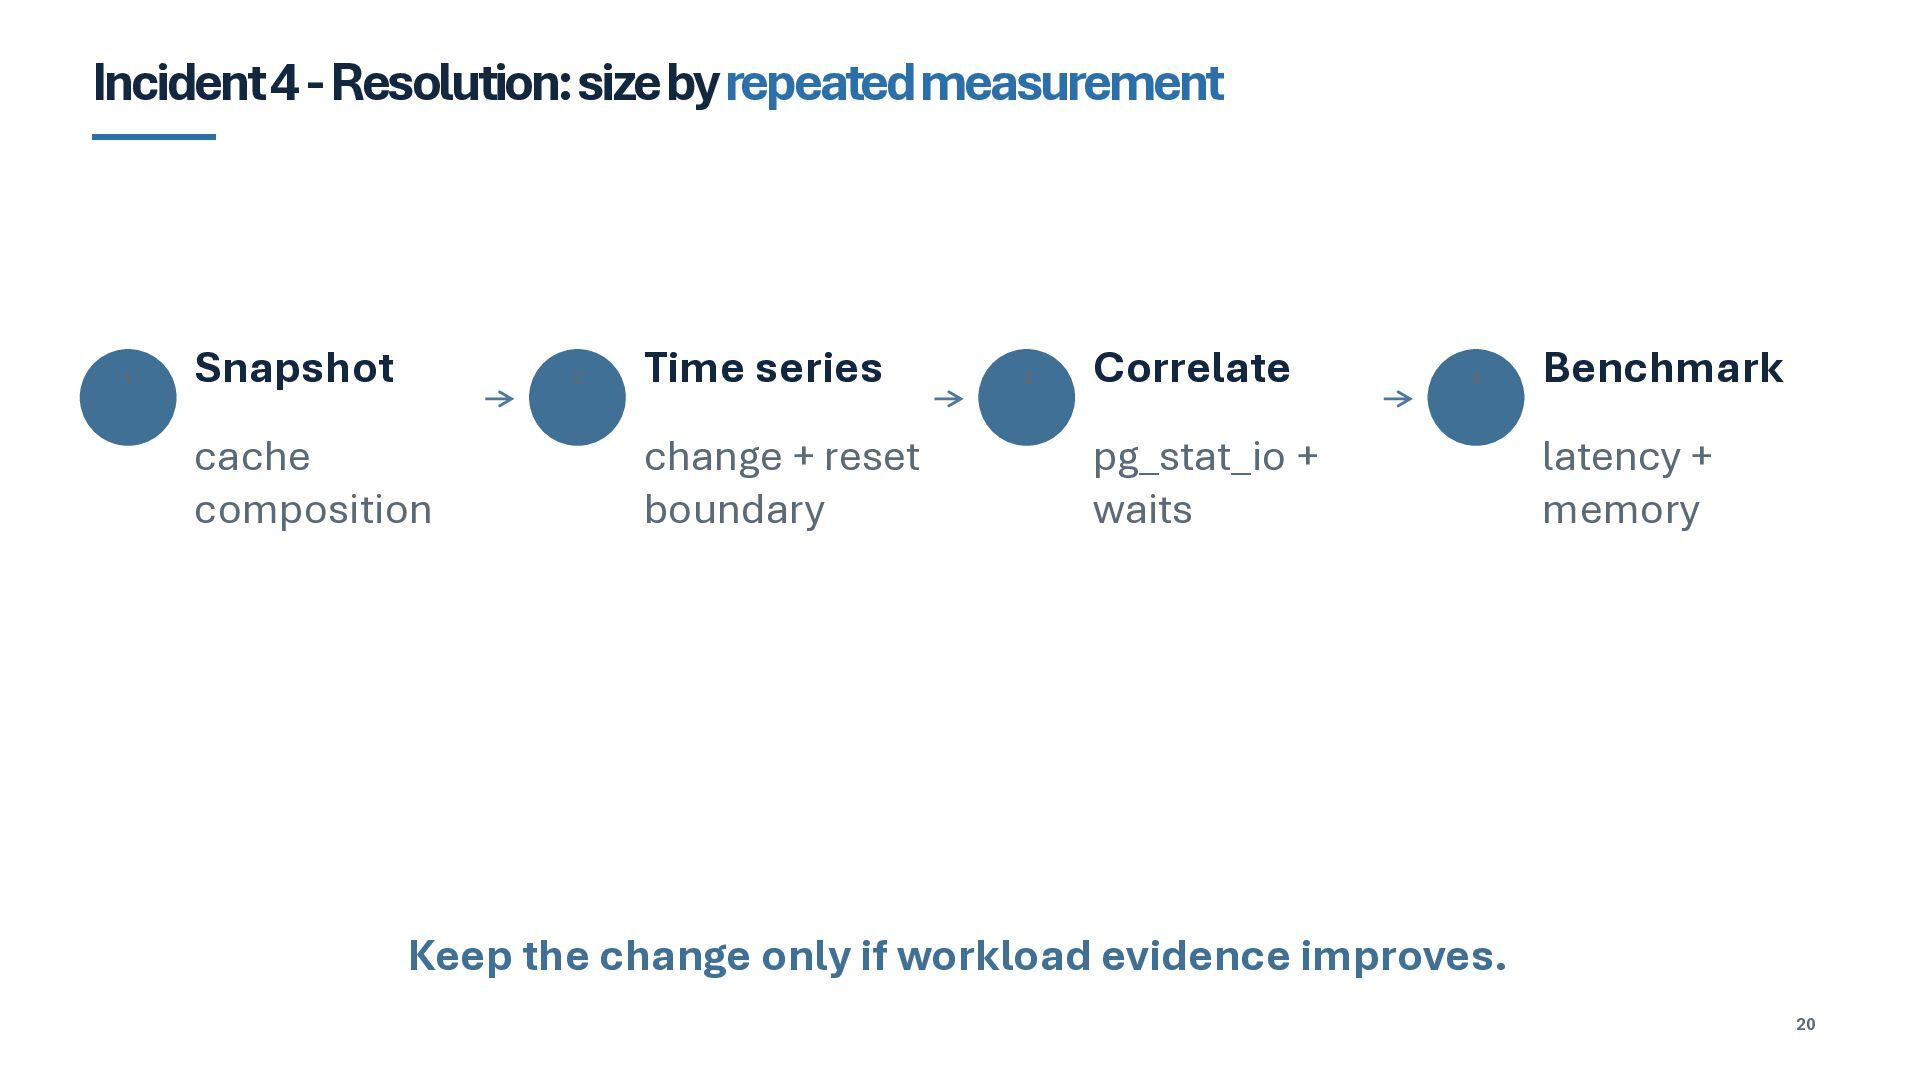
    cache composition Time series change + reset boundary 3 Correlate 4 pg_stat_io + waits Benchmark latency + memory Keep the change only if workload evidence improves. 20
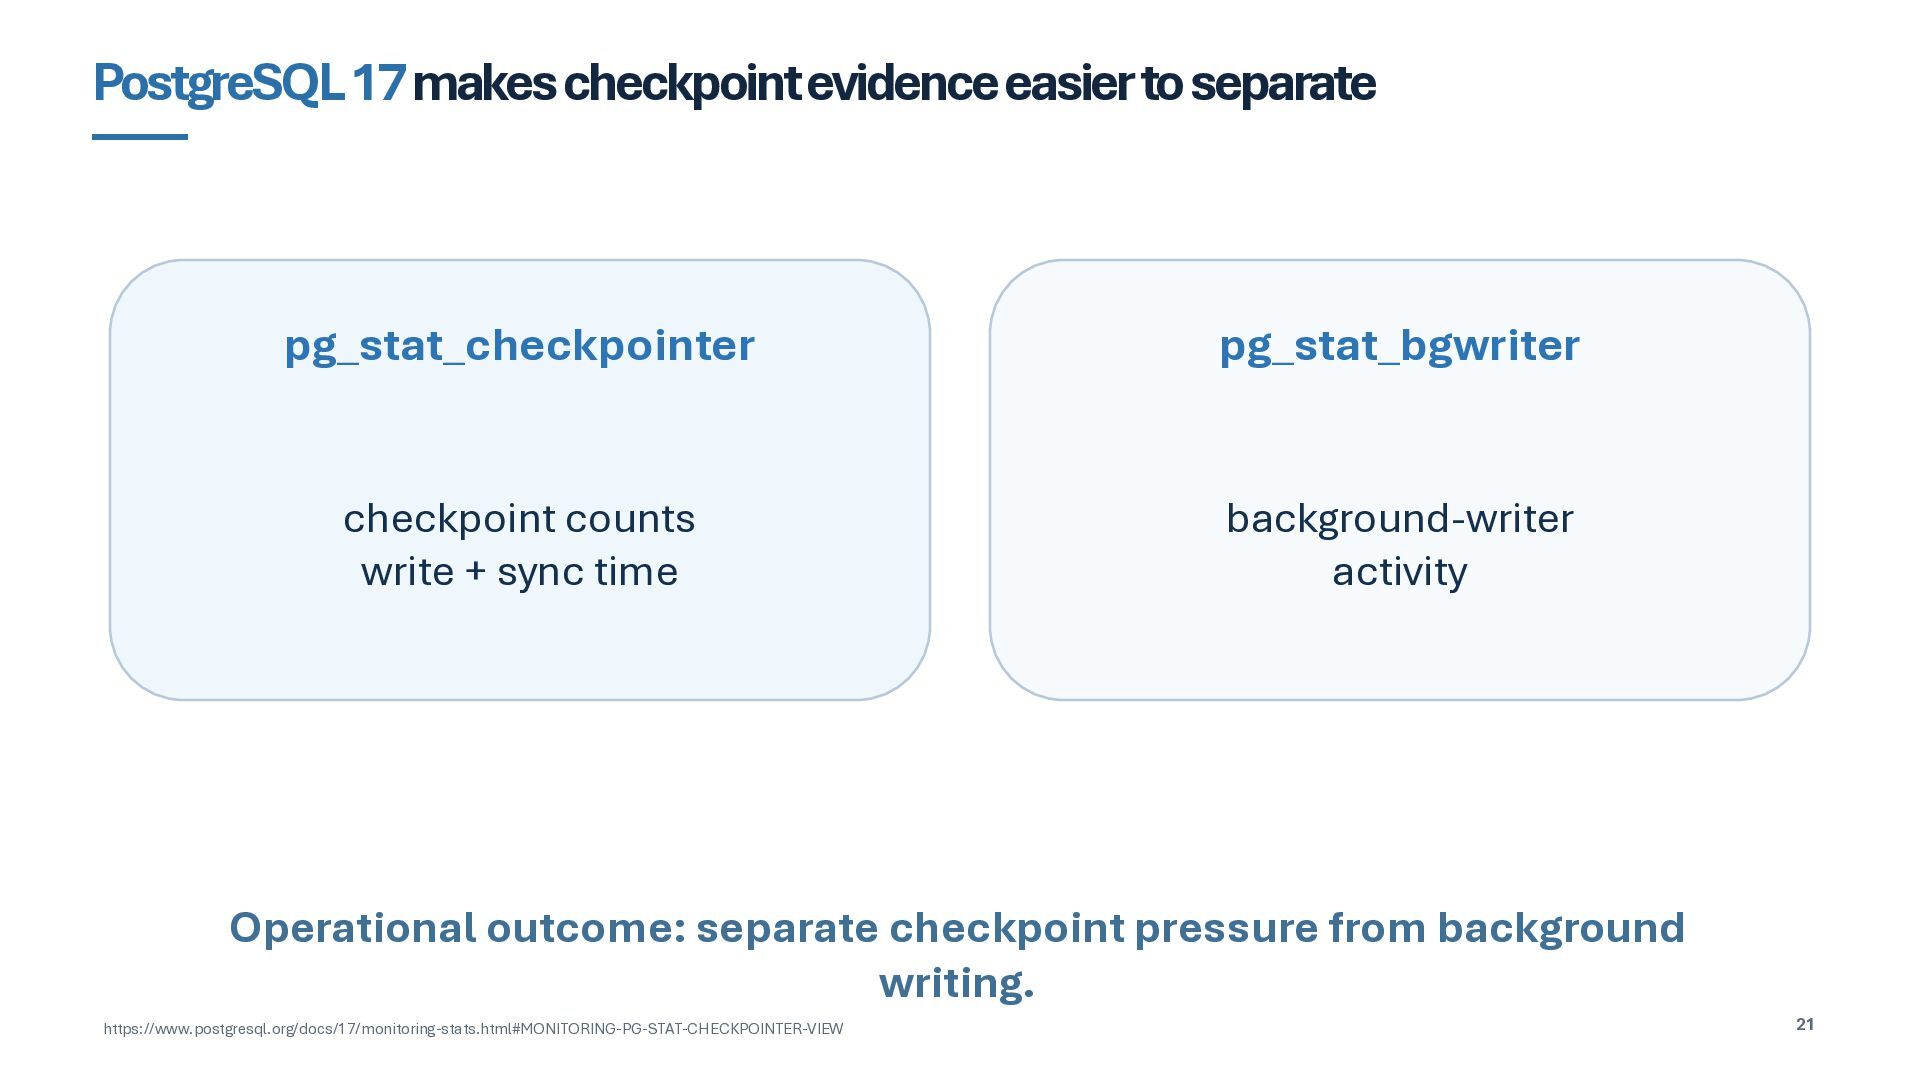
  20. PostgreSQL 17makes checkpoint evidence easier to separate pg_stat_checkpointer pg_stat_bgwriter checkpoint

    counts write + sync time background-writer activity Operational outcome: separate checkpoint pressure from background writing. https://www.postgresql.org/docs/17/monitoring-stats.html#MONITORING-PG-STAT-CHECKPOINTER-VIEW 21
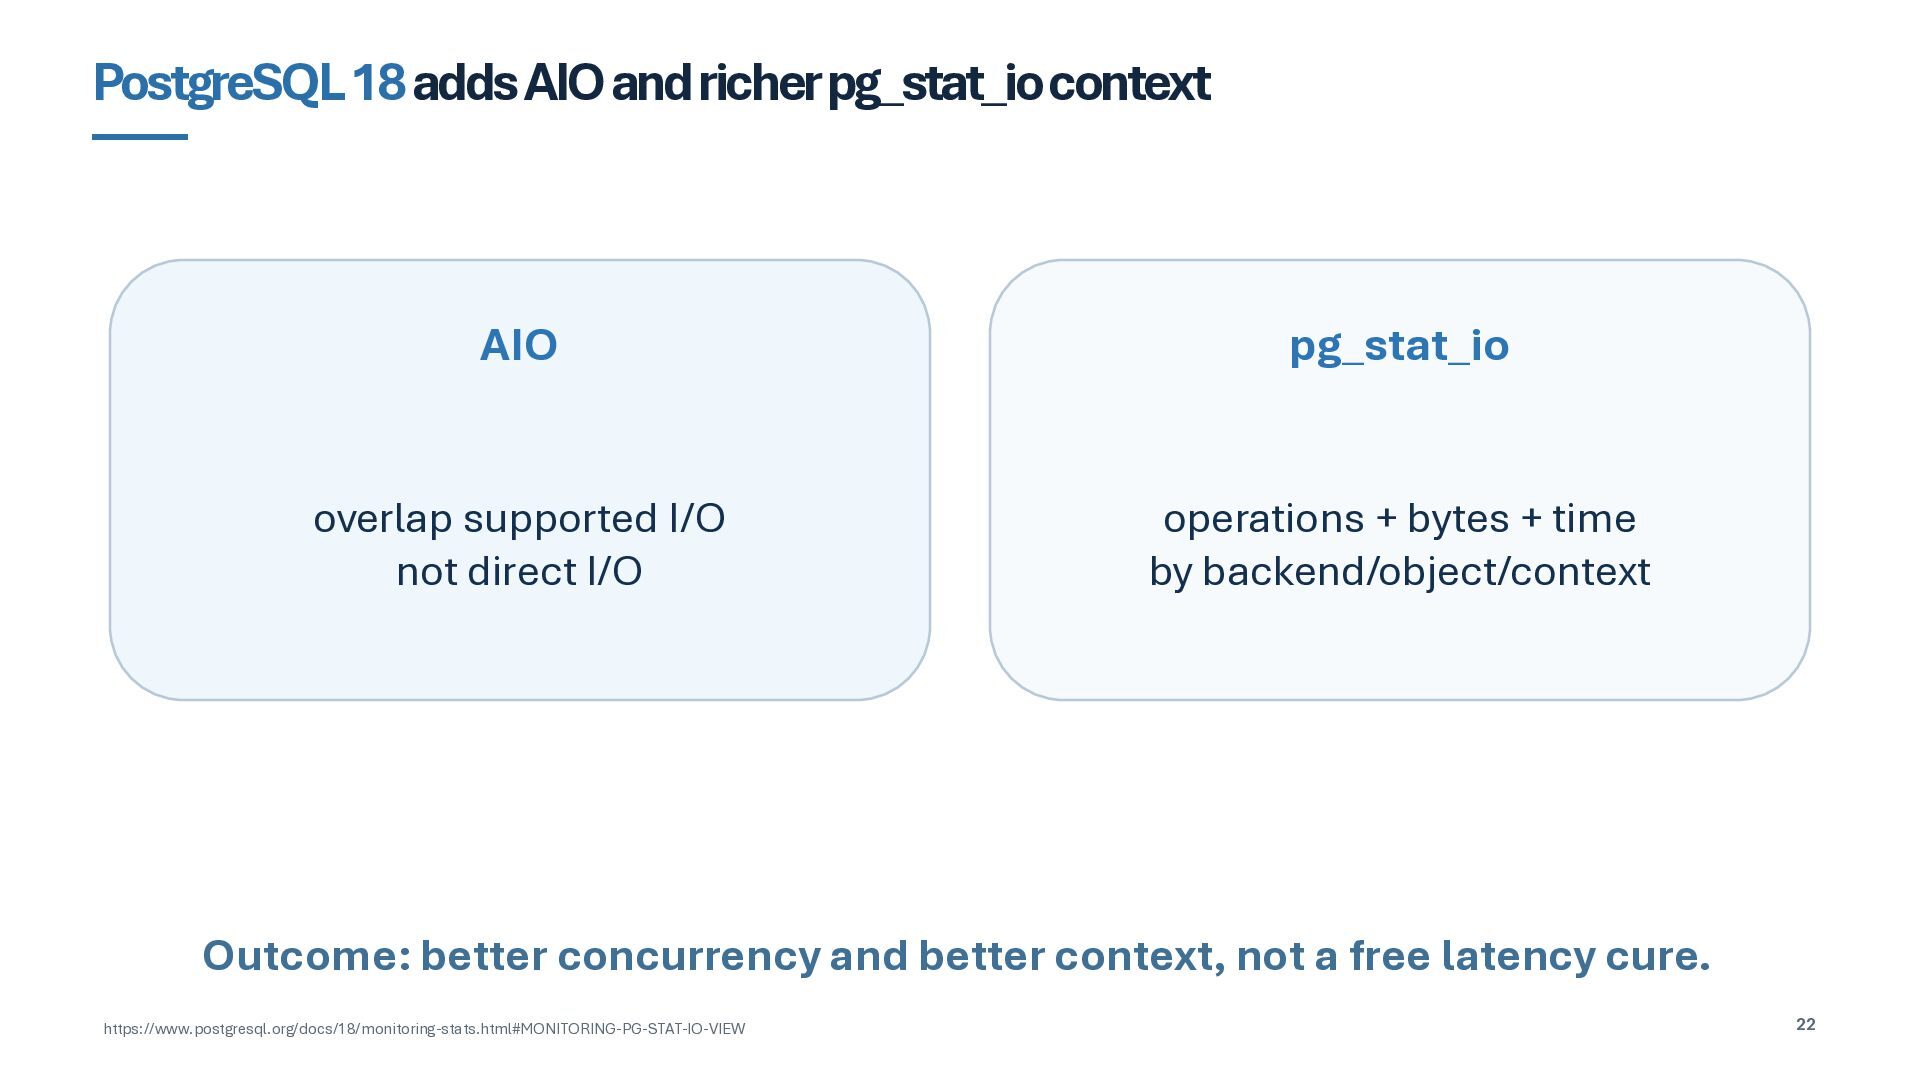
  21. PostgreSQL 18adds AIO and richer pg_stat_io context AIO pg_stat_io overlap

    supported I/O not direct I/O operations + bytes + time by backend/object/context Outcome: better concurrency and better context, not a free latency cure. https://www.postgresql.org/docs/18/monitoring-stats.html#MONITORING-PG-STAT-IO-VIEW 22
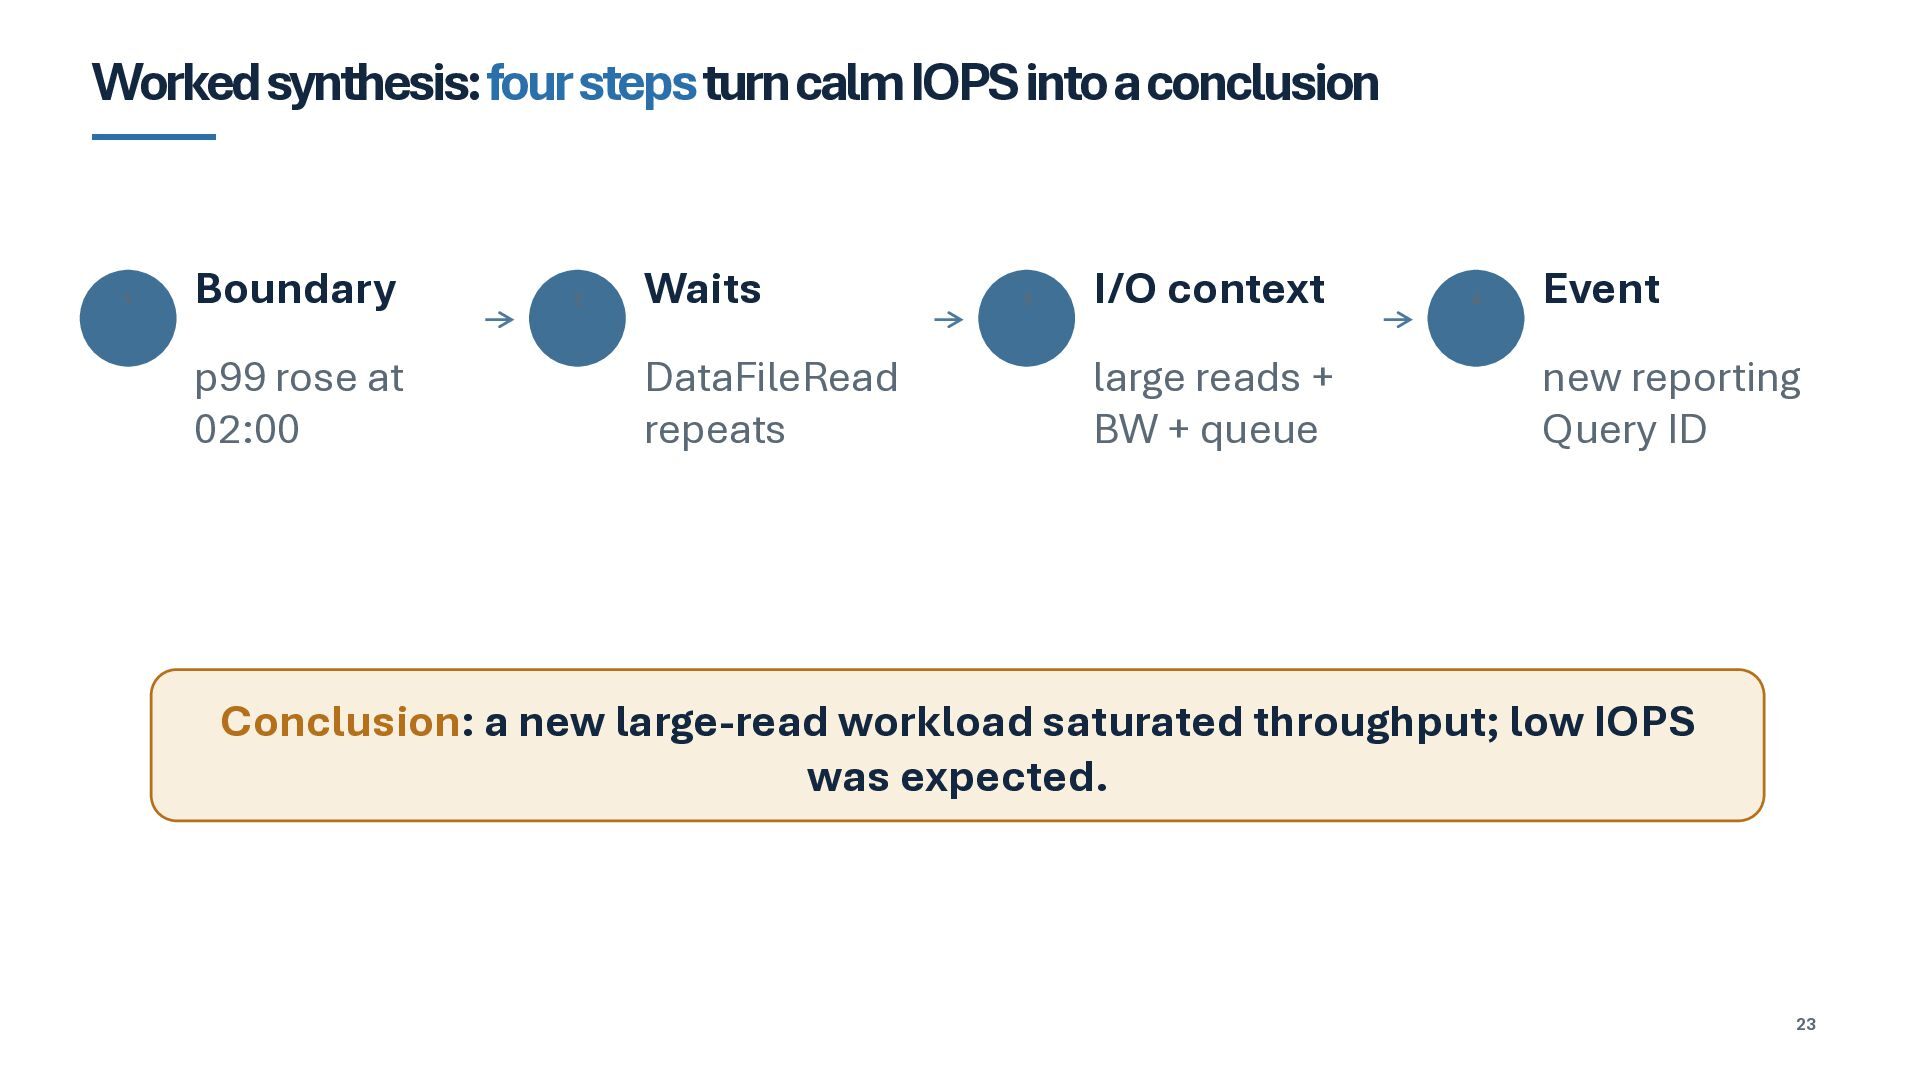
  22. Worked synthesis: four stepsturn calm IOPS into a conclusion 1

    Boundary p99 rose at 02:00 2 Waits DataFileRead repeats 3 I/O context large reads + BW + queue 4 Event new reporting Query ID Conclusion: a new large-read workload saturated throughput; low IOPS was expected. 23
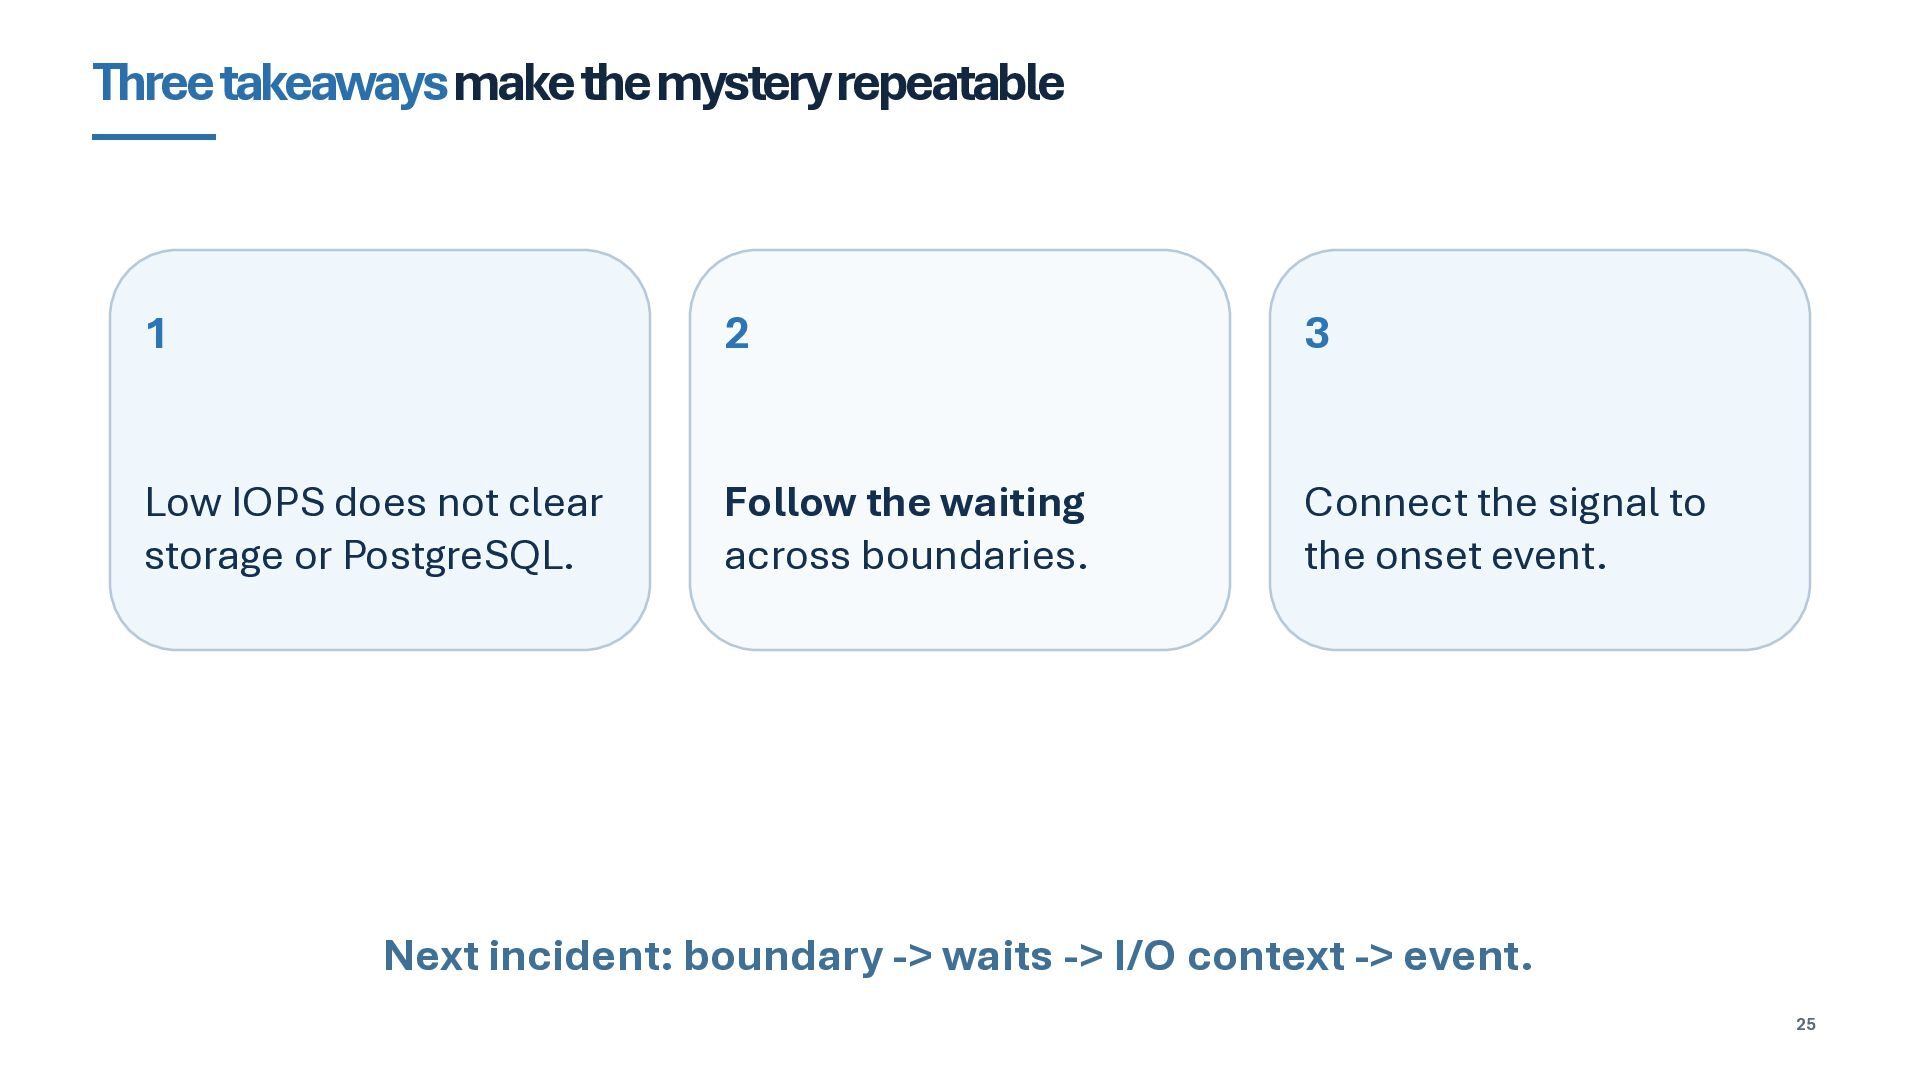
  23. Three takeawaysmake the mystery repeatable 1 2 3 Low IOPS

    does not clear storage or PostgreSQL. Follow the waiting across boundaries. Connect the signal to the onset event. Next incident: boundary -> waits -> I/O context -> event. 25
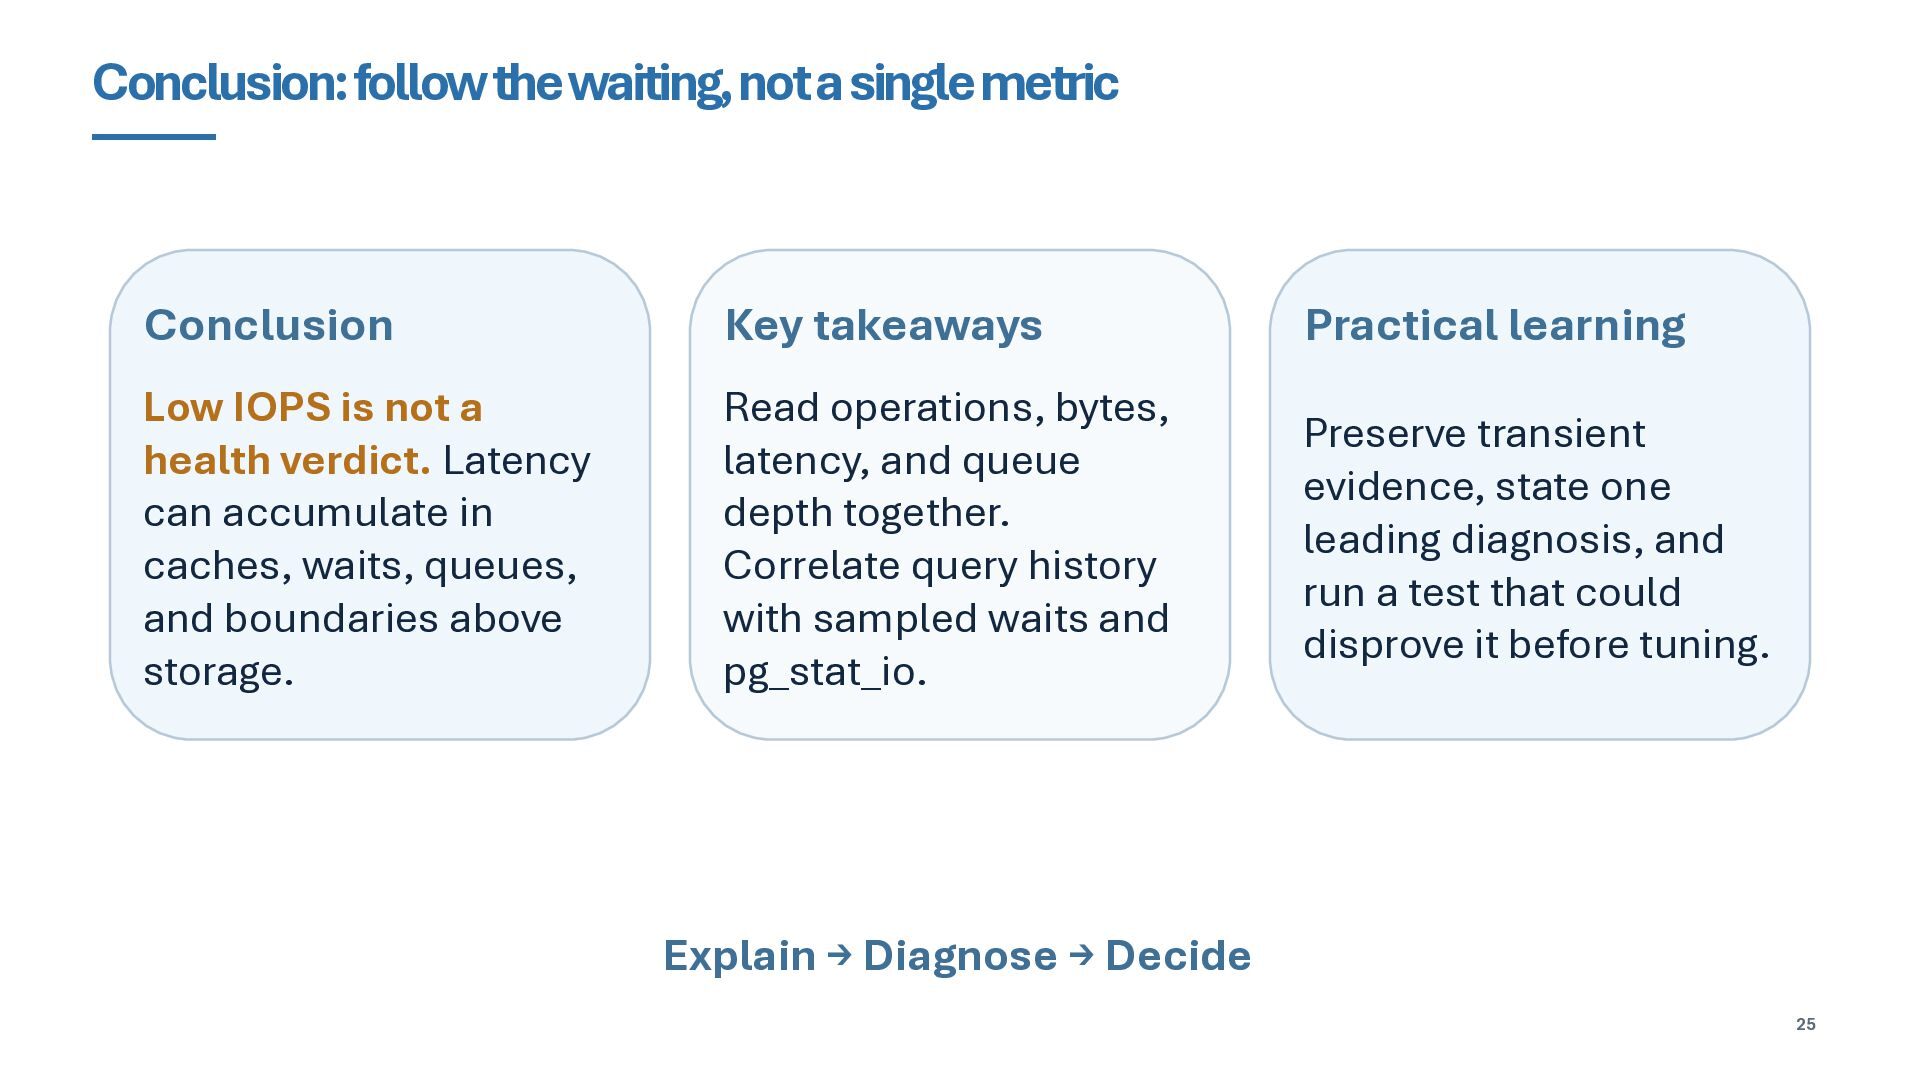
  24. Conclusion: follow the waiting, not a single metric Conclusion Key

    takeaways Practical learning Low IOPS is not a health verdict. Latency can accumulate in caches, waits, queues, and boundaries above storage. Read operations, bytes, latency, and queue depth together. Correlate query history with sampled waits and pg_stat_io. Preserve transient evidence, state one leading diagnosis, and run a test that could disprove it before tuning. Explain → Diagnose → Decide 25