$30 off During Our Annual Pro Sale. View Details »

Discriminating news-reading behavior and cognition using eye-tracking methodologies

gotoplanb
July 09, 2013

Discriminating news-reading behavior and cognition using eye-tracking methodologies

gotoplanb

July 09, 2013
Tweet

More Decks by gotoplanb

Other Decks in Research

Transcript

  1. Discriminating News-Reading
    Behavior and Cognition Using
    Eye-Tracking Methodologies
    Author: David Stanton
    Defense: July 9, 2013
    Monday, July 8, 13

    View Slide

  2. Summary
    Informed design choices can lower the
    cognitive load required to detect, parse and
    prioritize available visual information, which
    in turn allows more cognitive resources to
    be available for in-depth processing, learning
    and storage.
    This dissertation systematically studies news
    reading to suggest how to begin sequencing
    and testing news design.
    Monday, July 8, 13

    View Slide

  3. Rationale
    • We used to have newspapers, radio and
    television news with homogenous narrative
    structures.
    • Now we have phones, tablets, laptops and
    gaming systems all capable of news
    delivery. Content scopes and frequencies
    are controlled by the reader.
    Monday, July 8, 13

    View Slide

  4. Rationale
    • Given more choices and more control, how
    do people find information?
    • How can information be delivered to
    maximize cognition?
    • What structures and scope optimize
    cognition and economics?
    Monday, July 8, 13

    View Slide

  5. Literature Review
    • Eye-tracking directly measures visual
    detection and information processing
    (Yarbus, 1967).
    • Scanpath Theory (Noton & Stark, 1971).
    • Feature Integration Theory (Treisman &
    Gelade, 1980).
    • Schema Theory (Wicks & Drew, 1991).
    Monday, July 8, 13

    View Slide

  6. Eye movements
    • 50ms orienting response.
    • 50ms to 300ms 
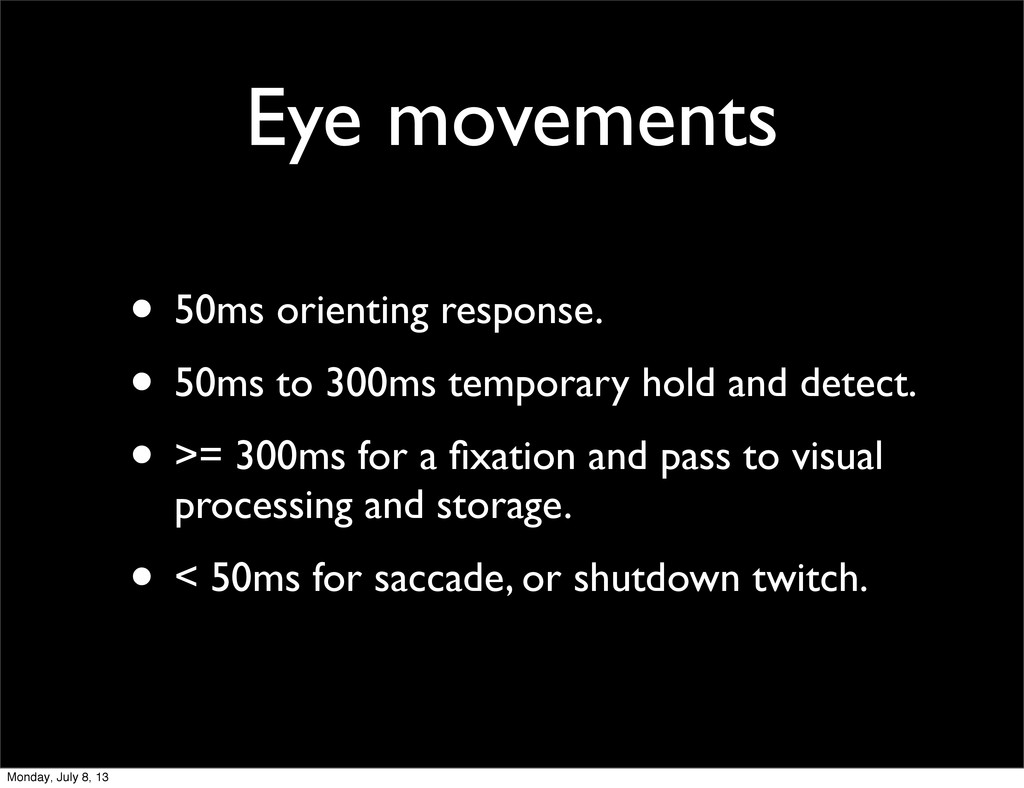
temporary hold and detect.
    • >= 300ms for a fixation and pass to visual
    processing and storage.
    • < 50ms for saccade, or shutdown twitch.
    Monday, July 8, 13

    View Slide

  7. Visual attention
    • Peripheral (parafoveal) scanning compiles
    temporary multidimensional mental 
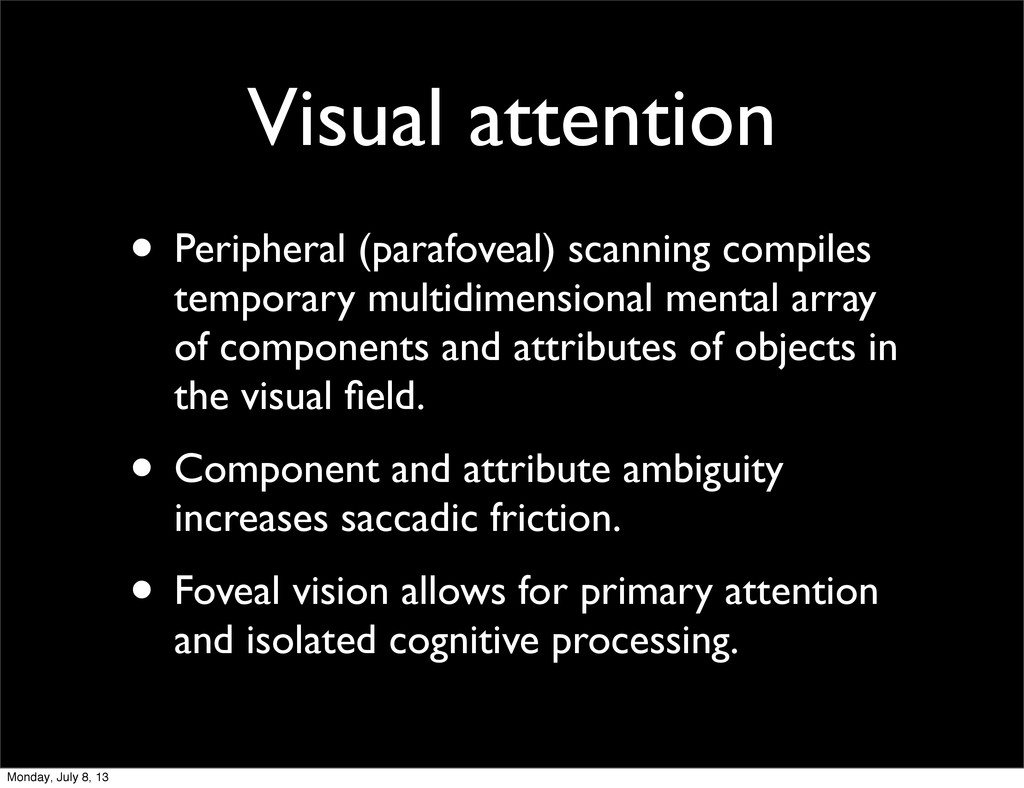
array
    of components and attributes of objects in
    the visual field.
    • Component and attribute ambiguity
    increases saccadic friction.
    • Foveal vision allows for primary attention
    and isolated cognitive processing.
    Monday, July 8, 13

    View Slide

  8. Scanpath Theory
    • Readers scan and detect visual attributes.
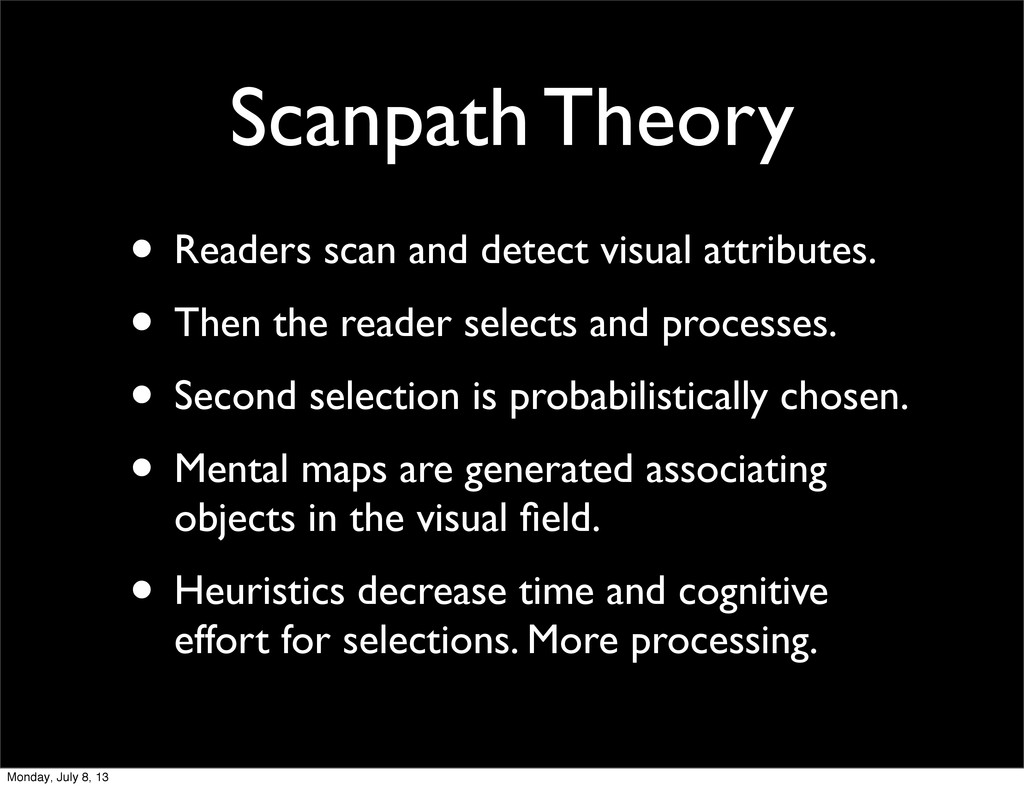
    • Then the reader selects and processes.
    • Second selection is probabilistically chosen.
    • Mental maps are generated associating
    objects in the visual field.
    • Heuristics decrease time and cognitive
    effort for selections. More processing.
    Monday, July 8, 13

    View Slide

  9. Feature Integration
    Theory
    • Use color, size, positioning and distance 
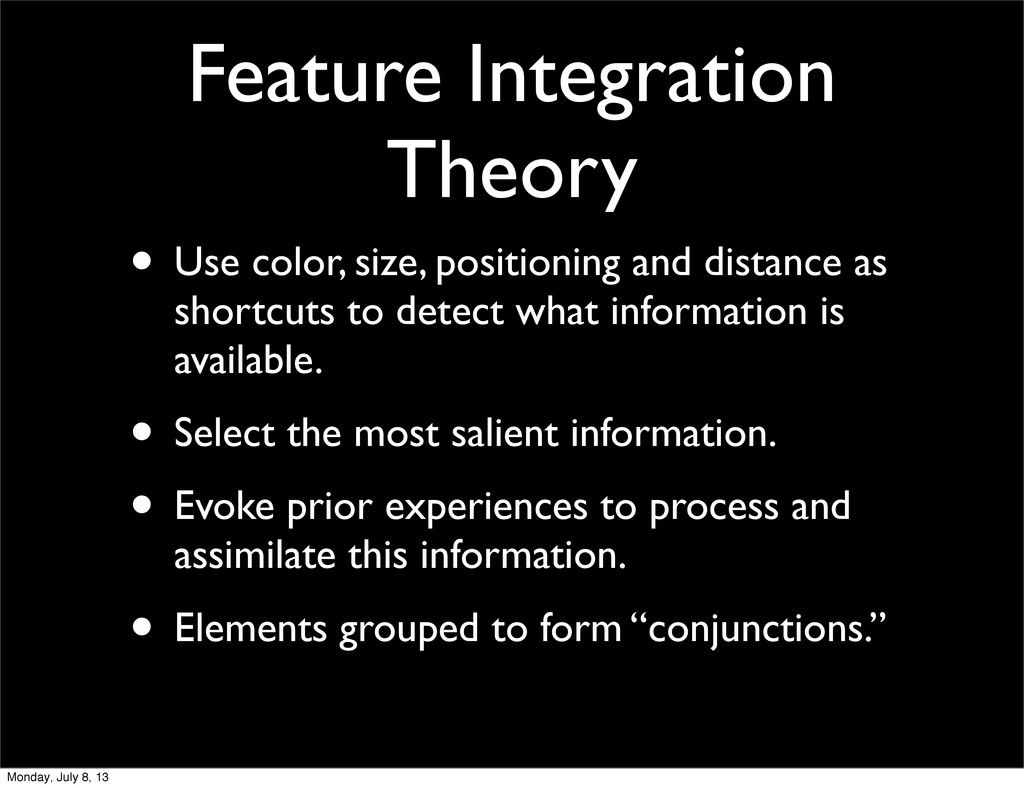
as
    shortcuts to detect what information is
    available.
    • Select the most salient information.
    • Evoke prior experiences to process and
    assimilate this information.
    • Elements grouped to form “conjunctions.”
    Monday, July 8, 13

    View Slide

  10. Schema Theory
    • Information is stored in an organizational
    structure 
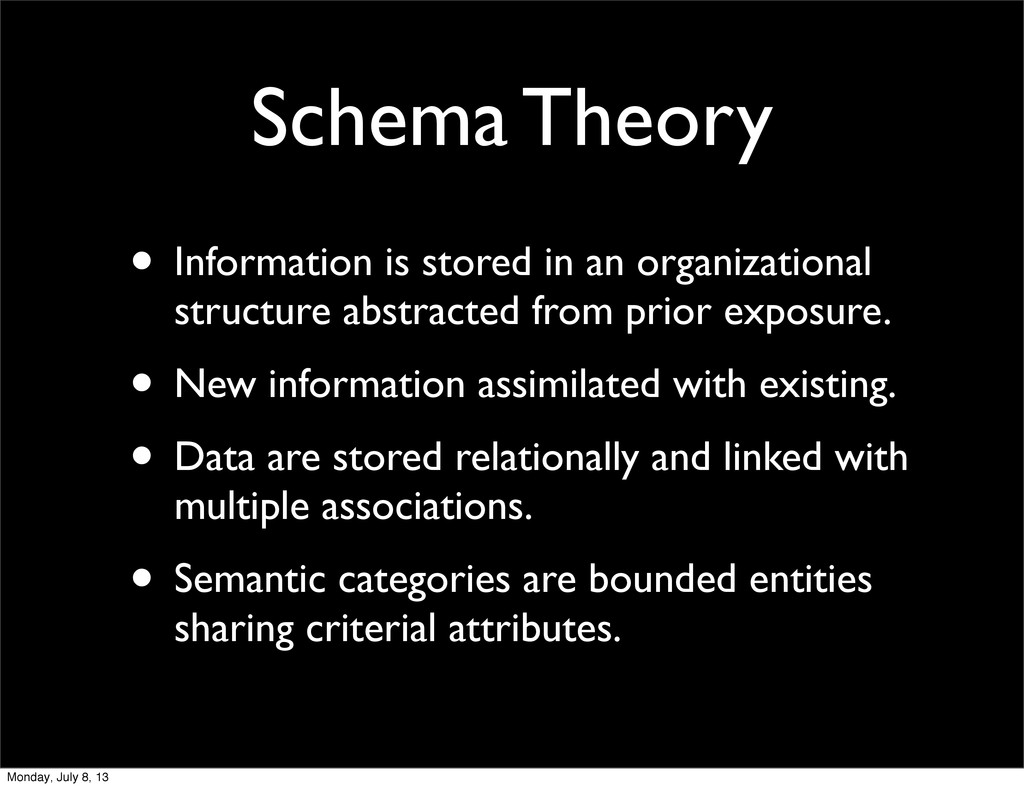
abstracted from prior exposure.
    • New information assimilated with existing.
    • Data are stored relationally and linked with
    multiple associations.
    • Semantic categories are bounded entities
    sharing criterial attributes.
    Monday, July 8, 13

    View Slide

  11. Hypotheses
    • H1: Visual elements, or structural types of
    news content, on a stimulus will not have
    equal probabilities of being fixed upon by
    the reader.
    Monday, July 8, 13

    View Slide

  12. Hypotheses
    • H2: Readers given prototype news pages
    that utilize smaller, discrete storytelling
    elements will perform better information
    recognition.
    Monday, July 8, 13

    View Slide

  13. Hypotheses
    • H3a: The frequency of elements fixated by a
    person will be greatest during initial
    exposure.
    • H3b: The frequency of fixated elements will
    decrease as exposure time increases.
    Monday, July 8, 13

    View Slide

  14. Research Questions
    • RQ1: Will medium or story structure be
    more important in determining how people
    read the news?
    Monday, July 8, 13

    View Slide

  15. Research Questions
    • RQ2a: How does gender relate with reading
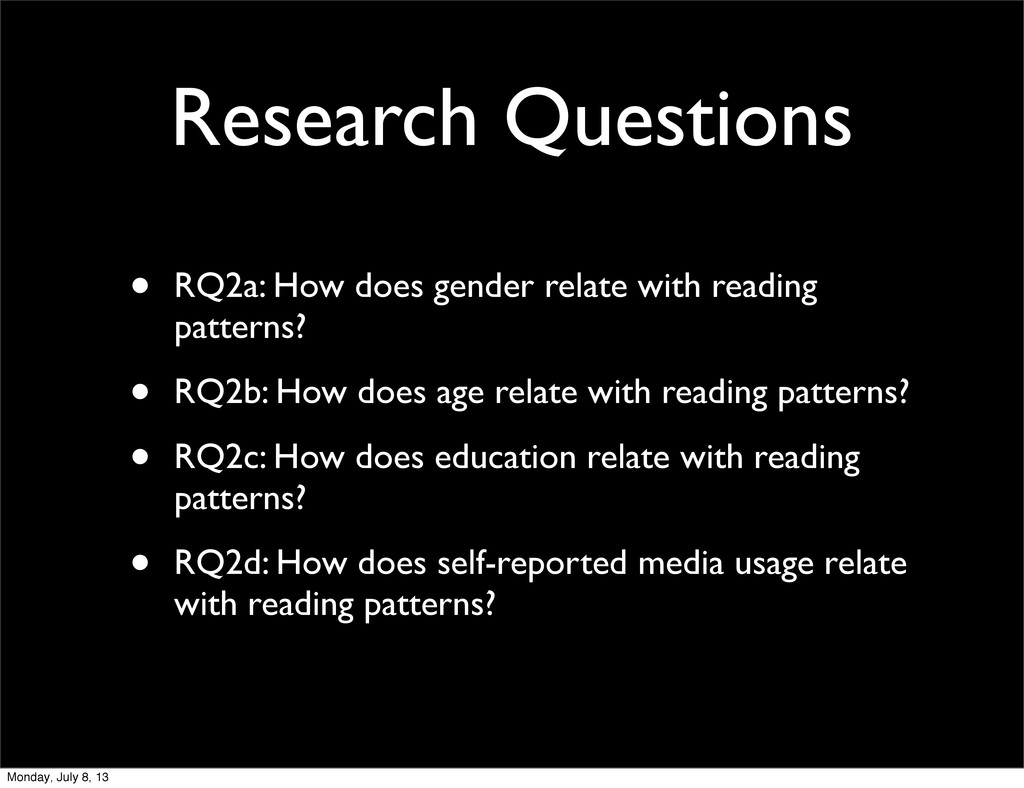
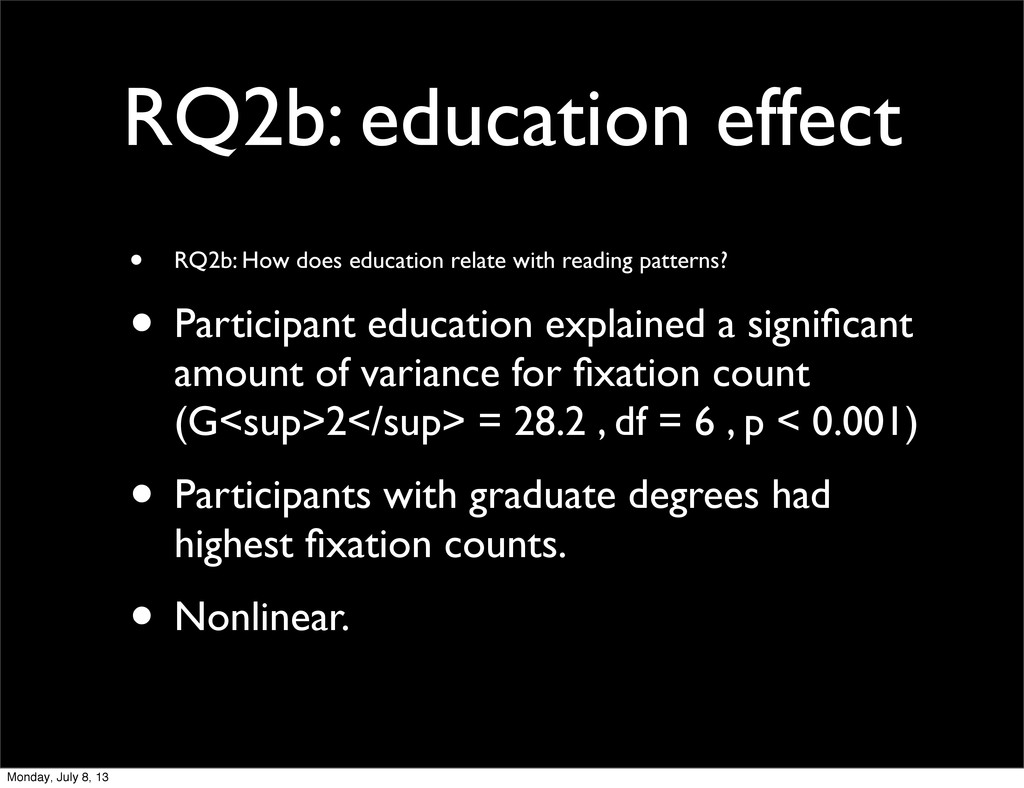
    patterns?
    • RQ2b: How does age relate with reading patterns?
    • RQ2c: How does education relate with reading
    patterns?
    • RQ2d: How does self-reported media usage relate
    with reading patterns?
    Monday, July 8, 13

    View Slide

  16. Methodology
    • Content Analysis of news design elements.
    • Sequential data of news reading.
    • 200 participants from St. Petersburg, Fla.
    • 3 (prototype) x 2 (media) quasi-
    experimental design.
    Monday, July 8, 13

    View Slide

  17. Methodology
    • Dependence-based contingency tables.
    • Markov; first-order autoregressive process.
    • Scanpaths are invertible and stationary.
    • SDIS for state and event sequences.
    • Transitional probabilities of B following A.
    Monday, July 8, 13

    View Slide

  18. Results
    • Stimulus manipulation check.
    • Participant awareness same across
    all prototypes.
    • Intercoder agreement Kappa 0.89.
    Monday, July 8, 13

    View Slide

  19. H1 confirmed
    • H1: Visual elements, or structural types of 
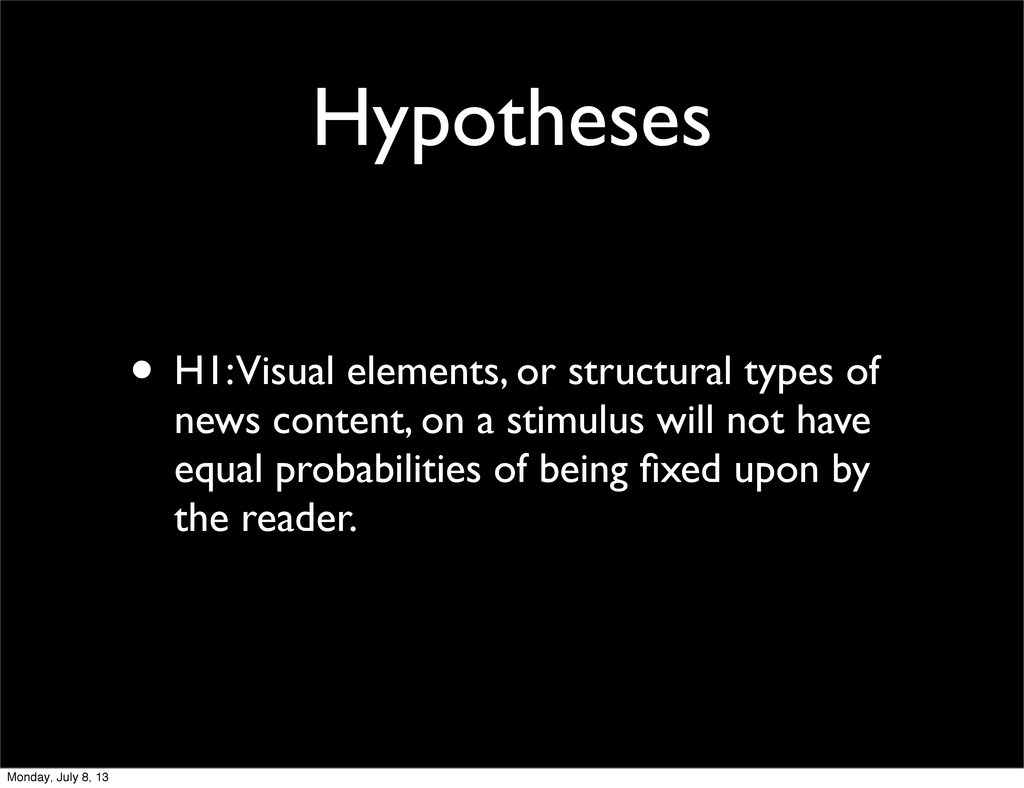
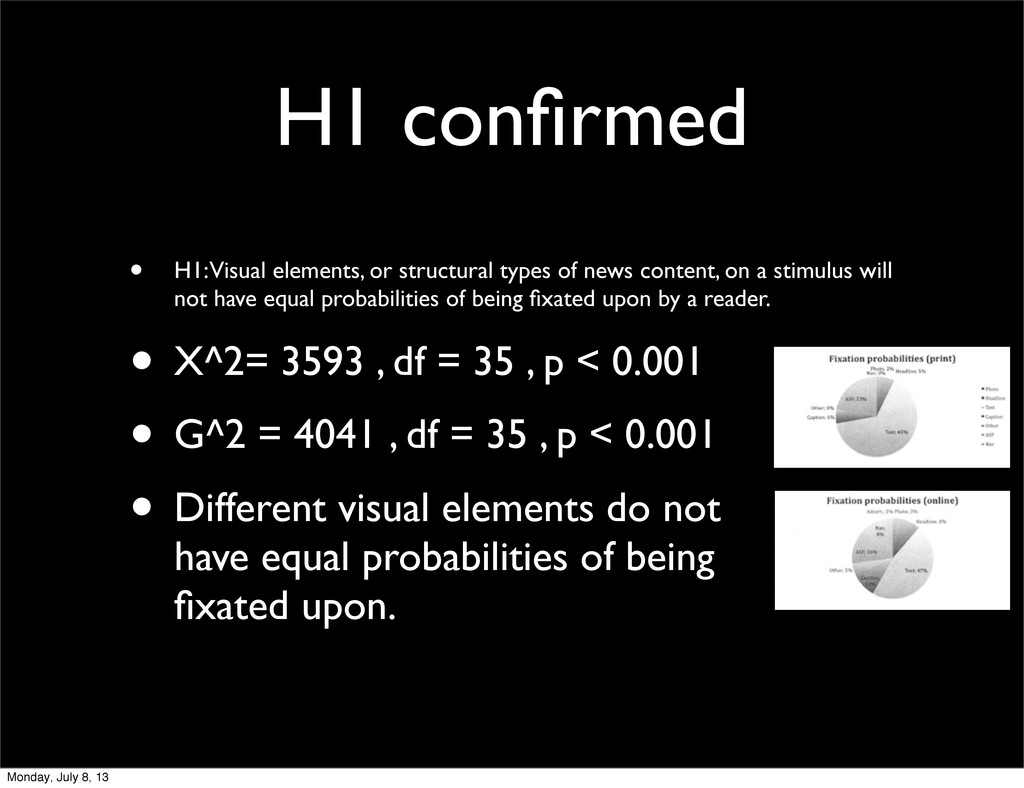
news content, on a stimulus will
    not have equal probabilities of being fixated upon by a reader.
    • X^2= 3593 , df = 35 , p < 0.001
    • G^2 = 4041 , df = 35 , p < 0.001
    • Different visual elements do not
    have equal probabilities of being
    fixated upon.
    Monday, July 8, 13

    View Slide

  20. H2 confirmed
    • H2: Readers given prototype news pages that 
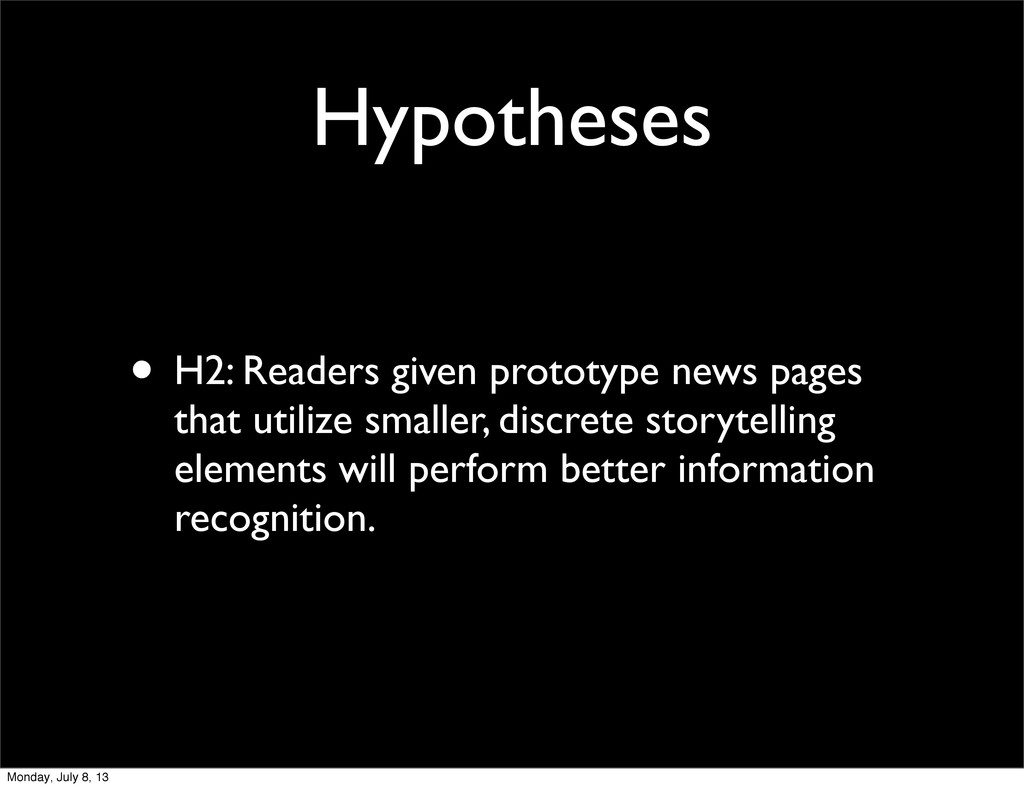
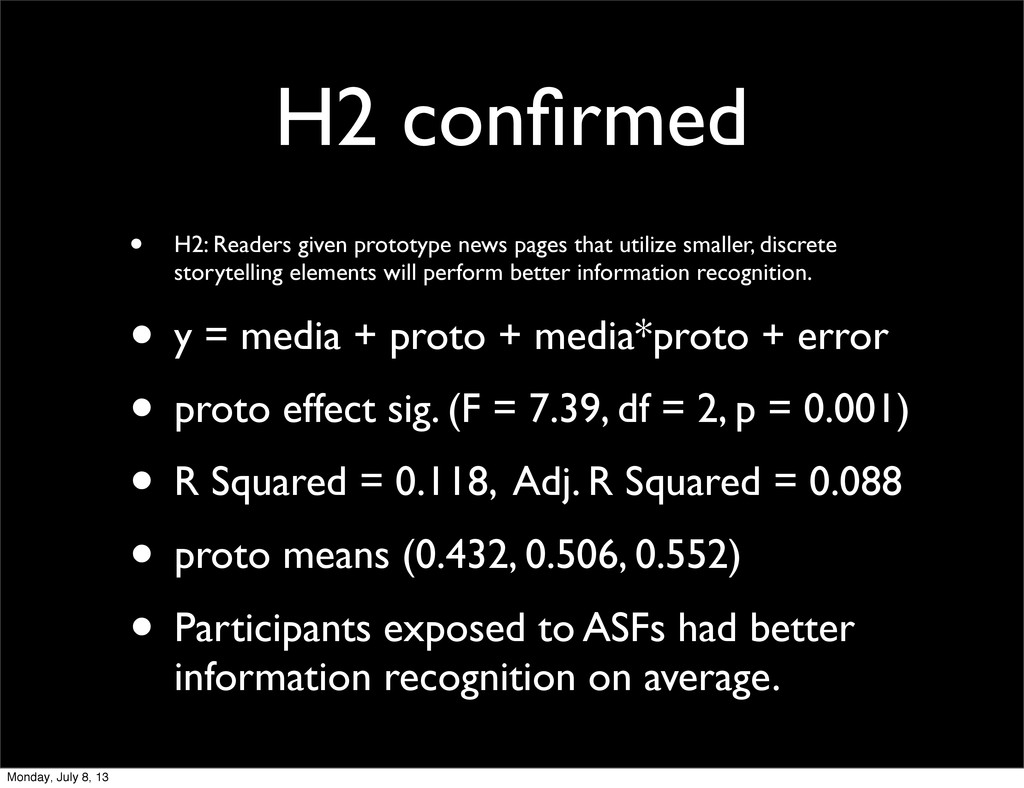
utilize smaller, discrete
    storytelling elements will perform better information recognition.
    • y = media + proto + media*proto + error
    • proto effect sig. (F = 7.39, df = 2, p = 0.001)
    • R Squared = 0.118, Adj. R Squared = 0.088
    • proto means (0.432, 0.506, 0.552)
    • Participants exposed to ASFs had better
    information recognition on average.
    Monday, July 8, 13

    View Slide

  21. H3a, H3b confirmed
    • H3: (a) The frequency of elements 
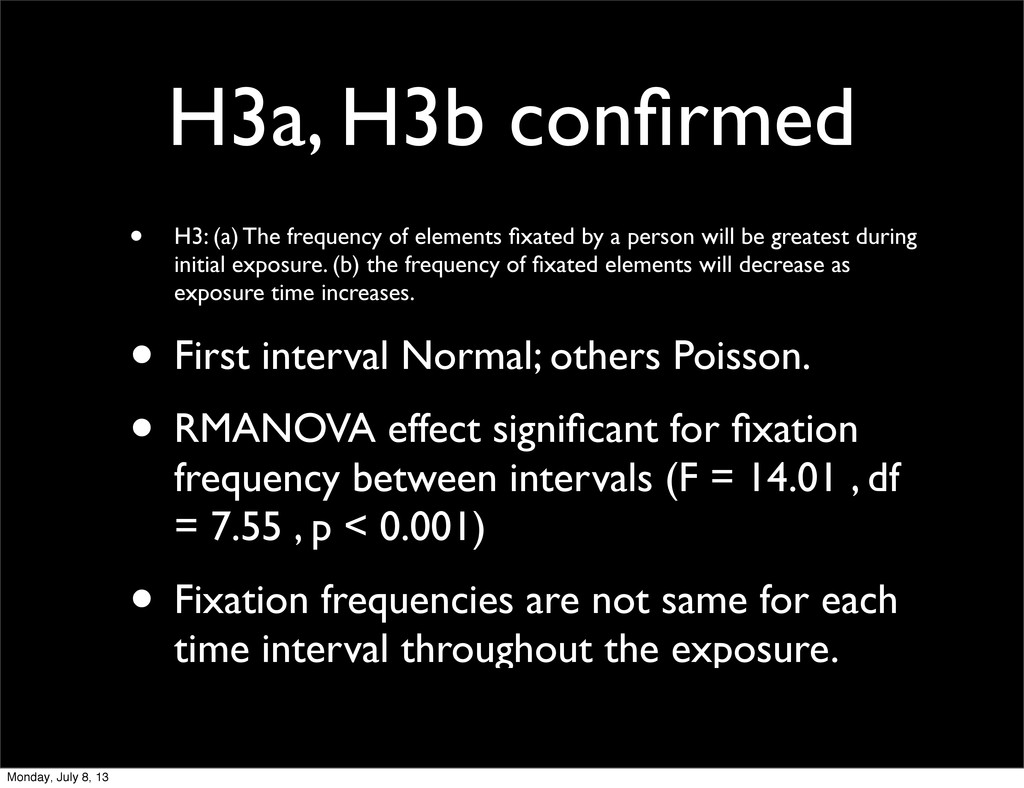
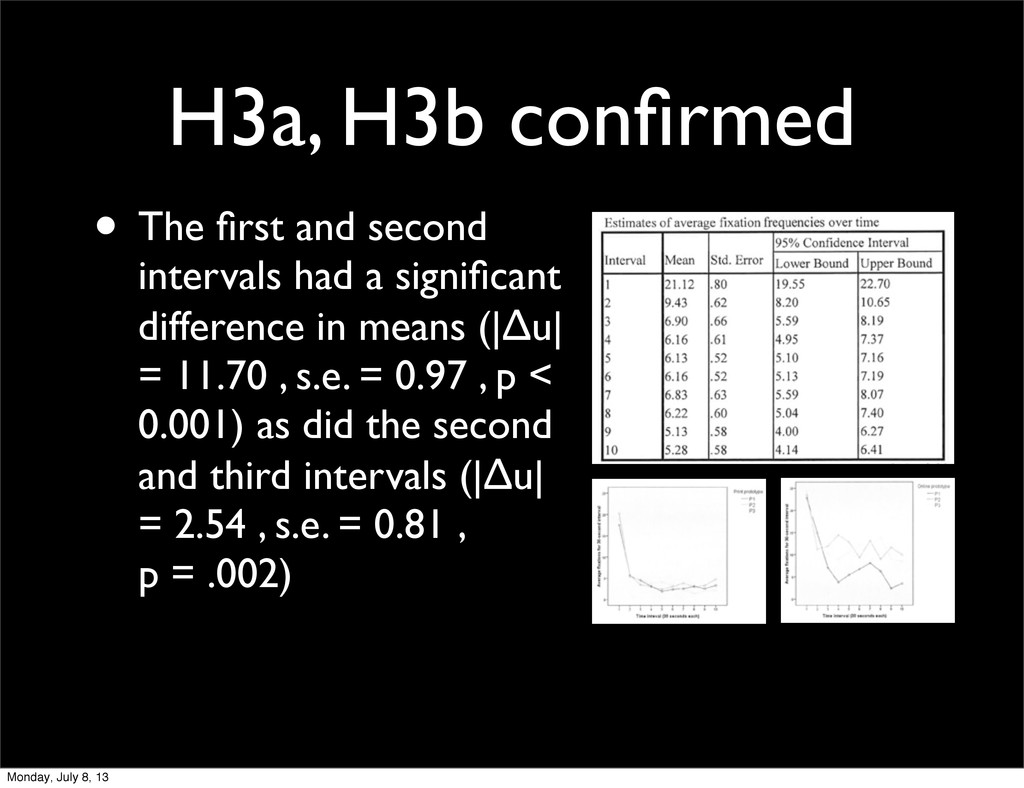
fixated by a person will be greatest during
    initial exposure. (b) the frequency of fixated elements will decrease as
    exposure time increases.
    • First interval Normal; others Poisson.
    • RMANOVA effect significant for fixation
    frequency between intervals (F = 14.01 , df
    = 7.55 , p < 0.001)
    • Fixation frequencies are not same for each
    time interval throughout the exposure.
    Monday, July 8, 13

    View Slide

  22. H3a, H3b confirmed
    • The first and second
    intervals had a significant
    difference in means (|Δu|
    = 11.70 , s.e. = 0.97 , p <
    0.001) as did the second
    and third intervals (|Δu|
    = 2.54 , s.e. = 0.81 ,
    p = .002)
    Monday, July 8, 13

    View Slide

  23. H4 support suggested
    • H4: The variability of scanpaths between participants will increase as the
    visual complexity increases.
    • Scanpaths couple now and next.
    Monday, July 8, 13

    View Slide

  24. H4 support suggested
    • H4 cannot be statistically tested because 
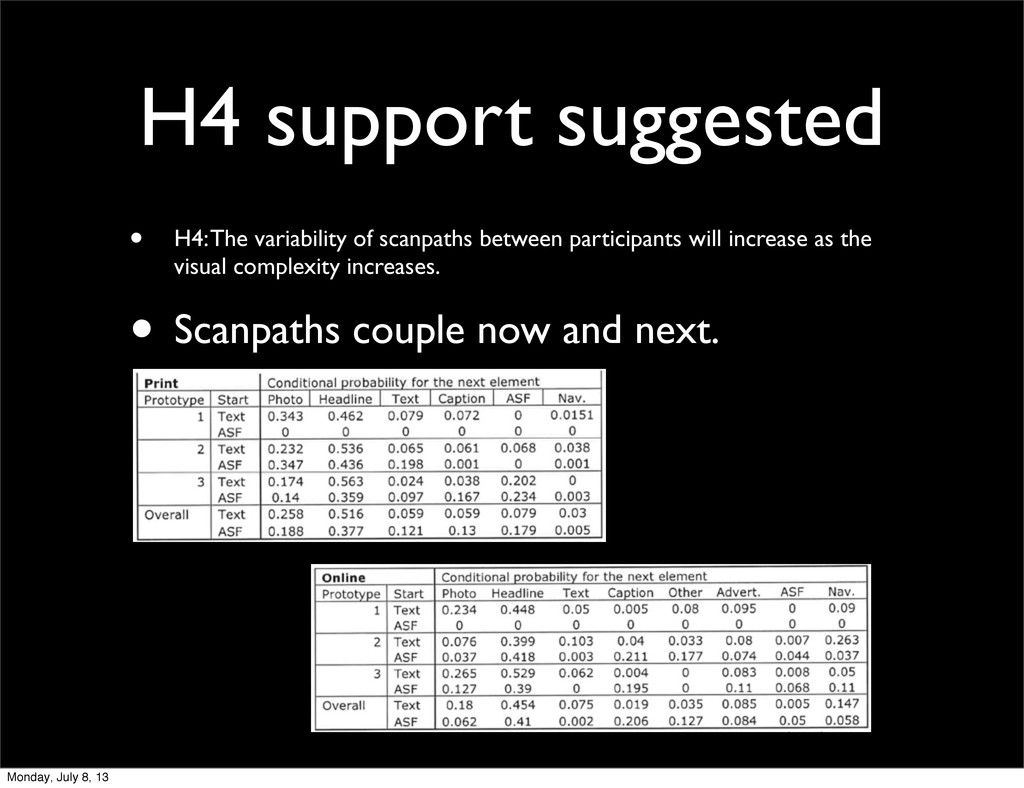
of
    design confounds, but there appears to be
    initial support that the use of alternative
    story forms relate to more varied
    scanpaths.
    • Future research could eliminate confounds.
    Monday, July 8, 13

    View Slide

  25. Research questions
    • Exploratory Poisson log linear models using
    demographics to predict fixation counts
    during first interval.
    • count = media + proto + sex + ed + i + e
    • G^2 = 524.15 , df = 135 , ratio = 3.88
    Monday, July 8, 13

    View Slide

  26. RQ1: medium effect
    • RQ1: Will medium or story structure 
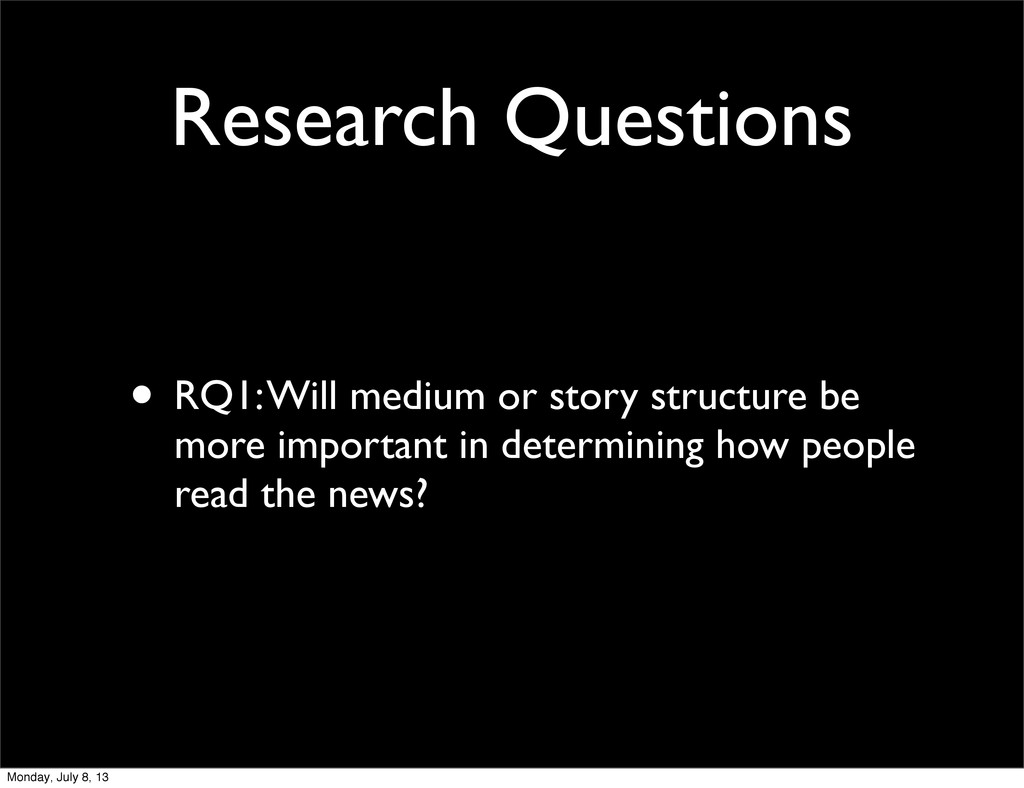
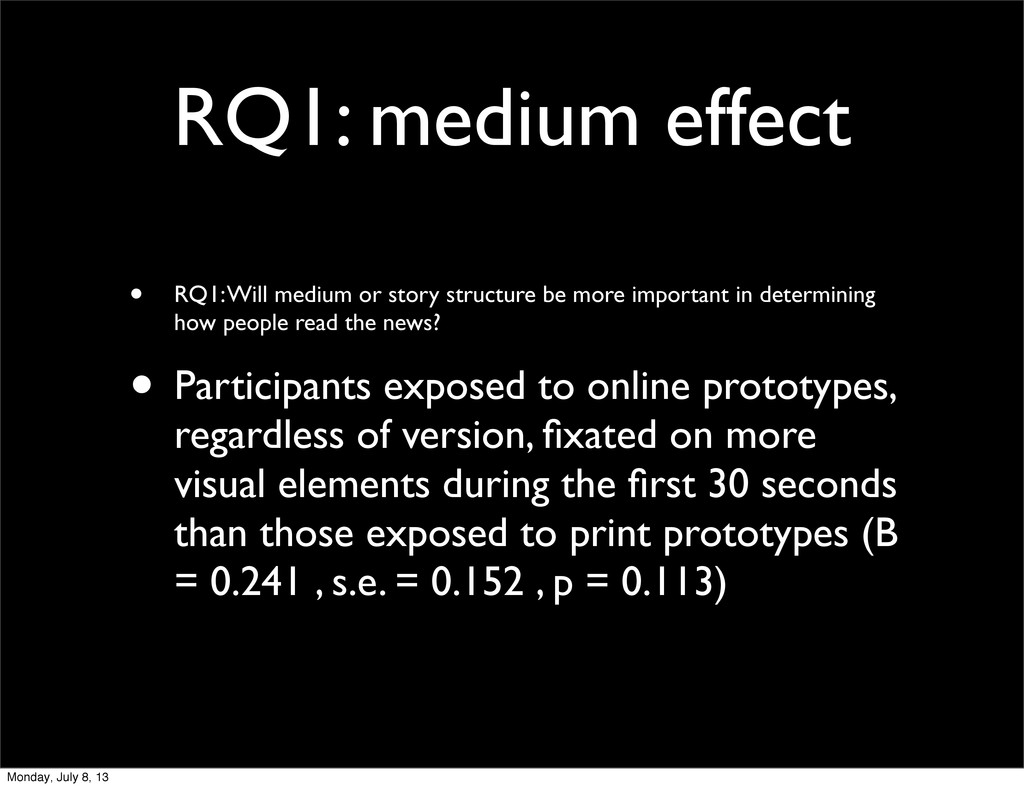
be more important in determining
    how people read the news?
    • Participants exposed to online prototypes,
    regardless of version, fixated on more
    visual elements during the first 30 seconds
    than those exposed to print prototypes (B
    = 0.241 , s.e. = 0.152 , p = 0.113)
    Monday, July 8, 13

    View Slide

  27. RQ2a: sex effect
    • RQ2a: How does sex relate with 
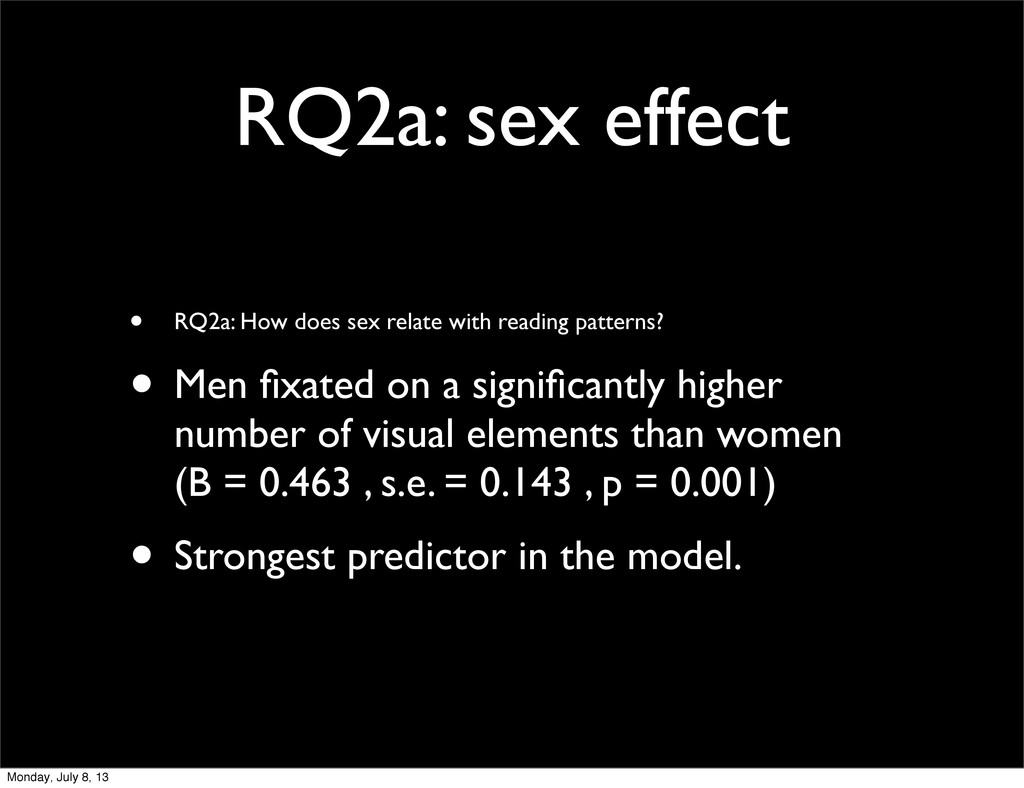
reading patterns?
    • Men fixated on a significantly higher
    number of visual elements than women
    (B = 0.463 , s.e. = 0.143 , p = 0.001)
    • Strongest predictor in the model.
    Monday, July 8, 13

    View Slide

  28. RQ2b: education effect
    • RQ2b: How does education relate with reading patterns?
    • Participant education explained a significant
    amount of variance for fixation count
    (G2 = 28.2 , df = 6 , p < 0.001)
    • Participants with graduate degrees had
    highest fixation counts.
    • Nonlinear.
    Monday, July 8, 13

    View Slide

  29. RQ2c: local TV effect
    • RQ2c: How does self-reported media 
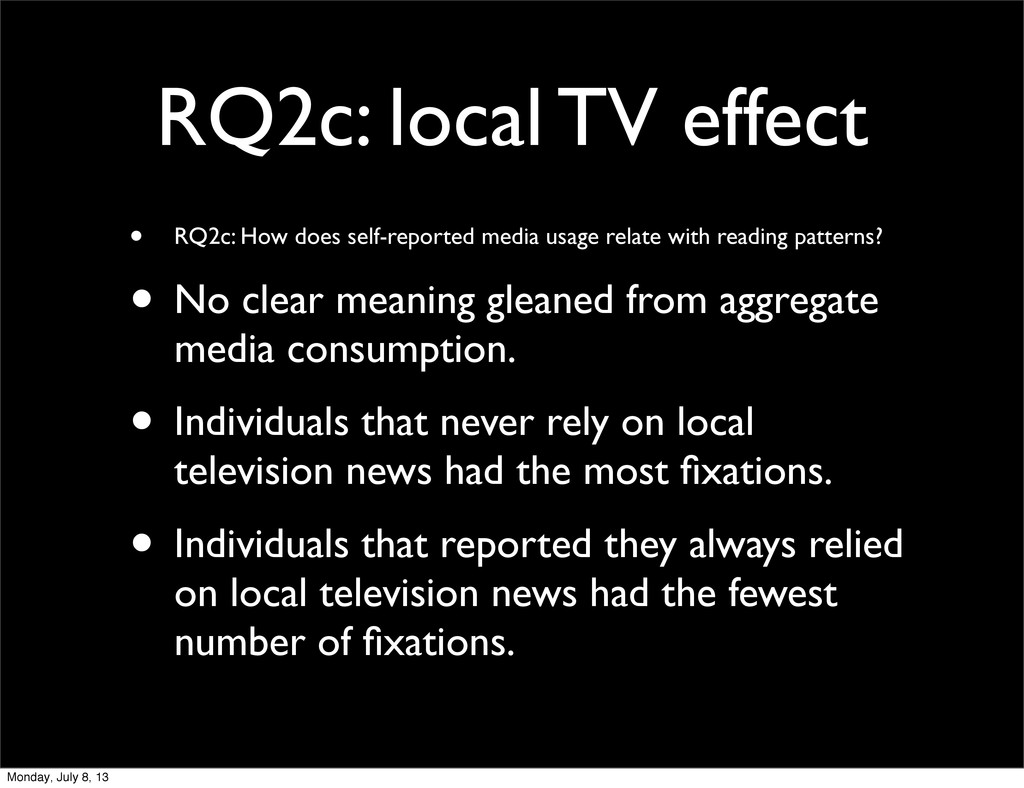
usage relate with reading patterns?
    • No clear meaning gleaned from aggregate
    media consumption.
    • Individuals that never rely on local
    television news had the most fixations.
    • Individuals that reported they always relied
    on local television news had the fewest
    number of fixations.
    Monday, July 8, 13

    View Slide

  30. Discussion
    • H1 confirms objects can be detected by
    peripheral 
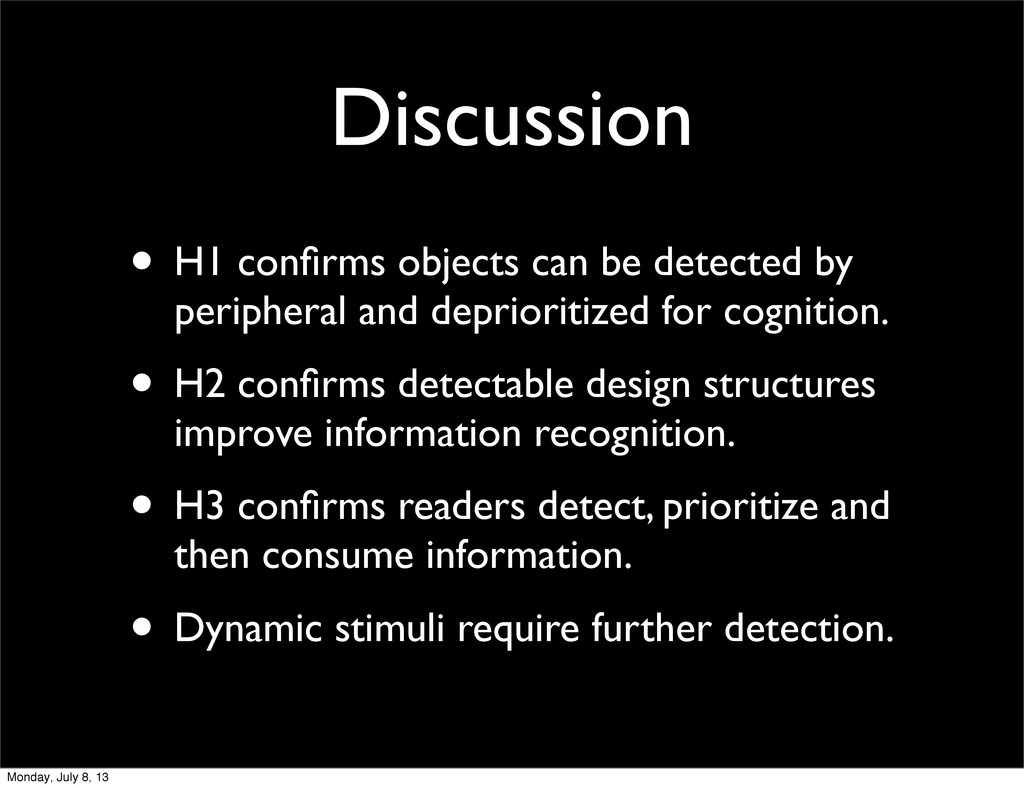
and deprioritized for cognition.
    • H2 confirms detectable design structures
    improve information recognition.
    • H3 confirms readers detect, prioritize and
    then consume information.
    • Dynamic stimuli require further detection.
    Monday, July 8, 13

    View Slide

  31. Weaknesses
    • Cross-media confounds.
    • Huge contingency tables prevent
    comparisons on all unique elements.
    Monday, July 8, 13

    View Slide

  32. Practical implications
    • Readers detect what is available and then
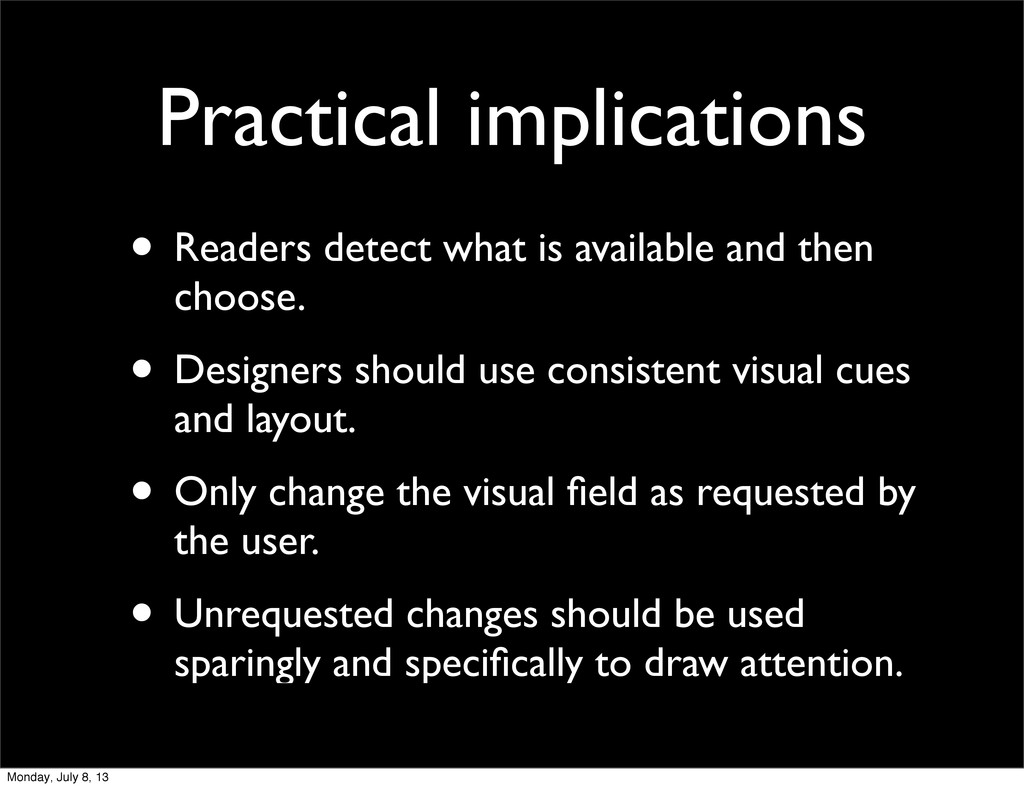
    choose.
    • Designers should use consistent visual cues
    and layout.
    • Only change the visual field as requested by
    the user.
    • Unrequested changes should be used
    sparingly and specifically to draw attention.
    Monday, July 8, 13

    View Slide

  33. Practical implications
    • Use appropriate story forms.
    • Leverage reader experiences.
    • Avoid design choices that make
    detection confusing.
    Monday, July 8, 13

    View Slide

  34. Future Research
    • Automated behavioral tracking of design
    variations within 
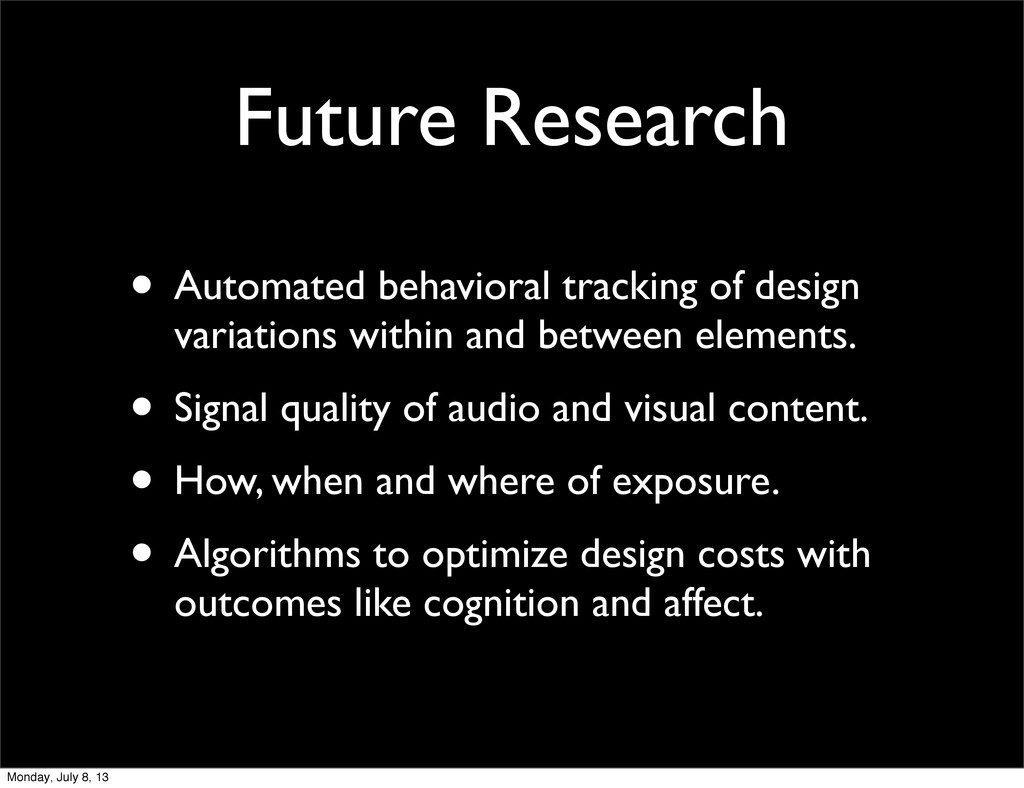
and between elements.
    • Signal quality of audio and visual content.
    • How, when and where of exposure.
    • Algorithms to optimize design costs with
    outcomes like cognition and affect.
    Monday, July 8, 13

    View Slide

  35. Questions?
    Monday, July 8, 13

    View Slide