Upgrade to Pro — share decks privately, control downloads, hide ads and more …

testing

Avatar for Katie Hopkins Katie Hopkins
March 24, 2022
7

 testing

Avatar for Katie Hopkins

Katie Hopkins

March 24, 2022
Tweet

Transcript

  1. TEAM Data Analyst, Communications Director ANGELA PACATTE Data Analyst, Machine

    Learning Engineer KELSEY CORCORAN Data Analyst, Chief Marketing Officer KATIE HOPKINS Data Analyst, Chief Information Officer JACK BAUER Data Analyst, Project Manager BOWEN WILDER
  2. 03 TABLE OF • What is a Stroke? • Symptoms

    of a Stroke INTRODUCTION 01 • Why choose this topic? • Questions to Answer… PURPOSE • The Dataset • Medical Criteria • Personal Criteria • EDA Findings STROKE DATA 02 • EDA Analysis Descr. Phase(?) • Visualizations • Reccomendations • EDA Findings ANALYSIS 04 • Results • Reccomendations • What we would have done differently… CONCLUSIONS 06 • Project Framework TOOLS 05 CONTENTS
  3. SYMPTOMS OF A STROKE BRAIN Sudden confusion, trouble speaking, or

    difficulty understanding speech. Severe headache HEART Having a stroke increases a person’s risk for cardiac trouble MOBILITY Sudden trouble walking, dizziness, loss of balance, or lack of coordination EYES Trouble seeing in one or both eyes NUMBNESS Sudden weakness in the face, arm, or leg, especially on one side of the body
  4. STROKE DATASET Shape (5,109, 12) Missing Values 201 NaNs in

    “BMI” column All Criteria Medical Criteria Personal Criteria
  5. MEDICAL CRITERIA From birth to 82 years of age AGE

    Yes or No HYPERTENSION Male or Female GENDER Yes or No HEART DISEASE From 10 to 98 BMI From 55 to 268 AVG GLUCOSE LVL
  6. PERSONAL CRITERIA Yes or No EVER MARRIED Male or Female

    Government, Private, Self-Employed, & Raise Children WORK TYPE Current, Former, Never, & Unknown SMOKING STATUS Rural or Urban RESIDENCE TYPE AGE GENDER From birth to 82 years of age
  7. QUESTIONS TO ANSWER… How successfully can a ML model be

    used to predict stroke risk? MERCURY *** MARS Which aspect is more accurate to predict risk: medical or personal data? VENUS
  8. ANALYSIS Pluto Sun Jupiter Follow the link in the graph

    to modify its data and then paste the new one here. For more info, click here 5% 25% 70% EVOLUTION PREVALENCE 120,000,000 Important number
  9. 9h 55m 23s Is Jupiter's rotation period 333,000,000 Earths is

    the Sun’s mass 386,000 km Is the distance between Earth and the Moon
  10. RECOMMENDATIONS STEP 1 Venus is the second planet from the

    Sun STEP 2 Mercury is the smallest planet STEP 3 Despite being red, Mars is a cold place STEP 4 Neptune is very far from the Sun
  11. DBMS (Database Management Systems) IDE (Integrated Development Environment) Presentation Planning/

    Collaboration Communications CLI (Command Line Interface) ML (Machine Learning) EDA (Exploratory Data Analysis) PROJECT FRAMEWORK PARQUET MITO TABLEAU
  12. RESULTS Pluto Sun Jupiter Follow the link in the graph

    to modify its data and then paste the new one here. For more info, click here 5% 25% 70% EVOLUTION PREVALENCE 120,000,000 Important number
  13. 9h 55m 23s Is Jupiter's rotation period 333,000,000 Earths is

    the Sun’s mass 386,000 km Is the distance between Earth and the Moon
  14. RECOMMENDATIONS NEPTUNE JUPITER Mercury is the closest planet to the

    Sun and the smallest one Venus has a beautiful name and is the second planet from the Sun Despite being red, Mars is actually a cold place. It's full of iron oxide dust Saturn is a gas giant and has several rings. It's composed of hydrogen
  15. RECOMMENDATIONS STEP 1 Venus is the second planet from the

    Sun STEP 2 Mercury is the smallest planet STEP 3 Despite being red, Mars is a cold place STEP 4 Neptune is very far from the Sun
  16. Here’s what you’ll find in this Slidesgo template: 1. Used

    a larger dataset. 2. found in the alternative resources slide. 3. A thanks slide, which you must keep so that proper credits for our design are given. 4. A resources slide, where you’ll find links to all the elements used in the template. 5. Instructions for use. 6. Final slides with: • The fonts • A selection of illustrations. You • More infographic resources, whose size and color can be edited. • Sets of customizable icons of the following themes. You can delete this slide when you’re done editing the presentation. WHAT WOULD WE HAVE DONE DIFFERENTLY?
  17. • AUTHOR (YEAR). Title of the publication. Publisher • AUTHOR

    (YEAR). Title of the publication. Publisher • “” • “” • “” • “” • “” • “” • “” • “” • “” REFERENCES
  18. CREDITS: This presentation template was created by Slidesgo, including icons

    by Flaticon and infographics & images by Freepik DO YOU HAVE ANY QUESTIONS? [email protected] +1 512 555 SAML https://github.com/boborodono/San_Antonio THANKS!
  19. This presentation has been made using the following fonts: Spartan

    (https://fonts.google.com/specimen/Spartan) Cabin (https://fonts.google.com/specimen/Cabin) #434343 #f3f3f3 #ff5b5b Fonts & colors used #666666
  20. SLACK TECHNOLOGIES PANDAS PARQUET MITO JUPYTER NOTEBOOK VS CODE TABLEAU

    PgADMIN POWER POINT KAGGLE GITHUB ANACONDA SQLALCHEMY GITBASH SCIKIT-LEARN ZOOM GIT POSTGRESQL PYTHON GOOGLE DRIVE Languages Tools Collaboration & Storage Communications CLIs IDEs Presentation/ Dashboard
  21. PROJECT OUTLINE Extract "Stroke" data from Kaggle and load into

    a Jupyter Notebook Transform the data using Pandas and Parquet Use SQLAlchemy to upload database to PostgreSQL Load tables into PostgreSQL using PgAdmin4 Join Tables Load joined tables from PostgreSQL using SQLALchemy Use tables to run AdaBoost Machine Learning(ML) model Perform Exploratory Data Analysis (EDA) on ML results Split cleaned dataset into smaller chunks Rerun ML model on dataset chunks Perform EDA on truncated ML results
  22. Data Cleaning and Analysis - Jupyter Notebook and the Pandas

    library will be used to clean the data and perform an exploratory analysis. Further analysis will be completed using Python. Jupyter was selected because of the team's familiarity with the tool. Python was chosen because of its libraries for data ingestion and analysis such as Pandas and the ease of creating Machine Learning models using SKLearn as well as visualization capabilities in MatPlotLib. Database Storage - Postgres is the database used. It is easy to implement and run MySQL querries. We decided against AWS RDS because of the associated costs and several team members had alreacy cancelled their accounts. Machine Learning - SciKitLearn is the ML library we'll be using to create a linear regression. We'll train our algorithm with a histocal dataset on Covid Vaccinations and GDP of all countries. Dashboard - We created an interactive Tableau dashboard to visualize the data and help tell the story of how ation library to build an interactive webpage hosted in GitHub Pages. In addition, we will include the D3 library to visualize our data geographically. A webpage was unanimously agreed upon because of ease of display without a user having to install Tableau or PowerBI.
  23. PREVENTIONEASE STEP 1 Venus is the second planet from the

    Sun STEP 2 Mercury is the smallest planet STEP 3 Despite being red, Mars is a cold place STEP 4 Neptune is very far from the Sun
  24. CONCLUSIONS Do you know what helps you make your point

    clear? Lists like this one: • They’re simple • You can organize your ideas clearly • You’ll never forget to buy milk! And the most important thing: the audience won’t miss the point of your presentation
  25. Here’s what you’ll find in this Slidesgo template: 1. A

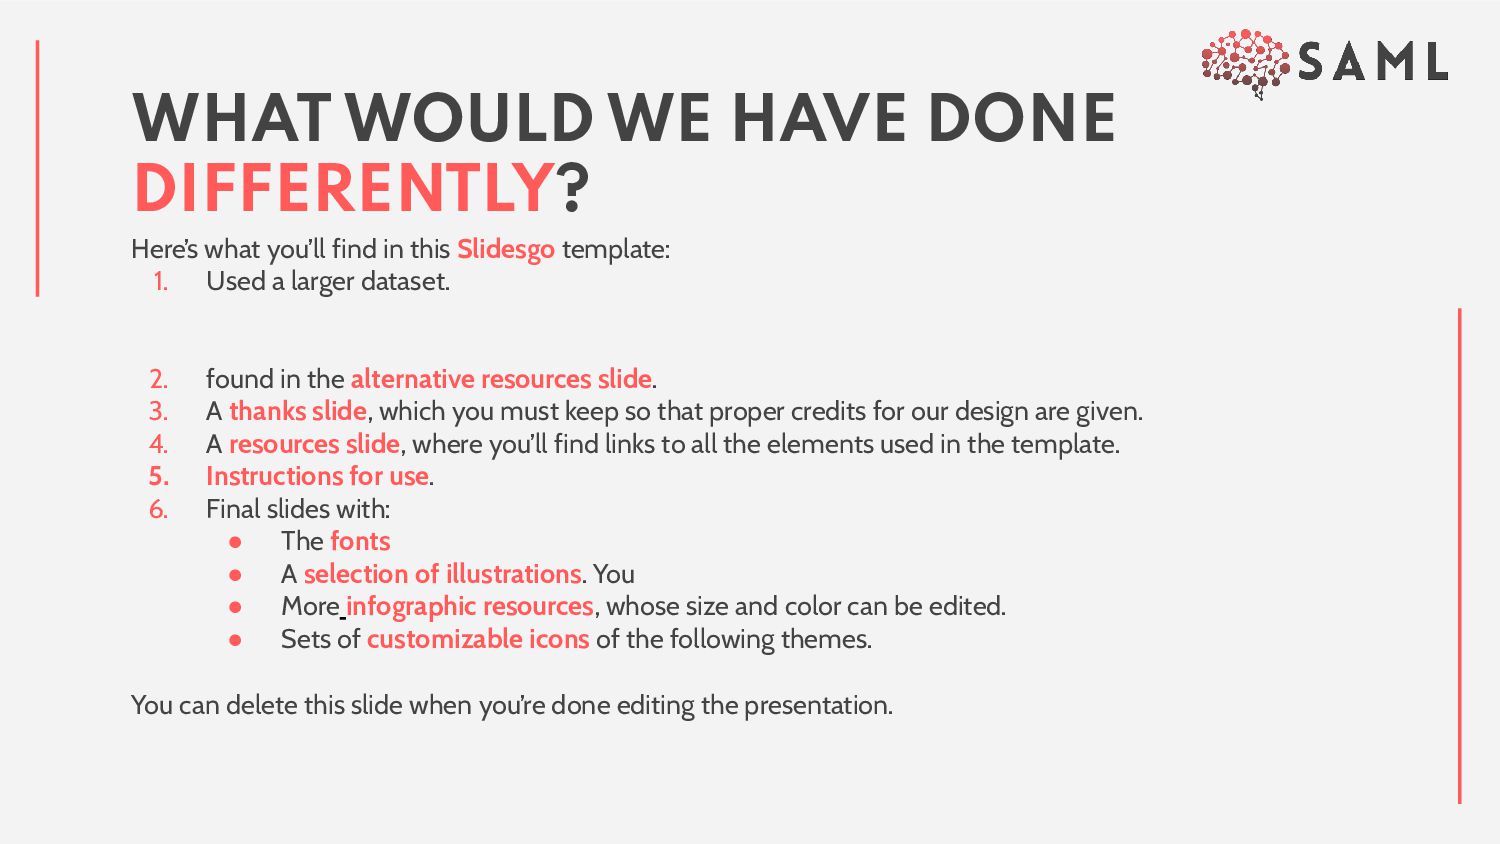
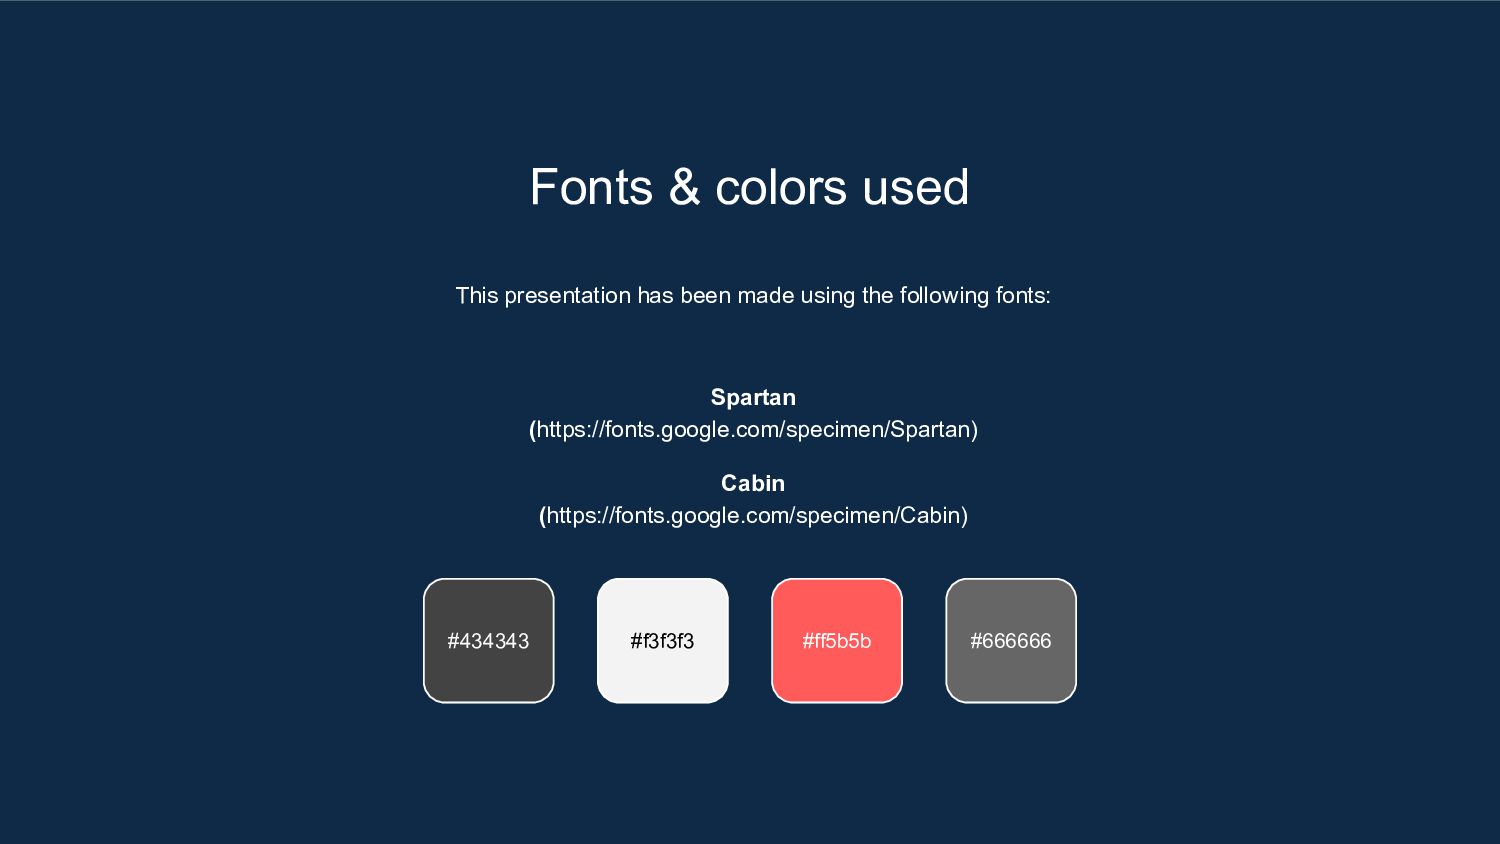
    slide structure based on a medical presentation, which you can easily adapt to your needs. For more info on how to edit the template, please visit Slidesgo School or read our FAQs. 2. An assortment of graphic resources that are suitable for use in the presentation can be found in the alternative resources slide. 3. A thanks slide, which you must keep so that proper credits for our design are given. 4. A resources slide, where you’ll find links to all the elements used in the template. 5. Instructions for use. 6. Final slides with: • The fonts and colors used in the template. • A selection of illustrations. You can also customize and animate them as you wish with the online editor. Visit Storyset to find more. • More infographic resources, whose size and color can be edited. • Sets of customizable icons of the following themes: general, business, avatar, creative process, education, help & support, medical, nature, performing arts, SEO & marketing, and teamwork. You can delete this slide when you’re done editing the presentation. CONTENTS OF THIS TEMPLATE