Upgrade to Pro — share decks privately, control downloads, hide ads and more …

Introduction to rendering performance

Sponsored · Your Podcast. Everywhere. Effortlessly. Share. Educate. Inspire. Entertain. You do you. We'll handle the rest.
Avatar for Håkan Rosenhorn Håkan Rosenhorn
March 06, 2015
170

Introduction to rendering performance

Talk given at Uppsala.js #6 http://www.meetup.com/Uppsalajs/events/220185891/

I cover rendering basics from a Chrome perspective. I also use the Chrome tracing tool on jula.se to visualize layers and paints.

Avatar for Håkan Rosenhorn

Håkan Rosenhorn

March 06, 2015
Tweet

Transcript

  1. → Browser works with frames → Tries to stay in

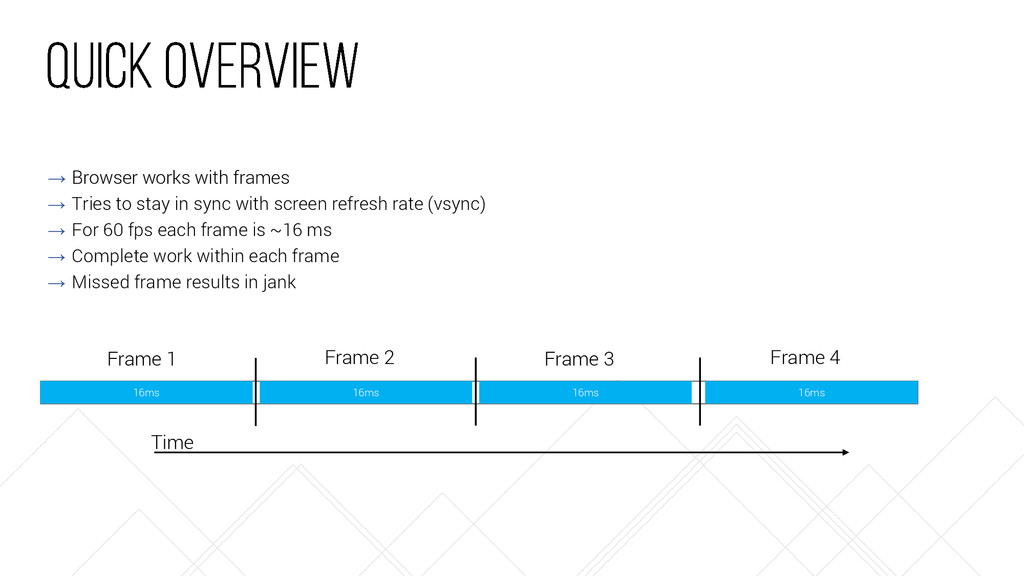
    sync with screen refresh rate (vsync) → For 60 fps each frame is ~16 ms → Complete work within each frame → Missed frame results in jank 16ms 16ms 16ms 16ms Time Frame 1 Frame 2 Frame 3 Frame 4
  2. → Run JavaScript → Calculate styles → Perform layout →

    Paint → Composite Scripting Recalc style Composit Paint 16ms 16ms Scripting Recalc style Composit Paint Time
  3. → Doing animations with setTimeout or setInterval → Doing to

    much scripting (wheel, mousemove etc) → Event handlers → XHR requests → Garbage collection → Blowing the frame budget
  4. → Breaks up the page in smaller pieces → Be

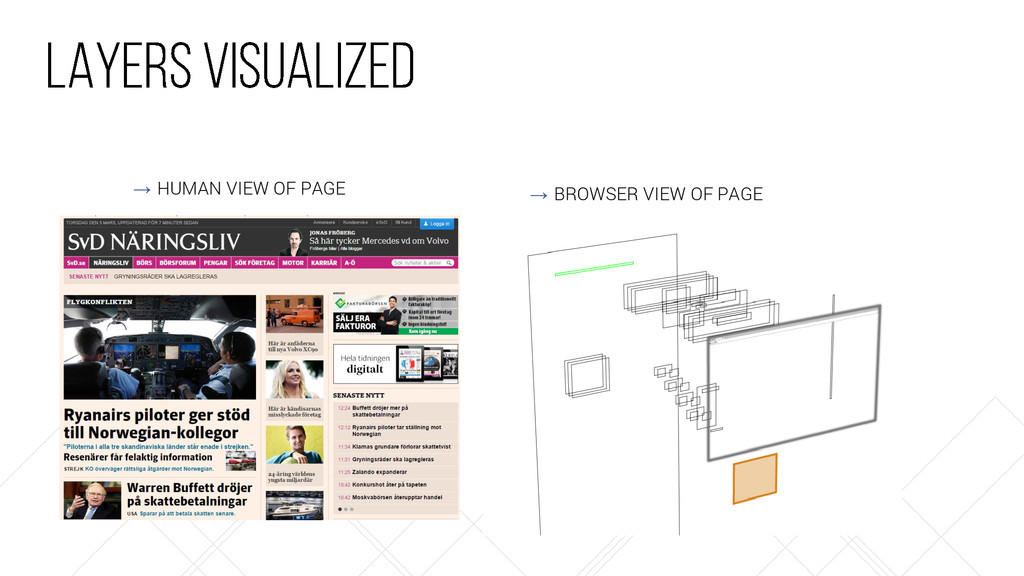
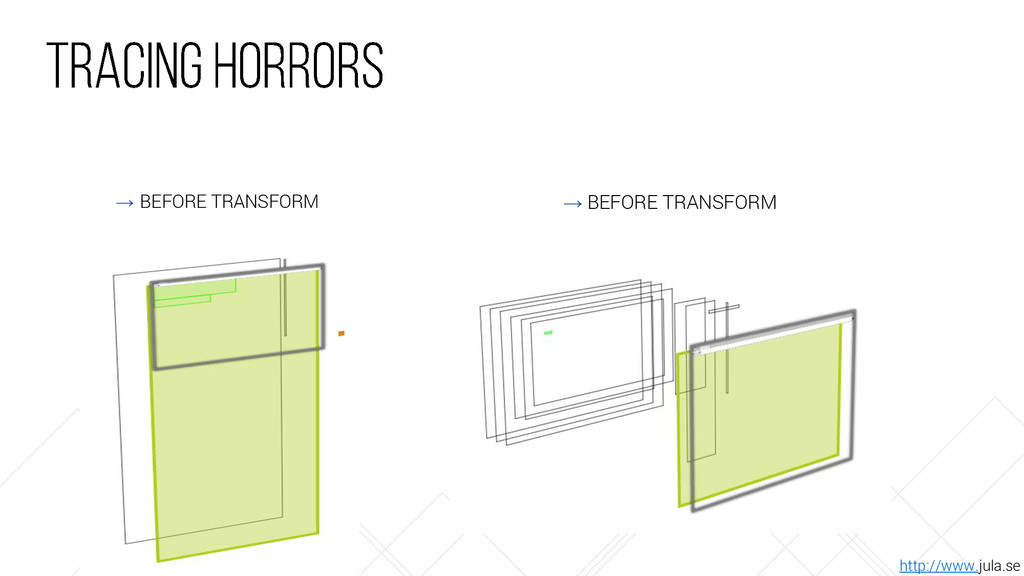
    more GPU friendly → Each layer is painted individually → Uploaded as texture to the GPU → Will not repaint unless modified → Key to performant animations
  5. → <video> and <canvas> elements → Elements with accelerated css

    filters → 3D or perspective transform CSS properties → translateZ anyone? → Too many layers also cause problems
  6. → Hardcore debugging tool → Used by Chrome devs to

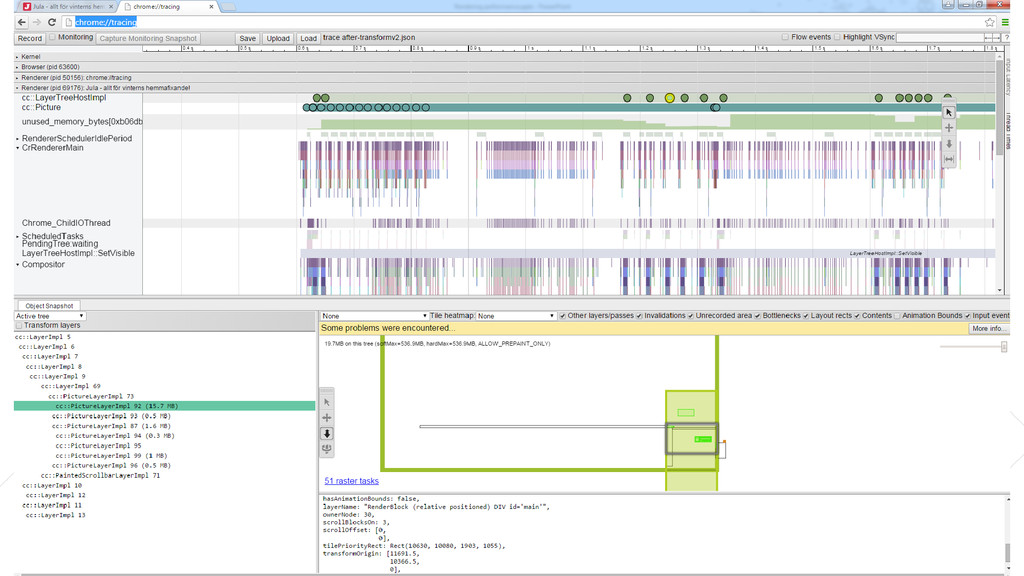
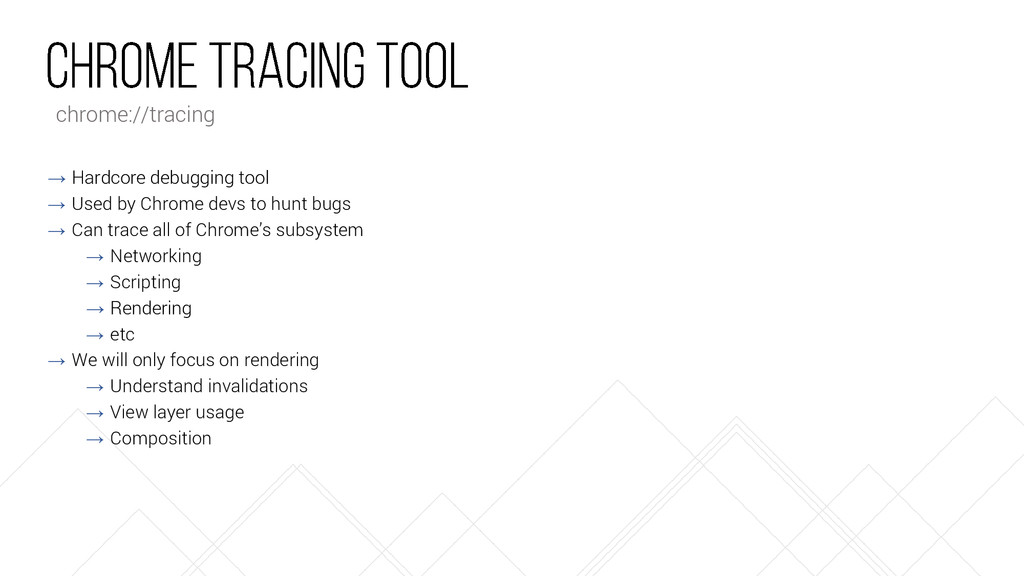
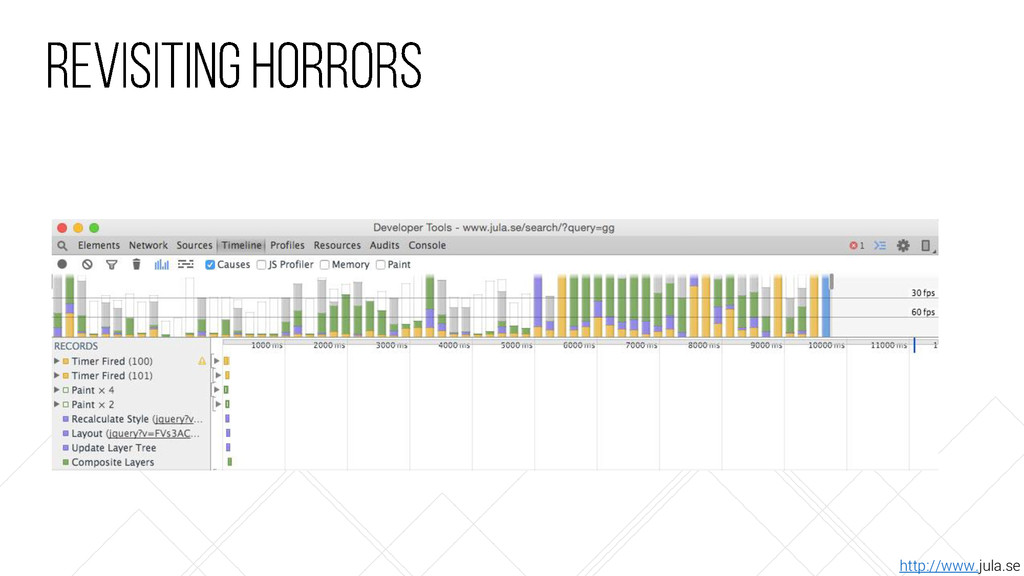
    hunt bugs → Can trace all of Chrome’s subsystem → Networking → Scripting → Rendering → etc → We will only focus on rendering → Understand invalidations → View layer usage → Composition chrome://tracing