Upgrade to Pro — share decks privately, control downloads, hide ads and more …

Do you know what you're users and infrastructure get upto?

Do you know what you're users and infrastructure get upto?

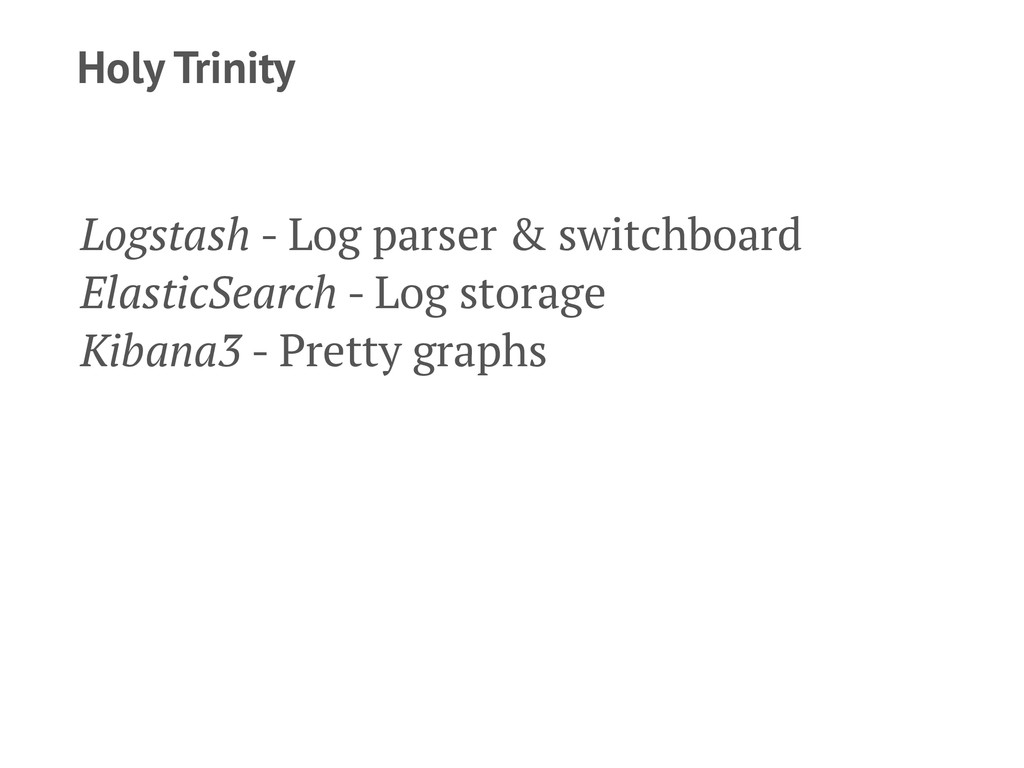
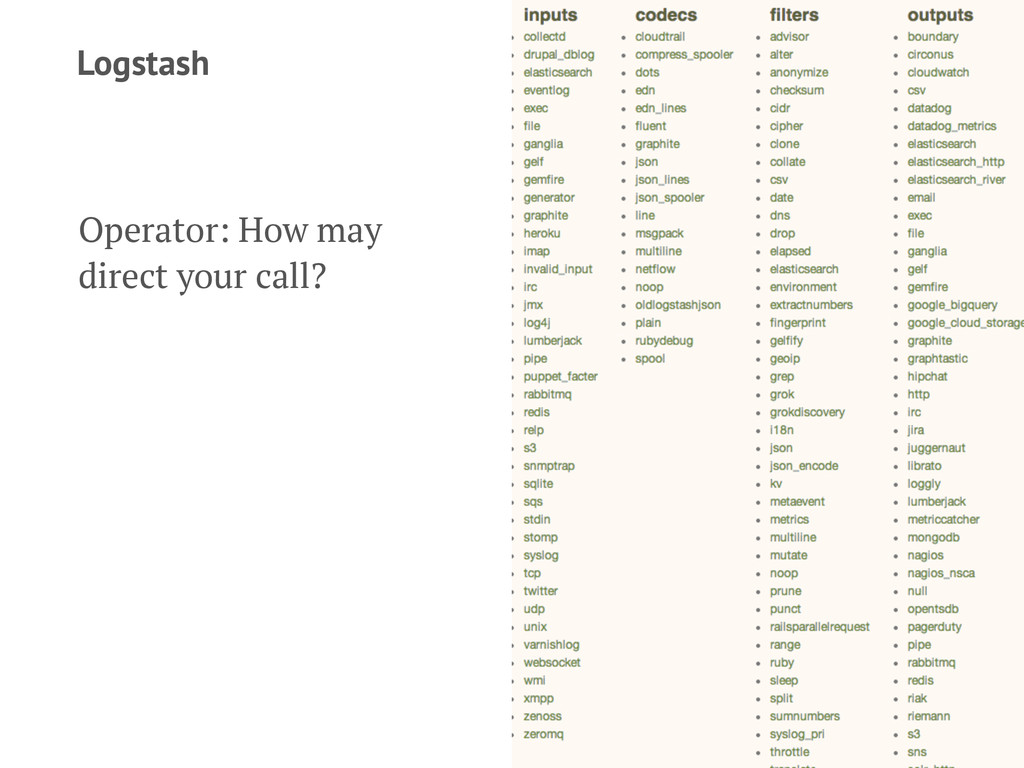
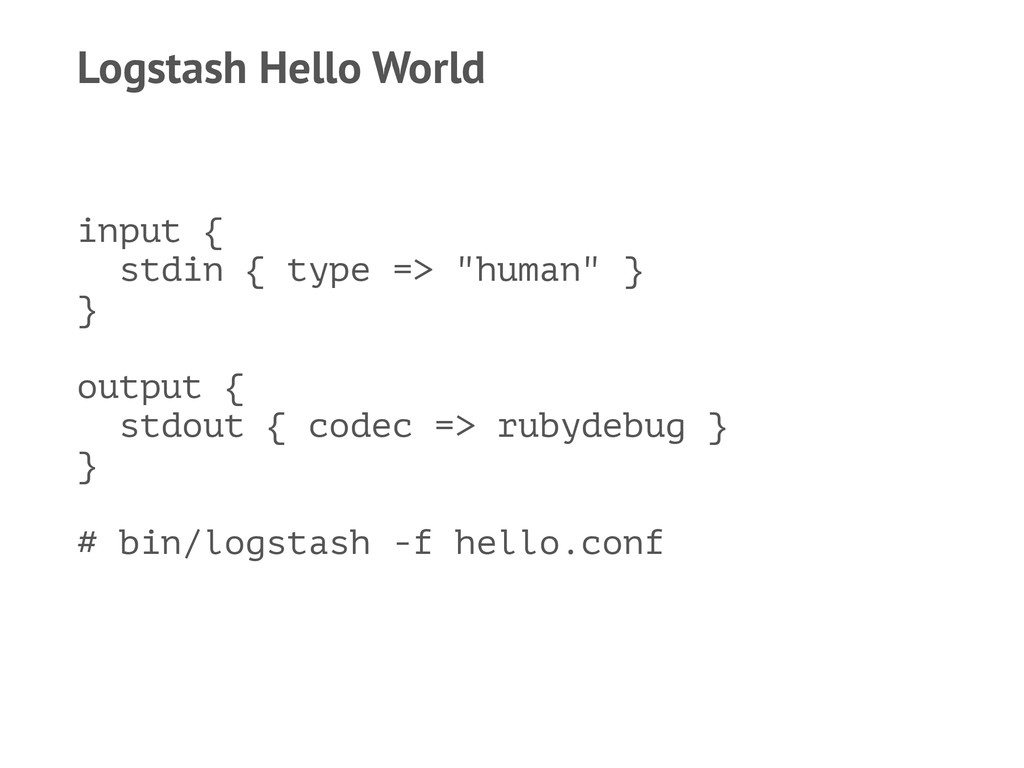
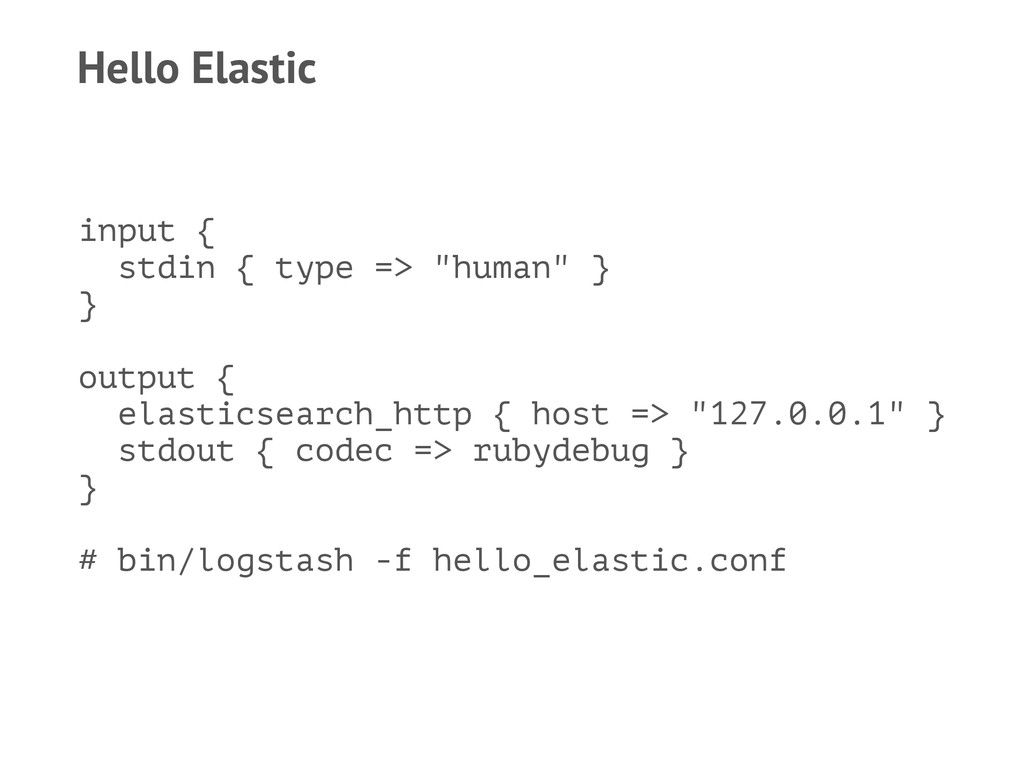
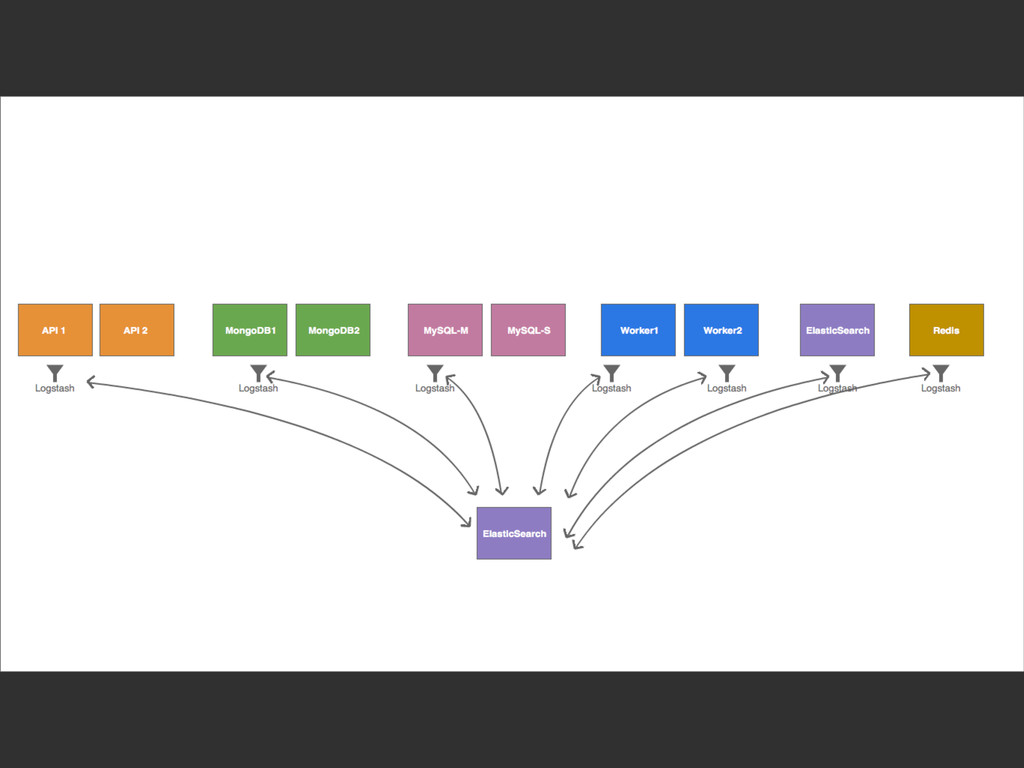
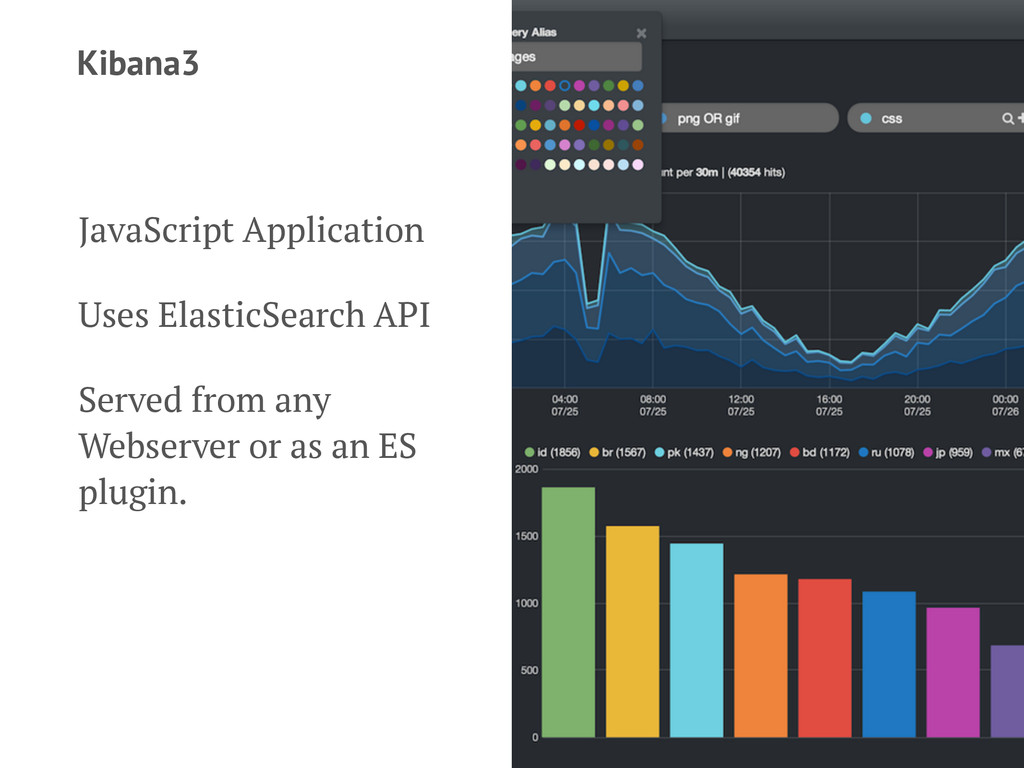
A TechMeetup talk discussing how to setup of log visualization solution using Logstash, ElasticSearch, and Kibana3.

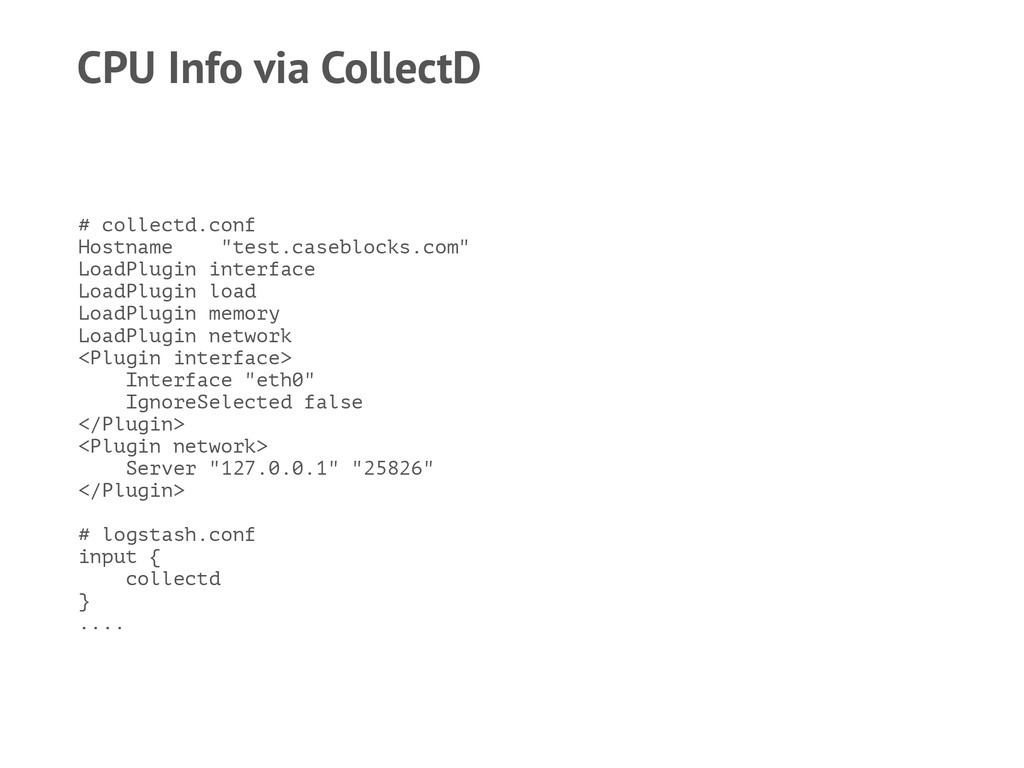
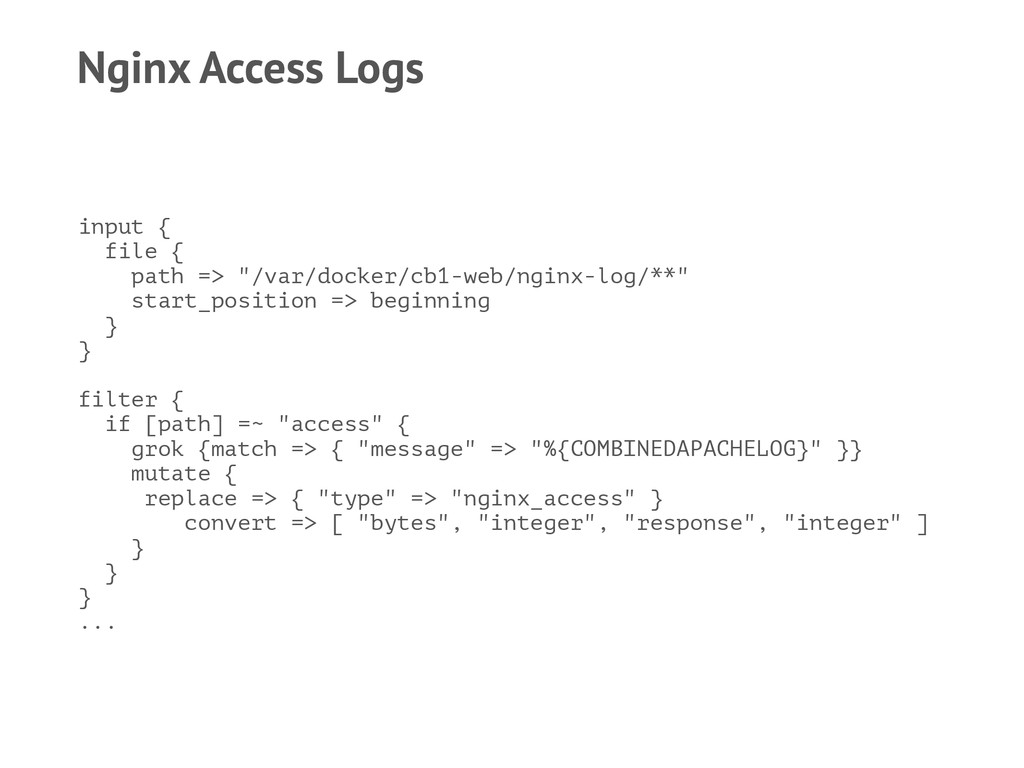
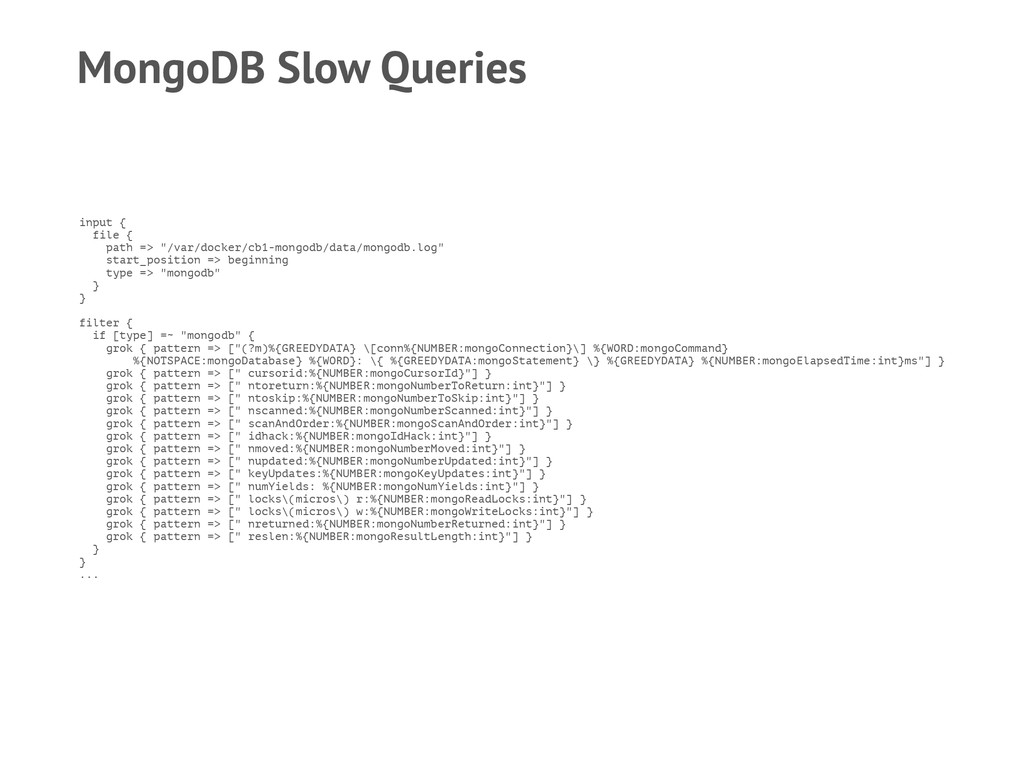
Includes examples for common sources such as Nginx, Collectd, etc.

Presented at Glasgow Techmeetup at 23/4/2014.

Ijonas Kisselbach

April 23, 2014
Tweet

Other Decks in Technology

Transcript

  1. Logstash Hello World input { stdin { type => "human"

    } } output { stdout { codec => rubydebug } } # bin/logstash -f hello.conf
  2. Hello Elastic input { stdin { type => "human" }

    } output { elasticsearch_http { host => "127.0.0.1" } stdout { codec => rubydebug } } # bin/logstash -f hello_elastic.conf
  3. CPU Info via CollectD # collectd.conf Hostname "test.caseblocks.com" LoadPlugin interface

    LoadPlugin load LoadPlugin memory LoadPlugin network <Plugin interface> Interface "eth0" IgnoreSelected false </Plugin> <Plugin network> Server "127.0.0.1" "25826" </Plugin> # logstash.conf input { collectd } ....
  4. Nginx Access Logs input { file { path => "/var/docker/cb1-web/nginx-log/**"

    start_position => beginning } } filter { if [path] =~ "access" { grok {match => { "message" => "%{COMBINEDAPACHELOG}" }} mutate { replace => { "type" => "nginx_access" } convert => [ "bytes", "integer", "response", "integer" ] } } } ...
  5. MongoDB Slow Queries input { file { path => "/var/docker/cb1-mongodb/data/mongodb.log"

    start_position => beginning type => "mongodb" } } filter { if [type] =~ "mongodb" { grok { pattern => ["(?m)%{GREEDYDATA} \[conn%{NUMBER:mongoConnection}\] %{WORD:mongoCommand} %{NOTSPACE:mongoDatabase} %{WORD}: \{ %{GREEDYDATA:mongoStatement} \} %{GREEDYDATA} %{NUMBER:mongoElapsedTime:int}ms"] } grok { pattern => [" cursorid:%{NUMBER:mongoCursorId}"] } grok { pattern => [" ntoreturn:%{NUMBER:mongoNumberToReturn:int}"] } grok { pattern => [" ntoskip:%{NUMBER:mongoNumberToSkip:int}"] } grok { pattern => [" nscanned:%{NUMBER:mongoNumberScanned:int}"] } grok { pattern => [" scanAndOrder:%{NUMBER:mongoScanAndOrder:int}"] } grok { pattern => [" idhack:%{NUMBER:mongoIdHack:int}"] } grok { pattern => [" nmoved:%{NUMBER:mongoNumberMoved:int}"] } grok { pattern => [" nupdated:%{NUMBER:mongoNumberUpdated:int}"] } grok { pattern => [" keyUpdates:%{NUMBER:mongoKeyUpdates:int}"] } grok { pattern => [" numYields: %{NUMBER:mongoNumYields:int}"] } grok { pattern => [" locks\(micros\) r:%{NUMBER:mongoReadLocks:int}"] } grok { pattern => [" locks\(micros\) w:%{NUMBER:mongoWriteLocks:int}"] } grok { pattern => [" nreturned:%{NUMBER:mongoNumberReturned:int}"] } grok { pattern => [" reslen:%{NUMBER:mongoResultLength:int}"] } } } ...
  6. Next Steps for EmergeAdapt Remove NewRelic - $199 Remove Honeybadger

    - $39 Annual saving - $3000 More application metrics Browser-level metrics Alerts - logstash -> Hipchat
  7. How do I get started ? 1. Logstash 'Getting Started'

    Tutorial 2. Watch the Kibana3 videos 3. Get your production Nginx/Apache log into Kibana3 4. Build some dashboards Total time: a lazy day Total time to production: 1 week