Upgrade to Pro — share decks privately, control downloads, hide ads and more …

Too Much Information (Demasiada información)

Too Much Information (Demasiada información)

programmer-journalist smarts are indispensable

Jacqui Maher

August 29, 2013
Tweet

Other Decks in Technology

Transcript

  1. Welcome! Bienvenido! to Hacks/Hackers Buenos Aires Friday, September 6, 13

    THANK YOU MARIANO FOR INVITING ME, THANK YOU ALL FOR LISTENING TO ME YAMMER ON STAGE.
  2. 28 August 2013 Too Much Information programmer-journalist smarts are indispensable

    Friday, September 6, 13 here to talk to you about TMI, or why programmer-journalist smarts are indispensable
  3. 28 August 2013 Demasiada información programmer-journalist smarts are indispensable -

    en español Friday, September 6, 13 that is, dez-mahs-eee-ah-da informacion, pourque programmer-journo smarts are indispensable (en espanol)
  4. Hi! Interactive News at The New York Times Friday, September

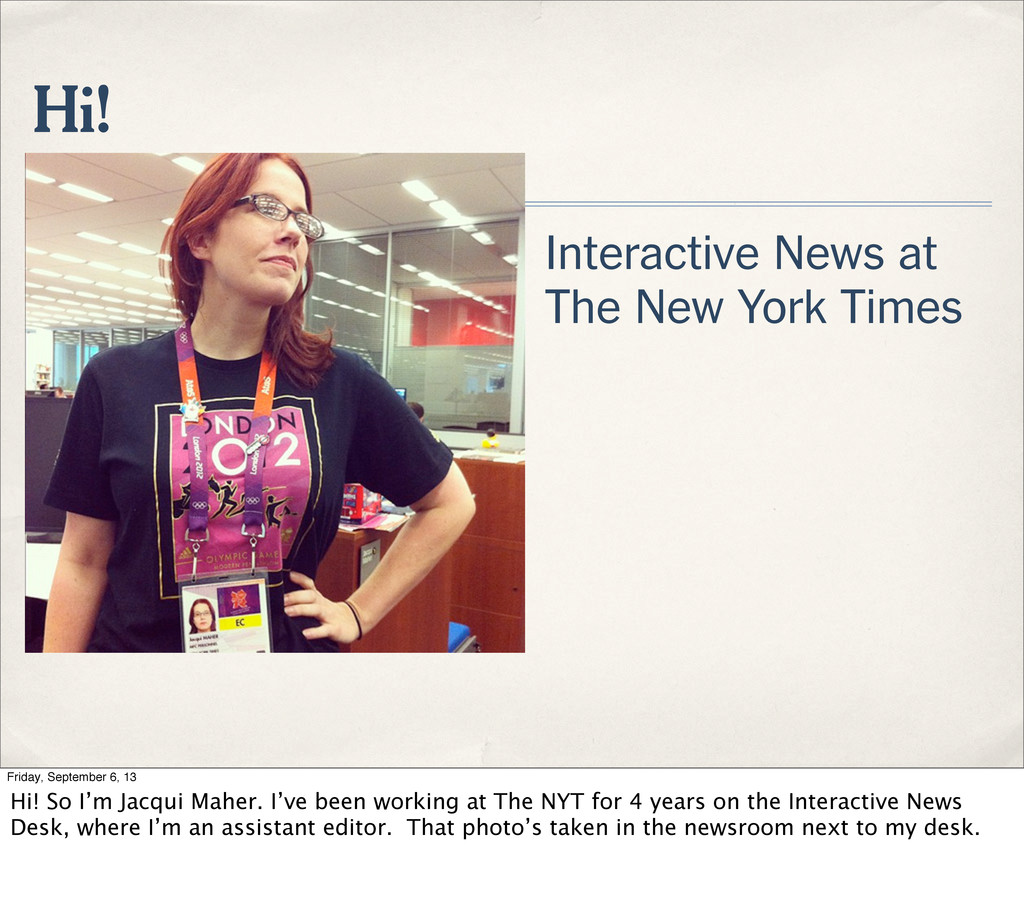
    6, 13 Hi! So I’m Jacqui Maher. I’ve been working at The NYT for 4 years on the Interactive News Desk, where I’m an assistant editor. That photo’s taken in the newsroom next to my desk.
  5. HACKERS Friday, September 6, 13 Show of hands: who’s programmer?

    designer? reporter? a mix of any of those? TALK ABOUT YOUR BACKGROUND: WHO AM I?
  6. HACKS Friday, September 6, 13 Who are we? We are

    hacks and hackers. show of hands: who’s programmer? designer? reporter? a mix of any of those? none?
  7. INFORMACIÒN Friday, September 6, 13 What do we want? Information.

    OK, informacion :) News, obviously, data, evidence to back up stories, we want freedom of information.
  8. OBAMA’S NIGHT Friday, September 6, 13 We do this for

    elections, showing the breakdown of votes across party lines and parts of gov’t
  9. Friday, September 6, 13 Get creative about complex narratives that

    would be hard to convey in blocks of text, like the hundreds of paths a candidate could take to victory.
  10. Friday, September 6, 13 Or how much more amazing an

    athlete breaking a world record is by showing how long that record stood.
  11. TMI? Friday, September 6, 13 so these are ways we

    enhance the news, making information easier to parse. why? because of what I call the TMI problem - too much information.
  12. information overload time famine cognitive fatigue infoxication infobesity data asphyxiation

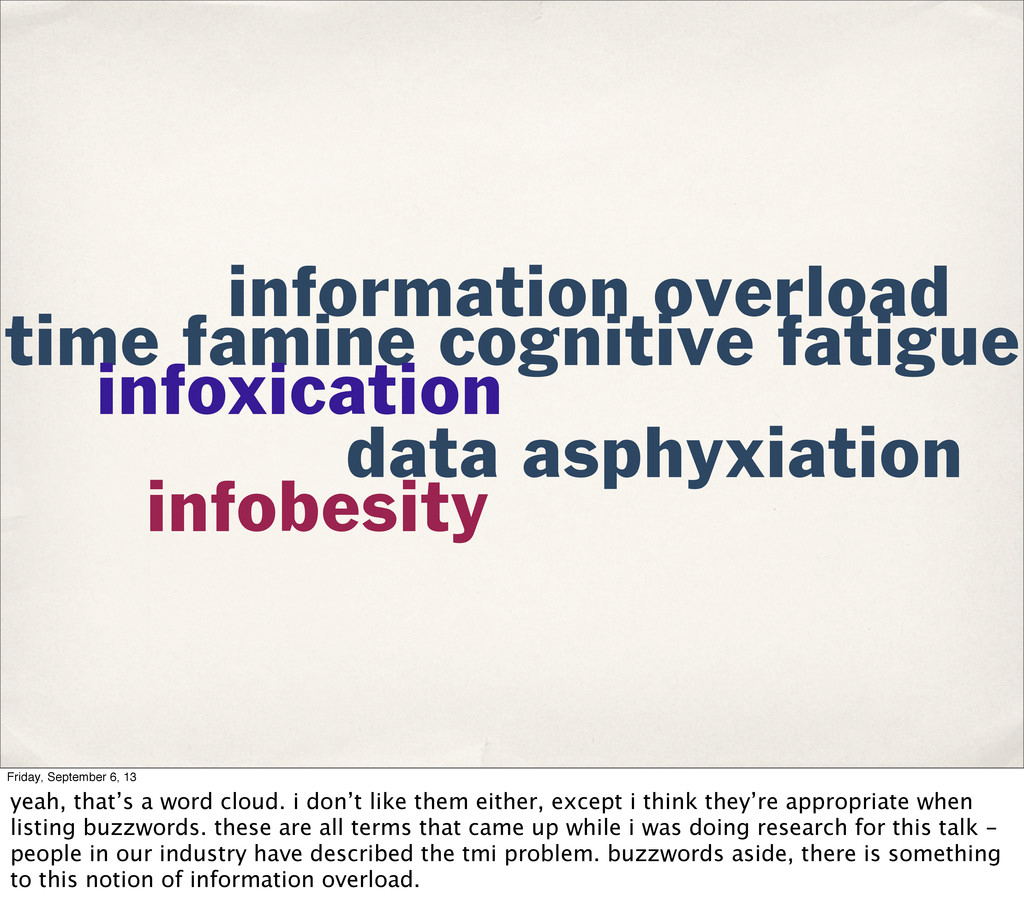
    Friday, September 6, 13 yeah, that’s a word cloud. i don’t like them either, except i think they’re appropriate when listing buzzwords. these are all terms that came up while i was doing research for this talk - people in our industry have described the tmi problem. buzzwords aside, there is something to this notion of information overload.
  13. !STFU Friday, September 6, 13 I'm not saying we should

    stop reporting, or even cut down on the amount of data that we make available to the public. We need to present and organize it better.
  14. Friday, September 6, 13 NOT SAYING WE NEED TO DO

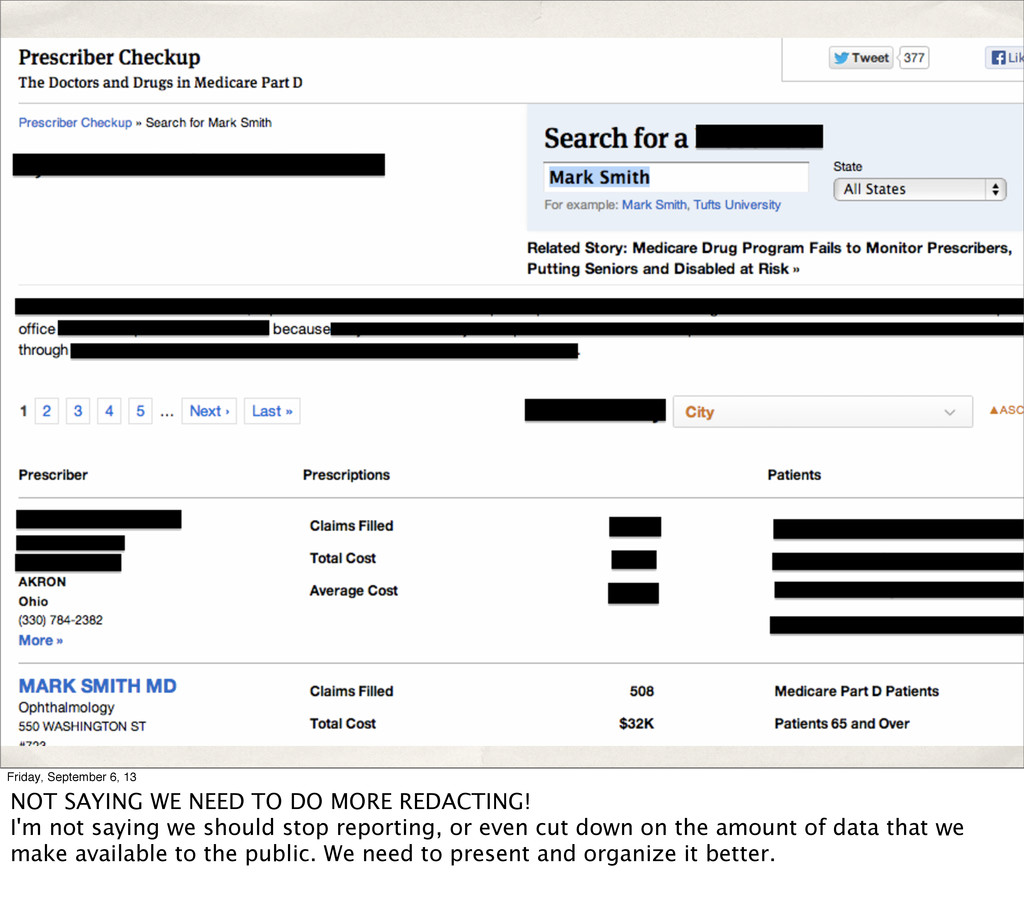
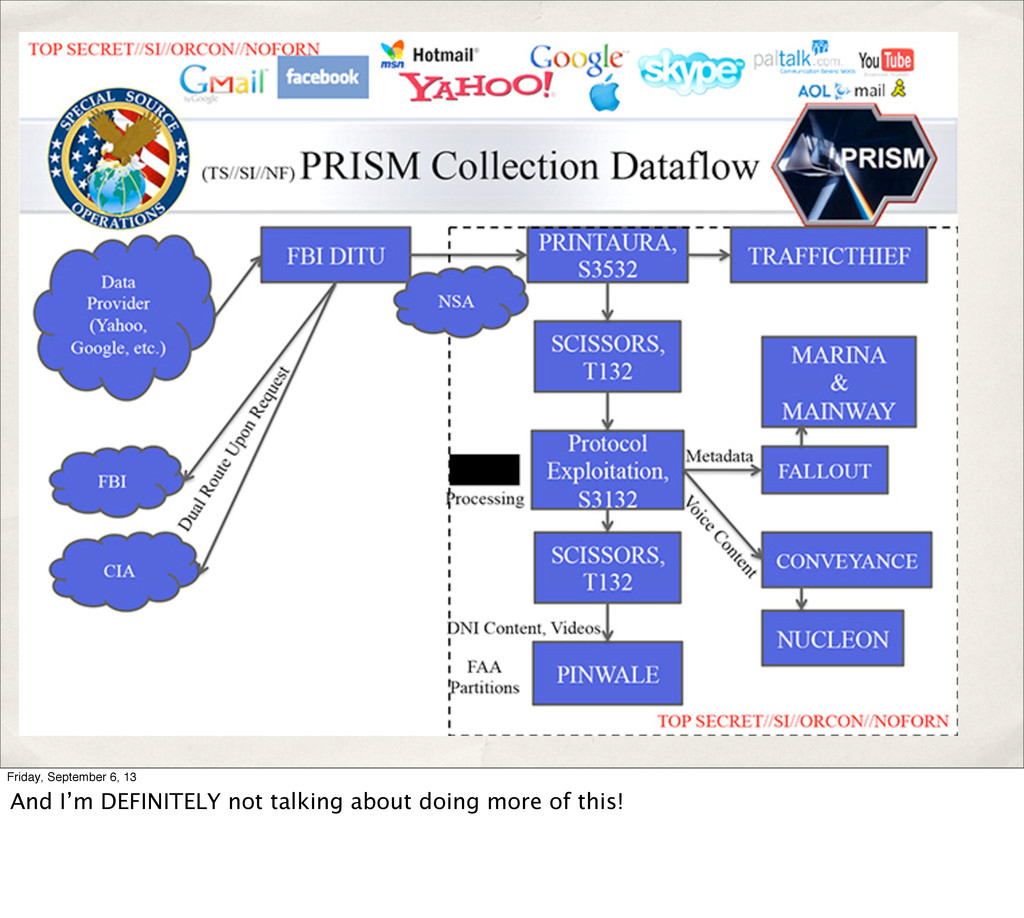
    MORE REDACTING! I'm not saying we should stop reporting, or even cut down on the amount of data that we make available to the public. We need to present and organize it better.
  15. "The trick is to disclose information in a manner that

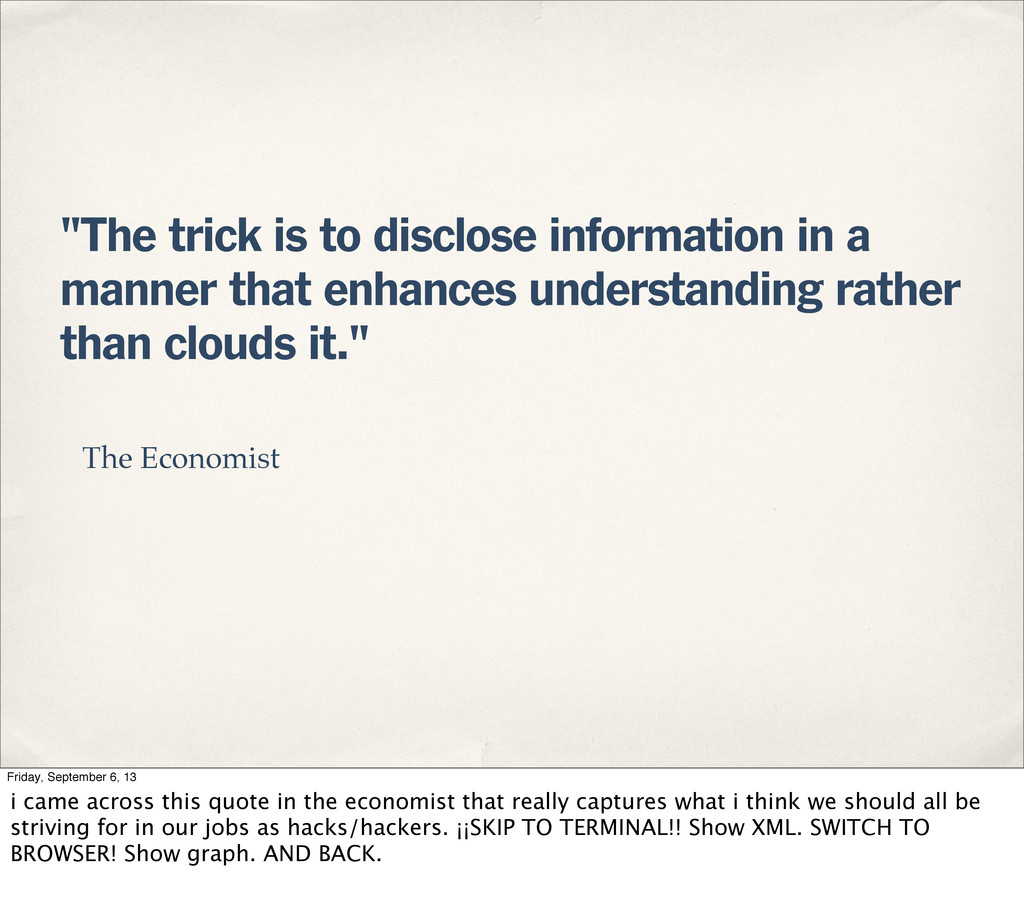
    enhances understanding rather than clouds it." The Economist Friday, September 6, 13 i came across this quote in the economist that really captures what i think we should all be striving for in our jobs as hacks/hackers. ¡¡SKIP TO TERMINAL!! Show XML. SWITCH TO BROWSER! Show graph. AND BACK.
  16. 667 exabytes source: cisco Friday, September 6, 13 there is

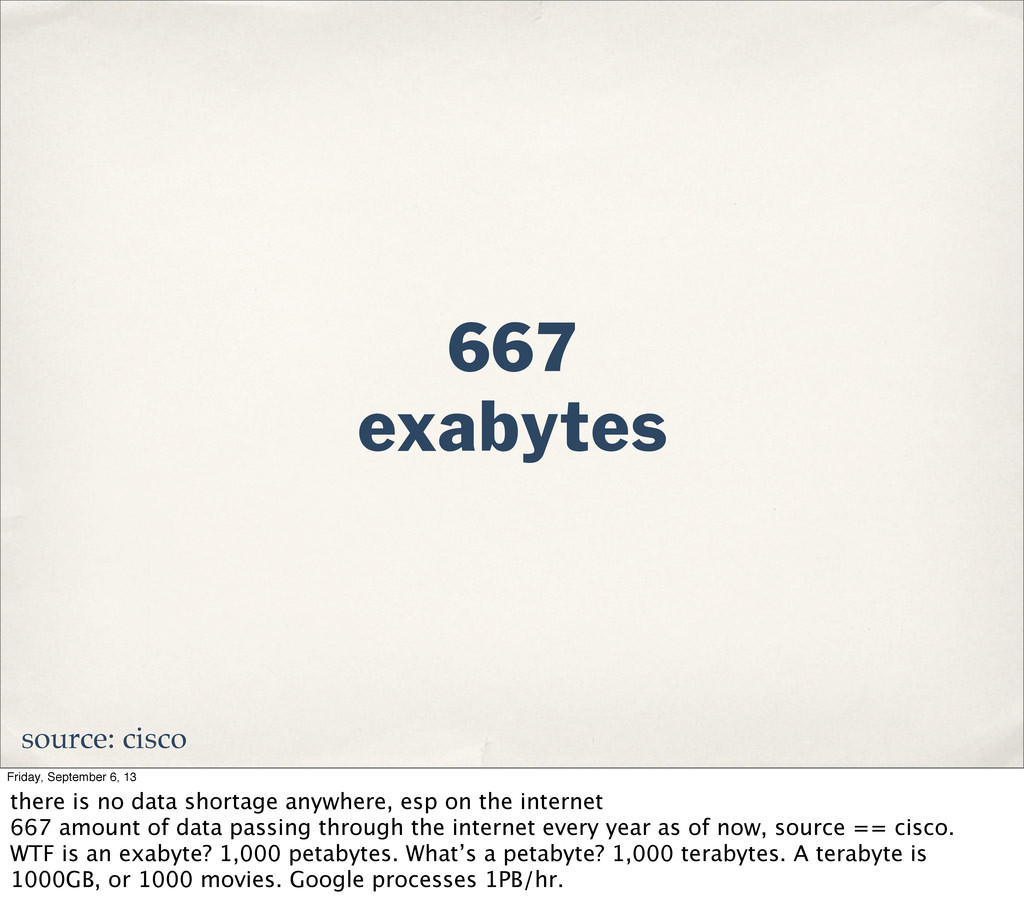
    no data shortage anywhere, esp on the internet 667 amount of data passing through the internet every year as of now, source == cisco. WTF is an exabyte? 1,000 petabytes. What’s a petabyte? 1,000 terabytes. A terabyte is 1000GB, or 1000 movies. Google processes 1PB/hr.
  17. SIGNALS, NOT NOISE Friday, September 6, 13 we don’t want

    to be just another megabyte lost in the deluge. we need our signals to be louder than the noise.
  18. London Calling Friday, September 6, 13 last year i was

    sent to London to cover the Summer Games. As you can see, there were terrible monsters in the Olympic Park :)
  19. Friday, September 6, 13 the biggest dataset i’ve ever worked

    with was for the past summer olympics in london. there was so much xml, some of which you just saw fly by.
  20. Friday, September 6, 13 OVERALL I THINK WE DID A

    GOOD JOB, BUT SOMETIMES WE ENDED UP WITH THESE TABLES OF... NUMBERS.
  21. Friday, September 6, 13 AND WHAT THE NUMBERS WERE TRYING

    TO CONVEY WAS COMPLEX. SOMETIMES POINTS, SOMETIMES DISTANCE, AND IT VARIED WITHIN EVEN A SINGLE ATHLETE’S RESULT IN ONE ROUND.
  22. Friday, September 6, 13 this is how the IOC showed

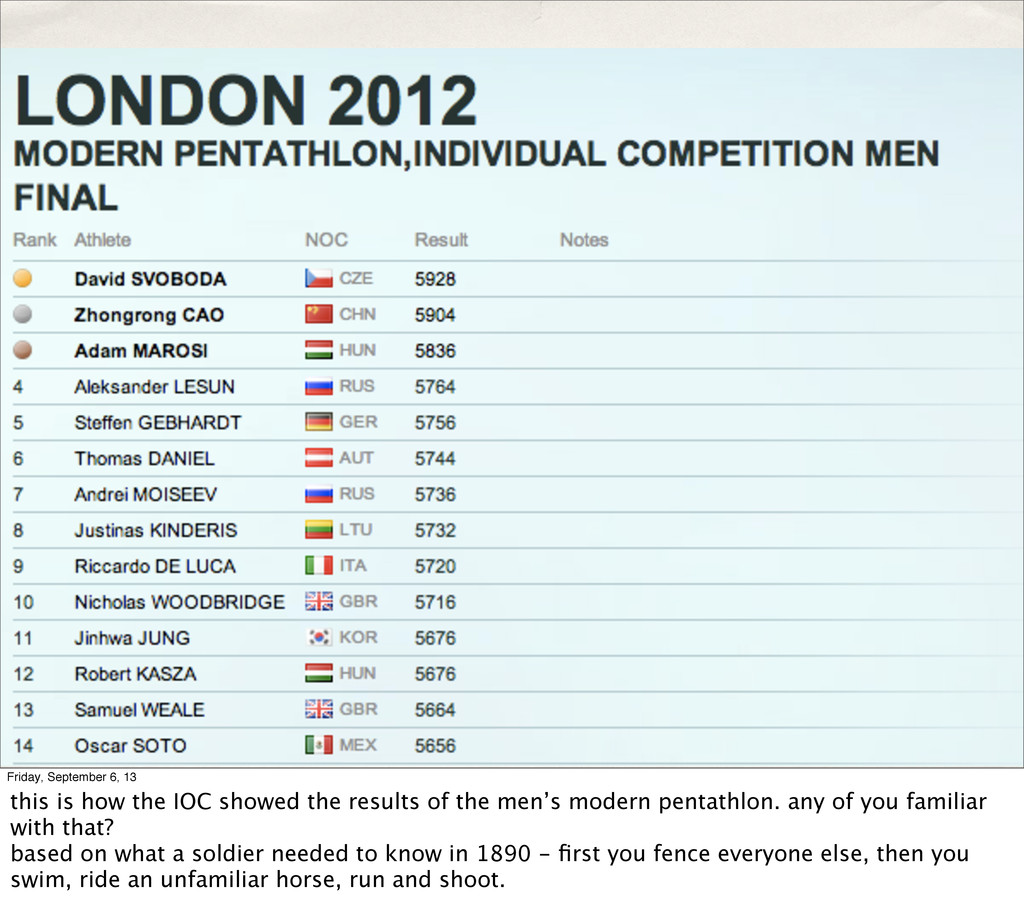
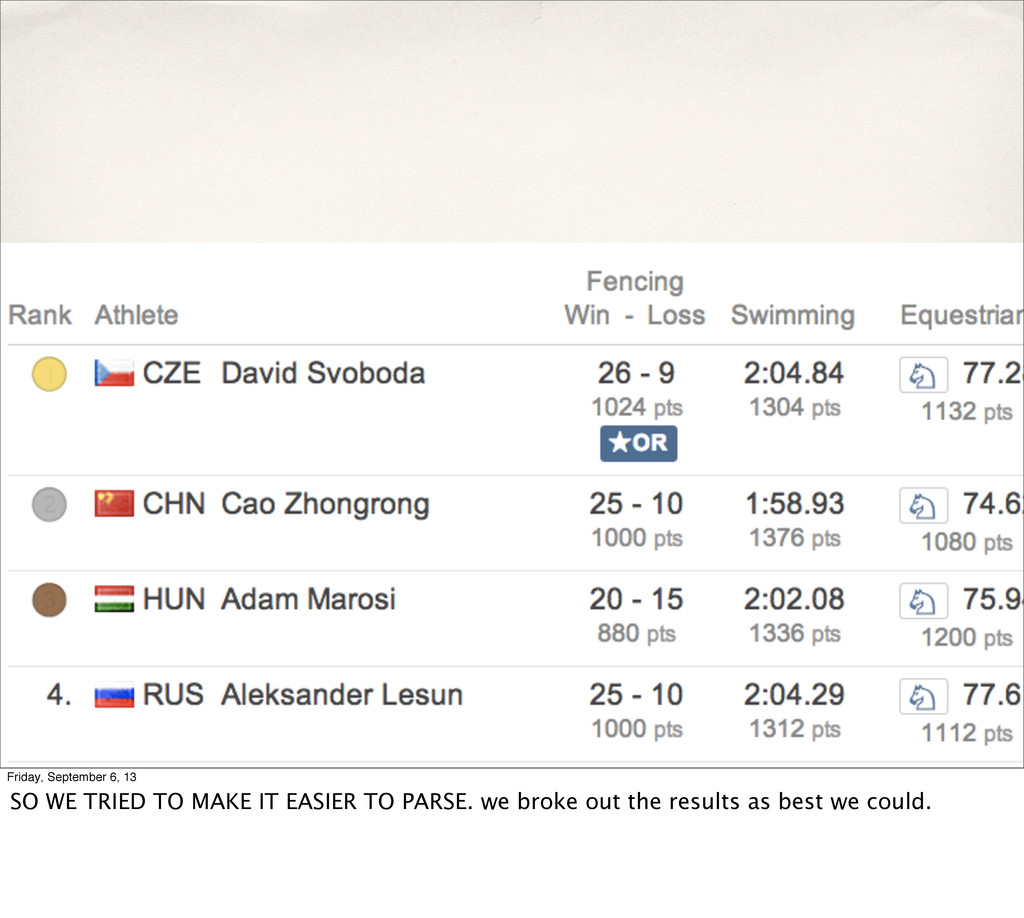
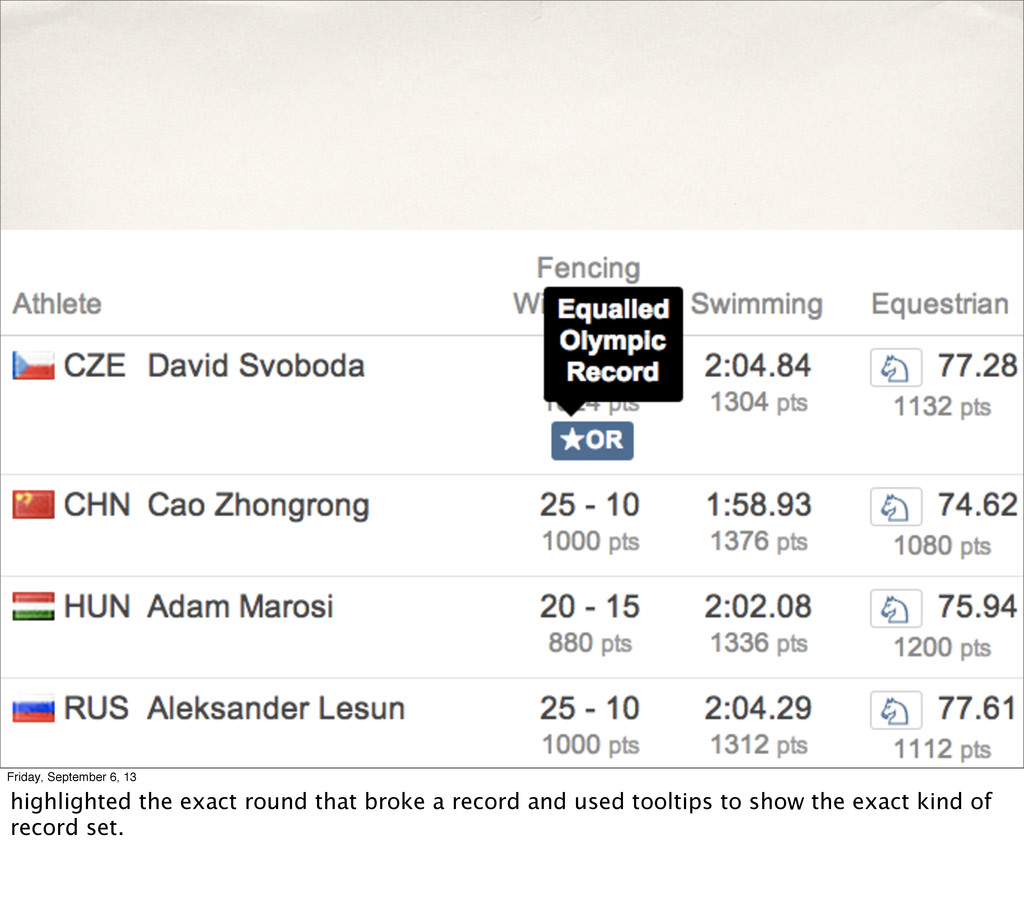
    the results of the men’s modern pentathlon. any of you familiar with that? based on what a soldier needed to know in 1890 - first you fence everyone else, then you swim, ride an unfamiliar horse, run and shoot.
  23. Friday, September 6, 13 SO WE TRIED TO MAKE IT

    EASIER TO PARSE. we broke out the results as best we could.
  24. Friday, September 6, 13 highlighted the exact round that broke

    a record and used tooltips to show the exact kind of record set.
  25. Friday, September 6, 13 and my favorite, we took this

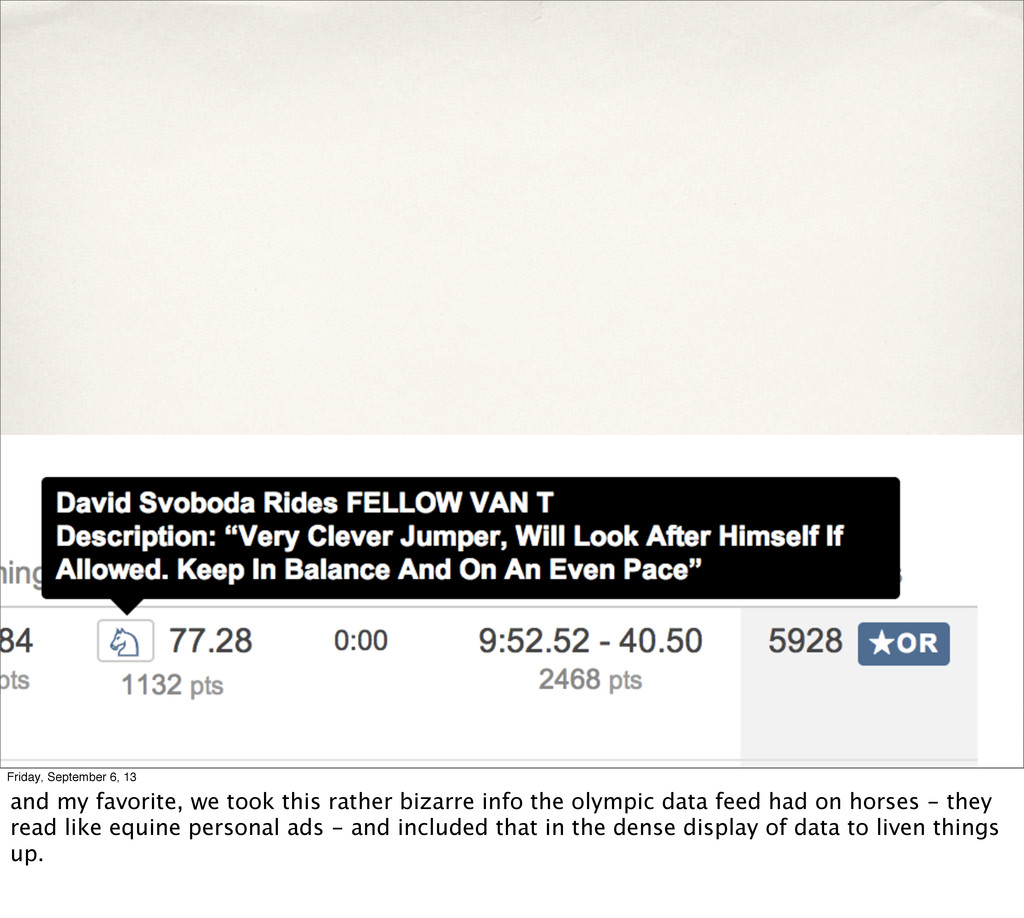
    rather bizarre info the olympic data feed had on horses - they read like equine personal ads - and included that in the dense display of data to liven things up.
  26. Friday, September 6, 13 we experimented with ways of displaying

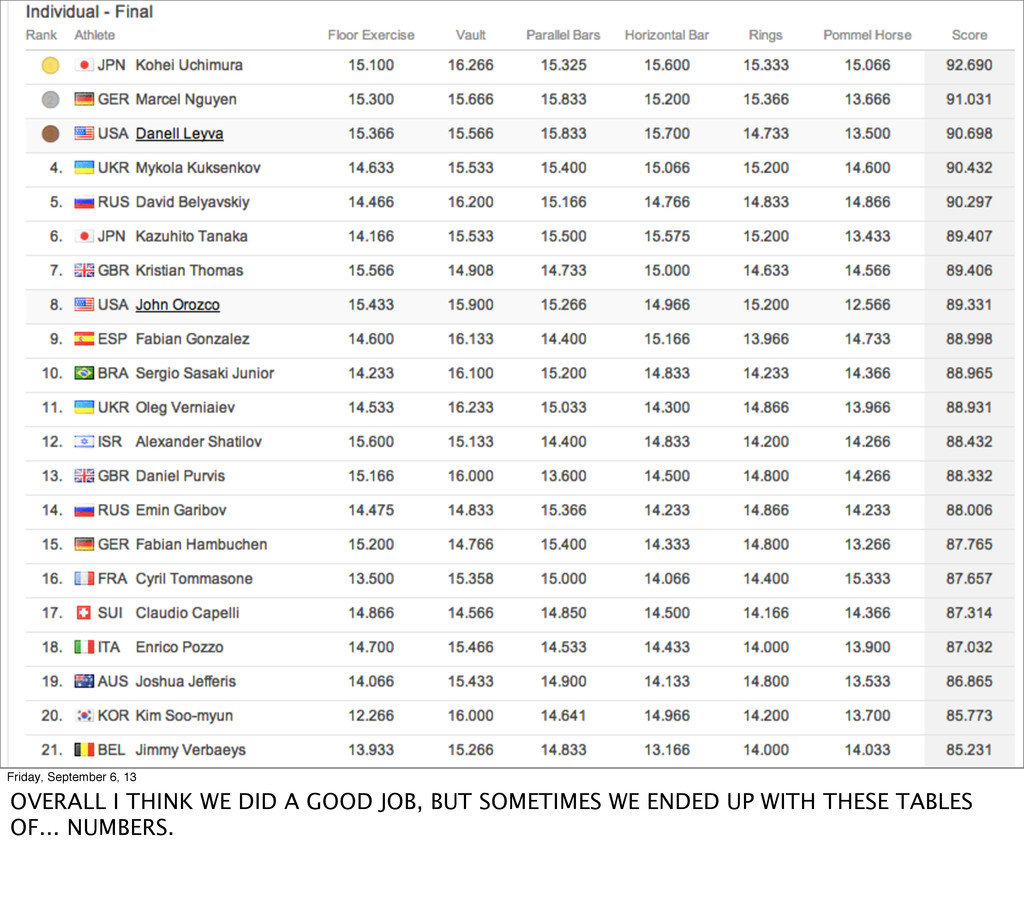
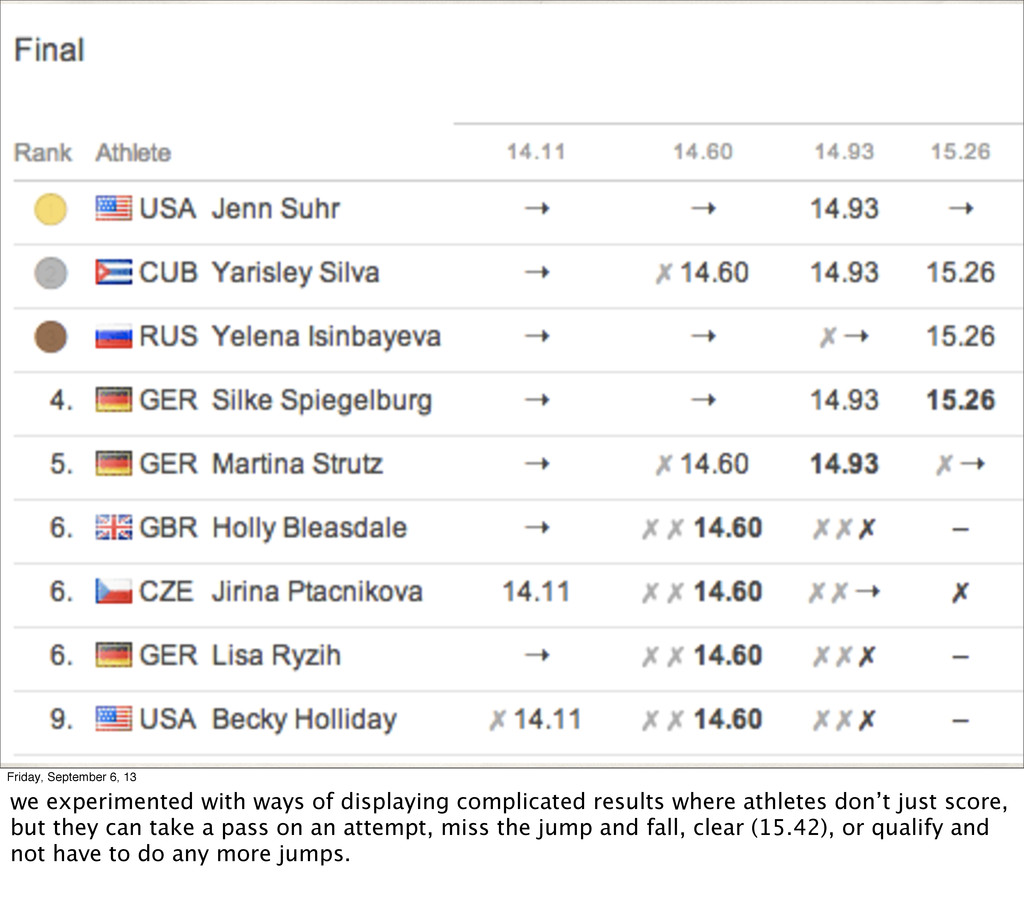
    complicated results where athletes don’t just score, but they can take a pass on an attempt, miss the jump and fall, clear (15.42), or qualify and not have to do any more jumps.