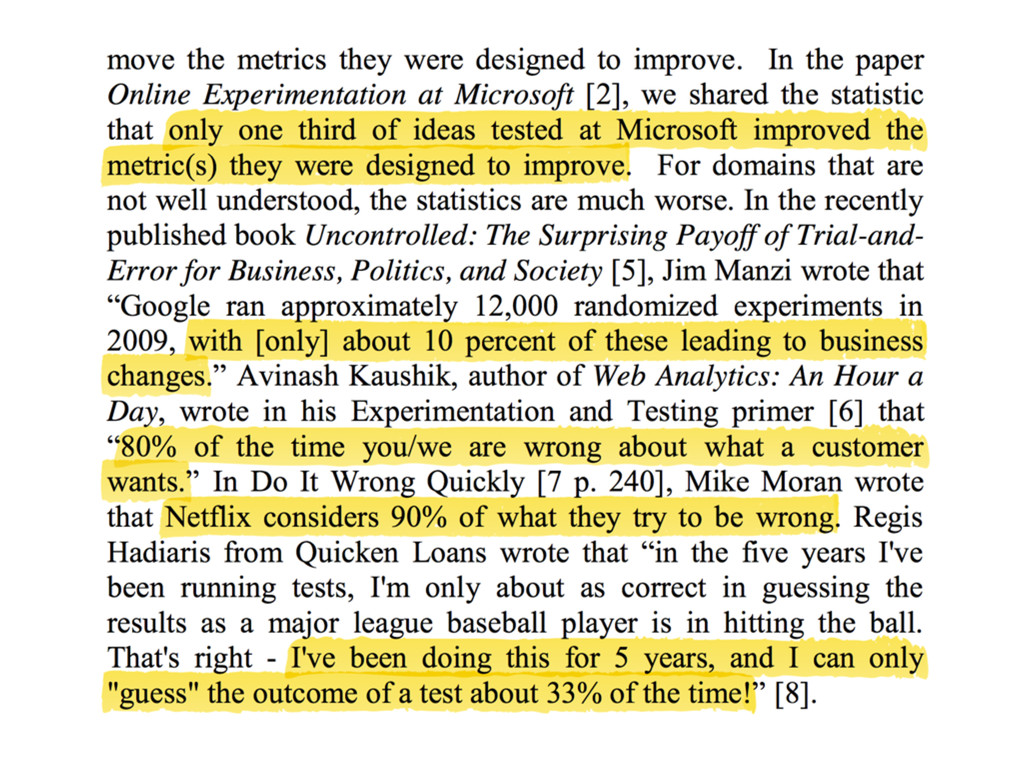
Out of our active users how many are new? How many are returning? Where do they come from? Do they have paid accounts? What are they here to do? • How many new users are we retaining? Which actions are early indications of retention? Which types of users are most likely to be successful? • What is our Customer Lifetime Value (CLV)? Which customers will upgrade next month? Which will leave?
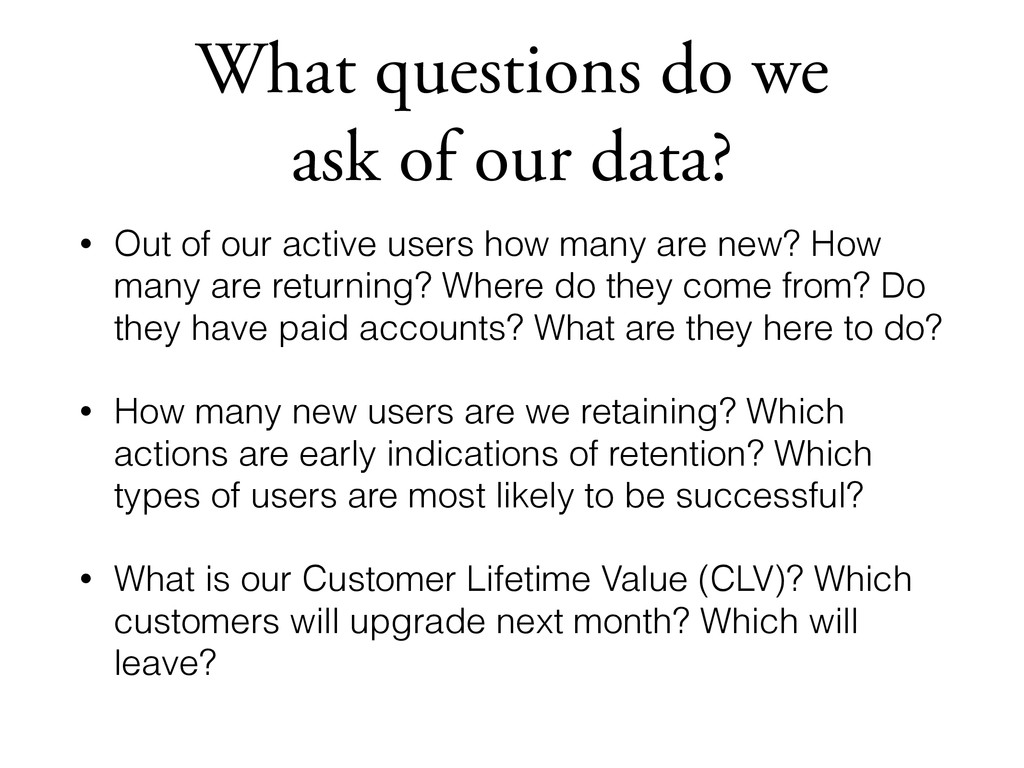
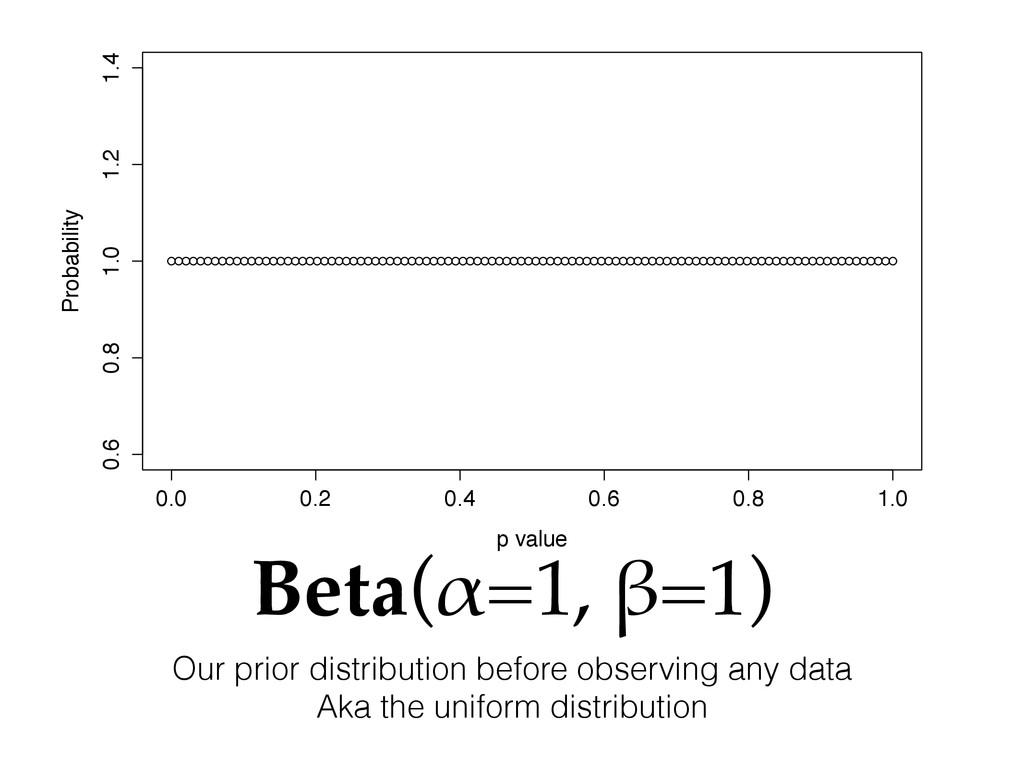
with probability p else 0, written Bernoulli(p) • We are going to estimate the distribution of the parameter p itself based on observed samples x1 , x2 , x3 , …, xn ! • The conjugate prior for the Bernoulli distribution is the beta distribution. • Conjugate priors are algebraic closed forms for estimating distribution parameters using only a fixed memory summary of the sample data
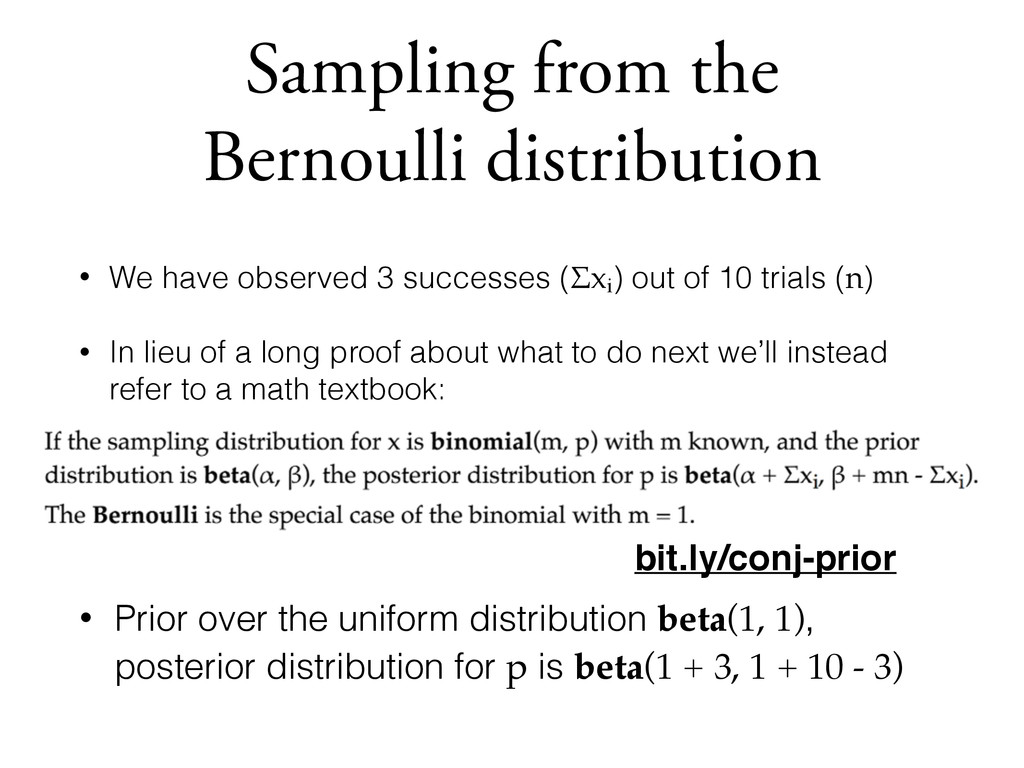
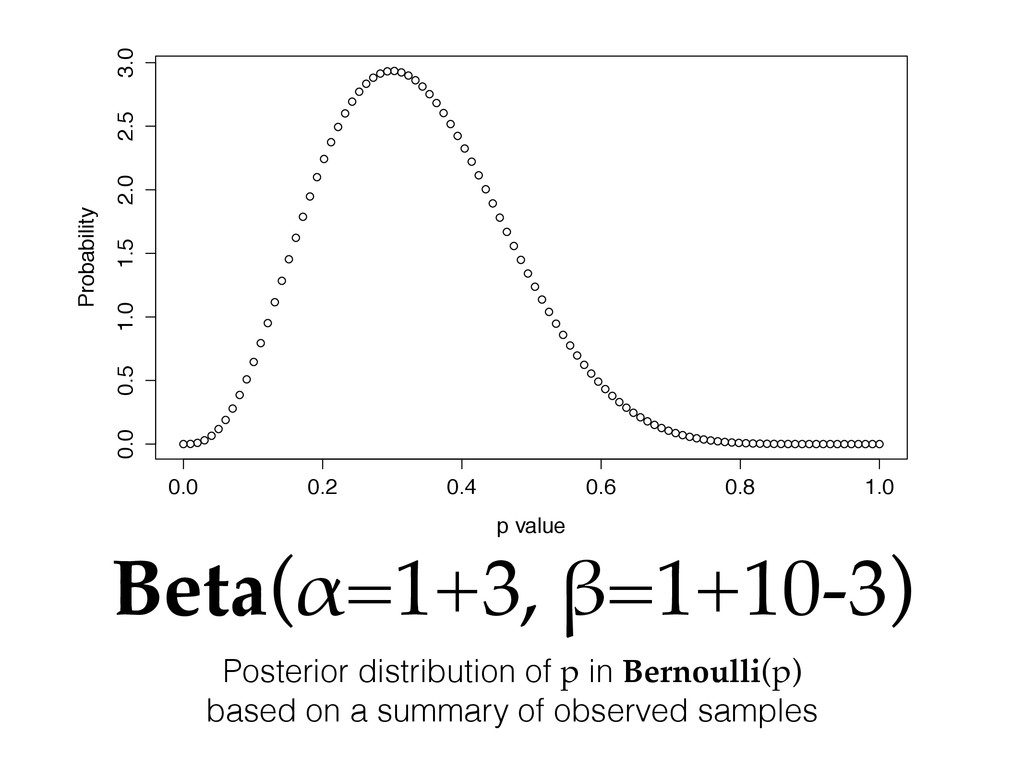
successes (Σxi ) out of 10 trials (n) • In lieu of a long proof about what to do next we’ll instead refer to a math textbook: bit.ly/conj-prior • Prior over the uniform distribution beta(1, 1), posterior distribution for p is beta(1 + 3, 1 + 10 - 3)
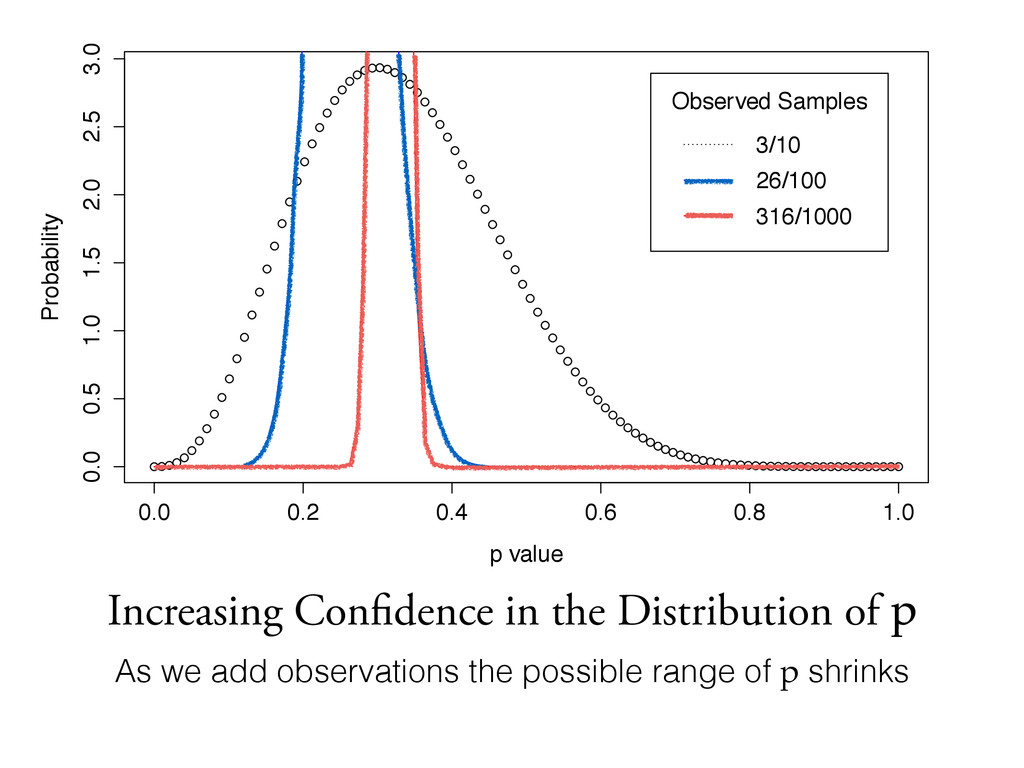
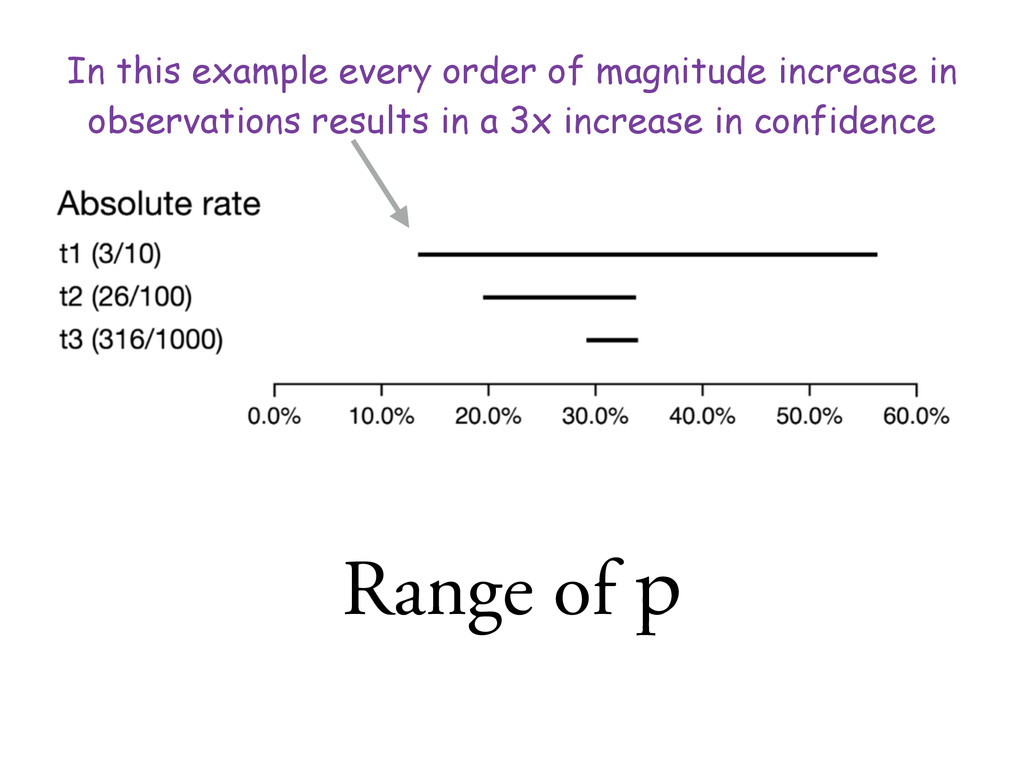
observations the possible range of p shrinks 0.0 0.2 0.4 0.6 0.8 1.0 0.0 0.5 1.0 1.5 2.0 2.5 3.0 p value Probability Observed Samples 3/10 26/100 316/1000
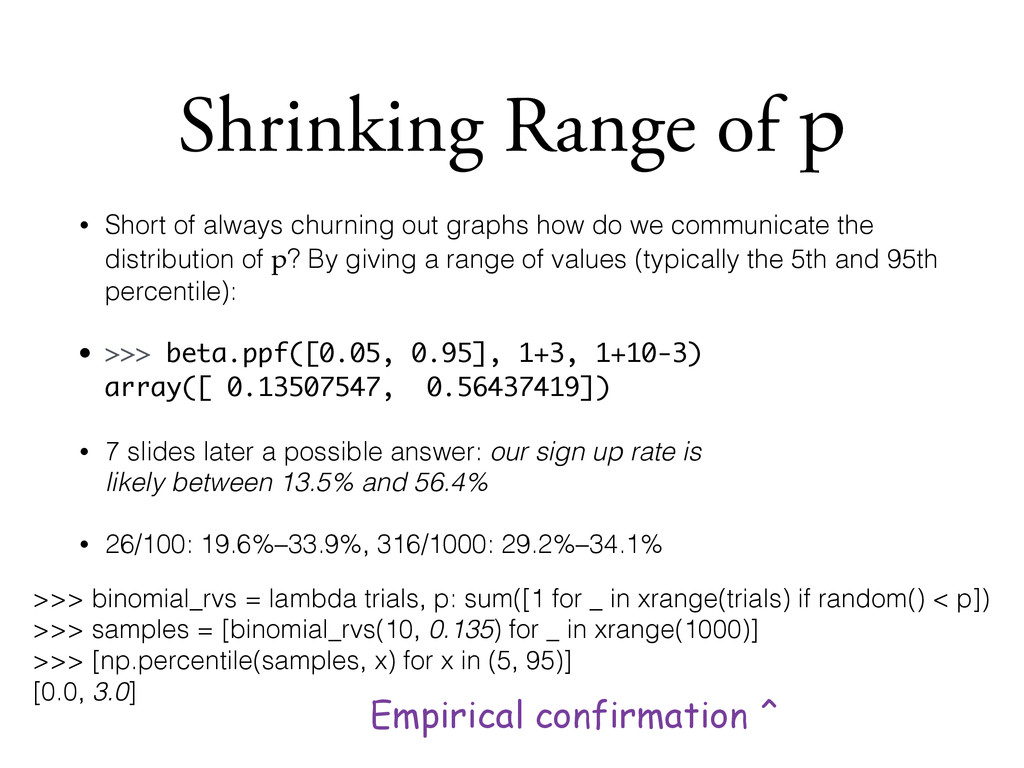
graphs how do we communicate the distribution of p? By giving a range of values (typically the 5th and 95th percentile): • >>> beta.ppf([0.05, 0.95], 1+3, 1+10-3) array([ 0.13507547, 0.56437419]) • 7 slides later a possible answer: our sign up rate is likely between 13.5% and 56.4% • 26/100: 19.6%–33.9%, 316/1000: 29.2%–34.1% >>> binomial_rvs = lambda trials, p: sum([1 for _ in xrange(trials) if random() < p]) >>> samples = [binomial_rvs(10, 0.135) for _ in xrange(1000)] >>> [np.percentile(samples, x) for x in (5, 95)] [0.0, 3.0] Empirical confirmation ^
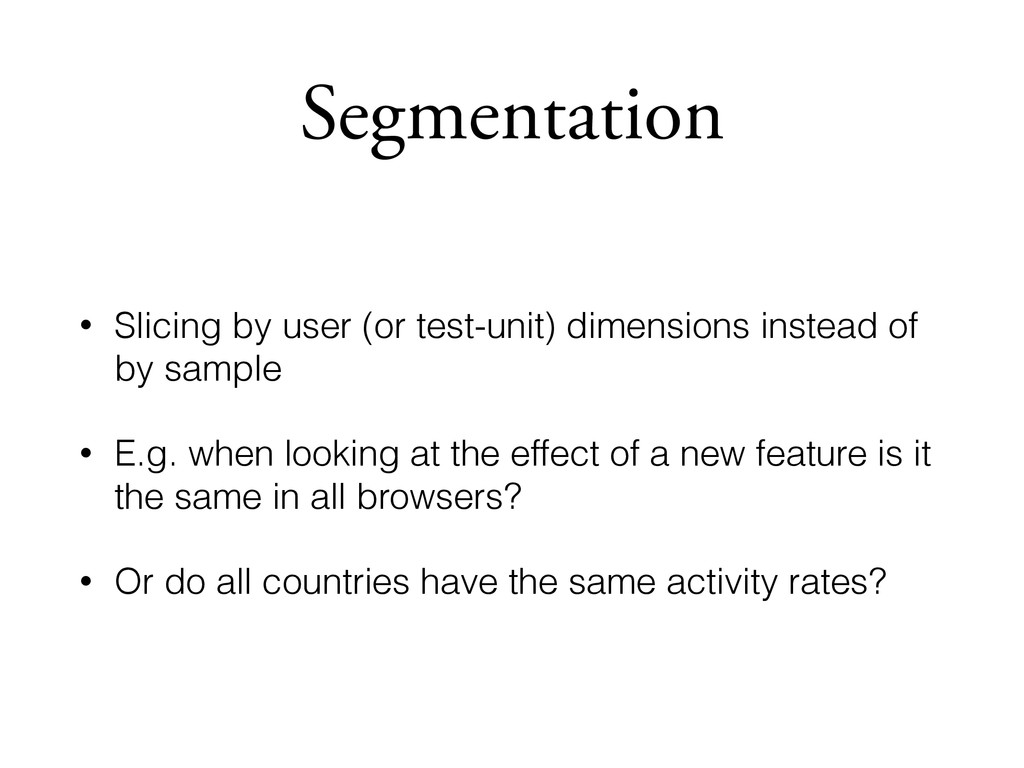
does retention this month compare to retention last month? • How much has our upgrade rate increased? • Which variant of the new user landing page works the best? • Does new feature X work in all browsers?
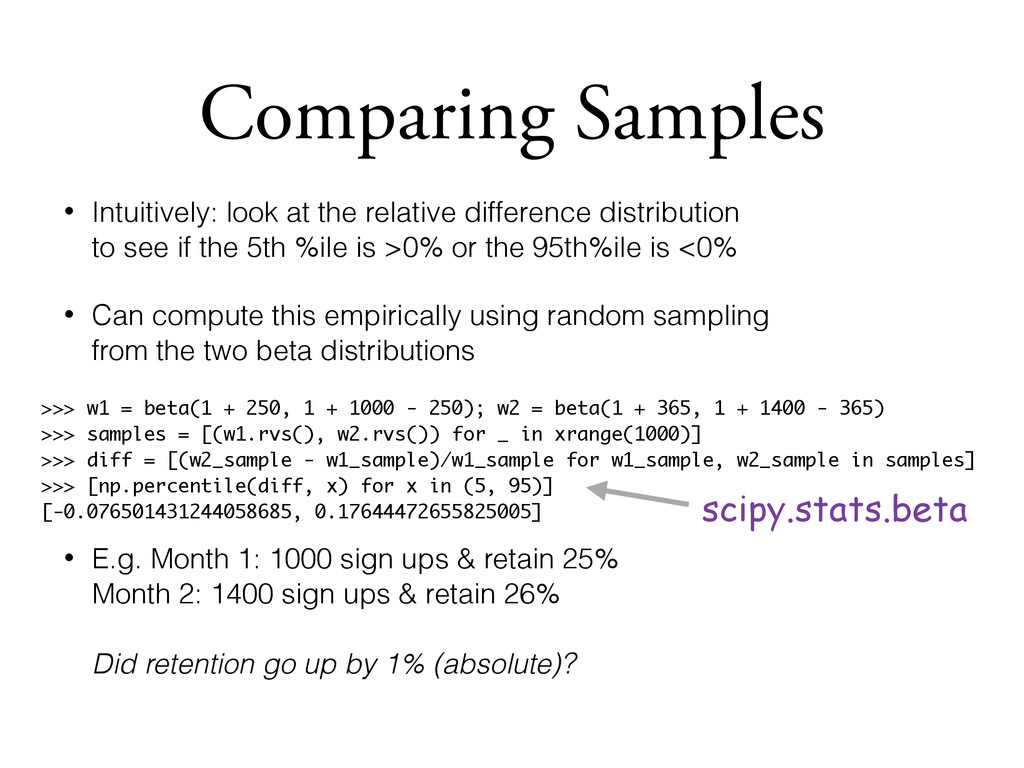
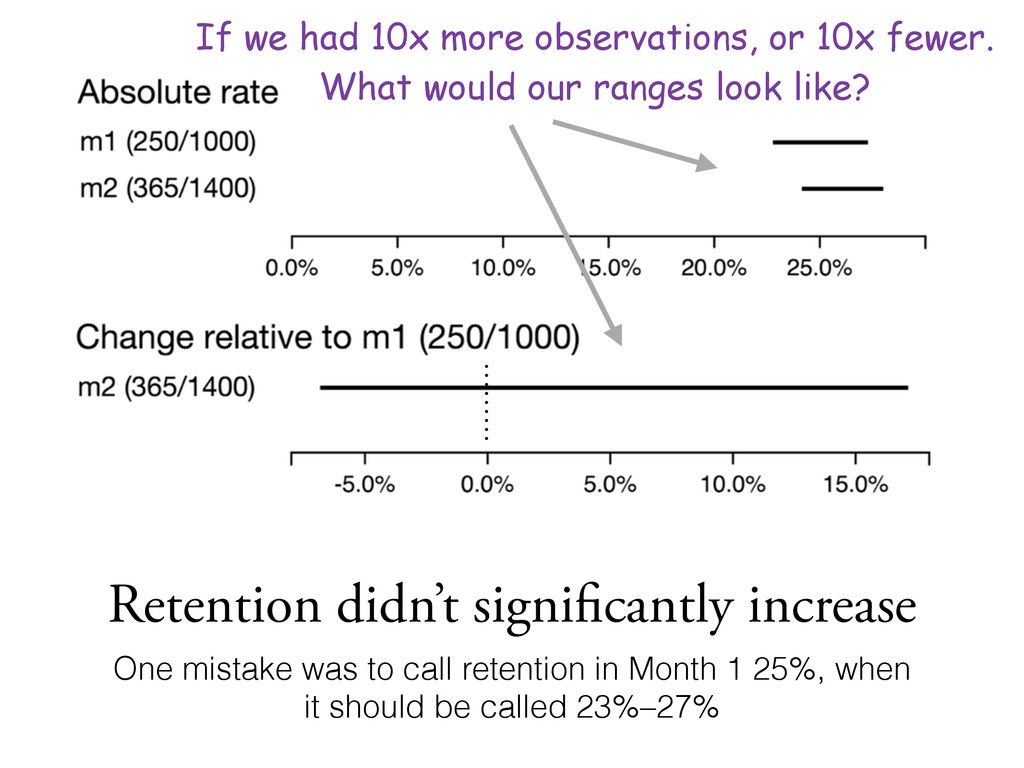
to see if the 5th %ile is >0% or the 95th%ile is <0% • Can compute this empirically using random sampling from the two beta distributions • E.g. Month 1: 1000 sign ups & retain 25% Month 2: 1400 sign ups & retain 26% Did retention go up by 1% (absolute)? >>> w1 = beta(1 + 250, 1 + 1000 - 250); w2 = beta(1 + 365, 1 + 1400 - 365) >>> samples = [(w1.rvs(), w2.rvs()) for _ in xrange(1000)] >>> diff = [(w2_sample - w1_sample)/w1_sample for w1_sample, w2_sample in samples] >>> [np.percentile(diff, x) for x in (5, 95)] [-0.076501431244058685, 0.17644472655825005] scipy.stats.beta
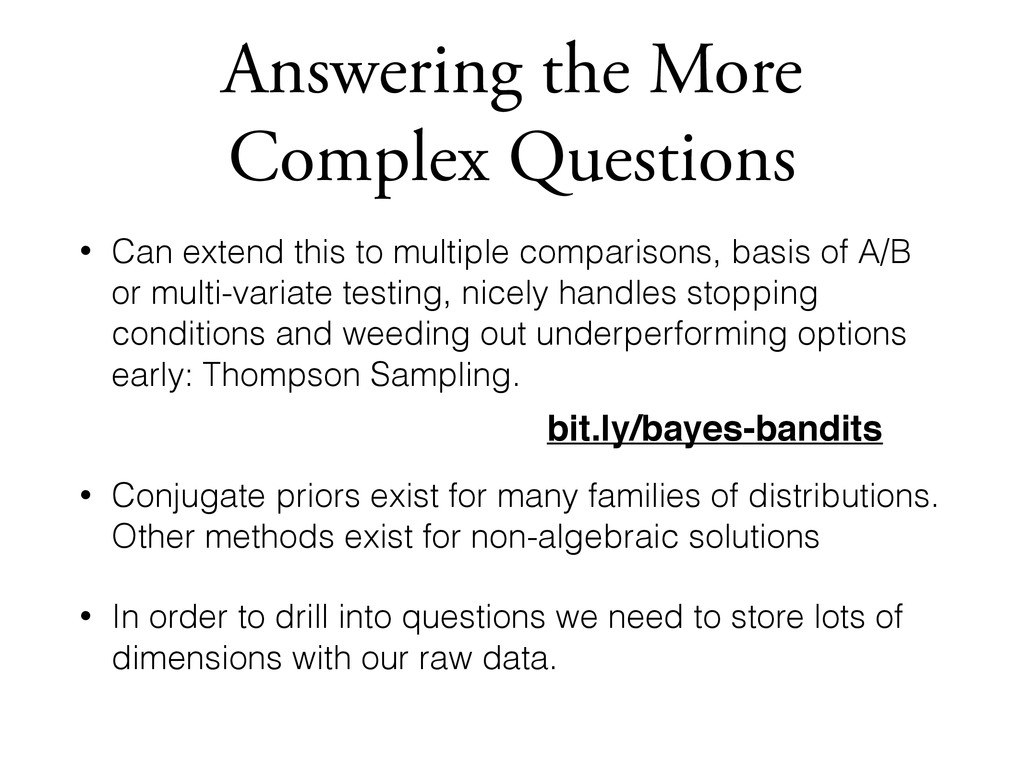
to multiple comparisons, basis of A/B or multi-variate testing, nicely handles stopping conditions and weeding out underperforming options early: Thompson Sampling. • Conjugate priors exist for many families of distributions. Other methods exist for non-algebraic solutions • In order to drill into questions we need to store lots of dimensions with our raw data. bit.ly/bayes-bandits
schematize with an eye towards future analysis. Keep as much as you can. • Structured event logs — everything else that happens that isn’t necessary to go in the DB. Except we didn’t have that! So, off to build a data collection pipeline.
API that receives events. HMAC signing of events or partial event data. • Data gets batched into S3 • There is a queue in the middle. May in the future move to a log. • Collect from the browser and the web app.
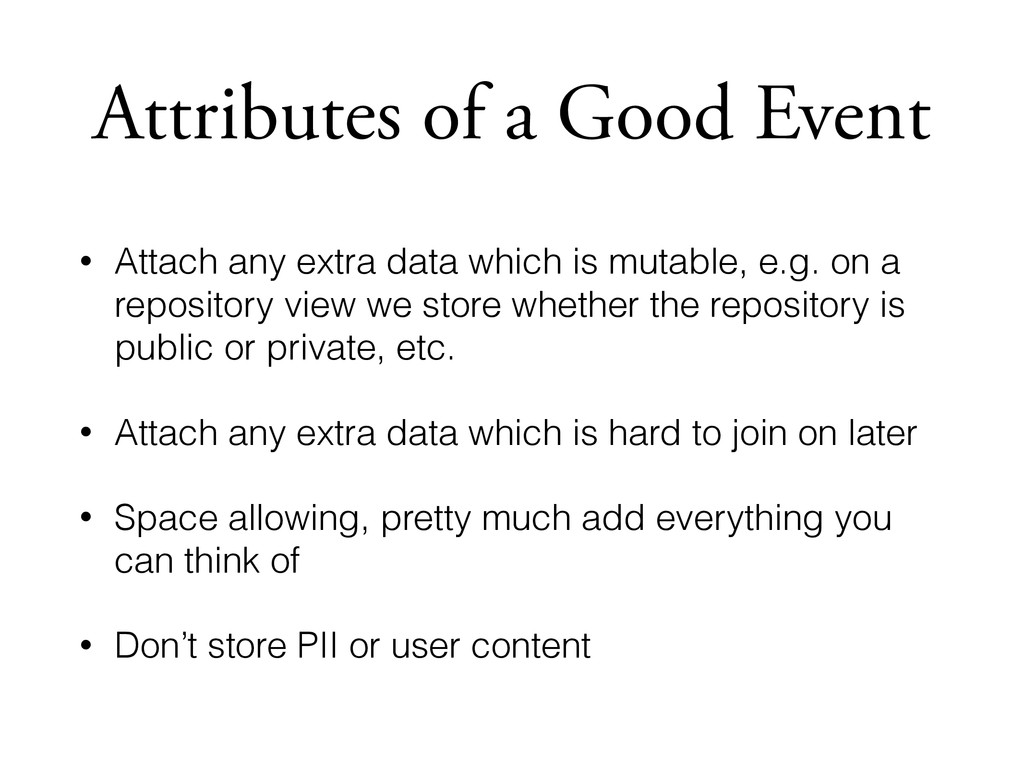
which is mutable, e.g. on a repository view we store whether the repository is public or private, etc. • Attach any extra data which is hard to join on later • Space allowing, pretty much add everything you can think of • Don’t store PII or user content
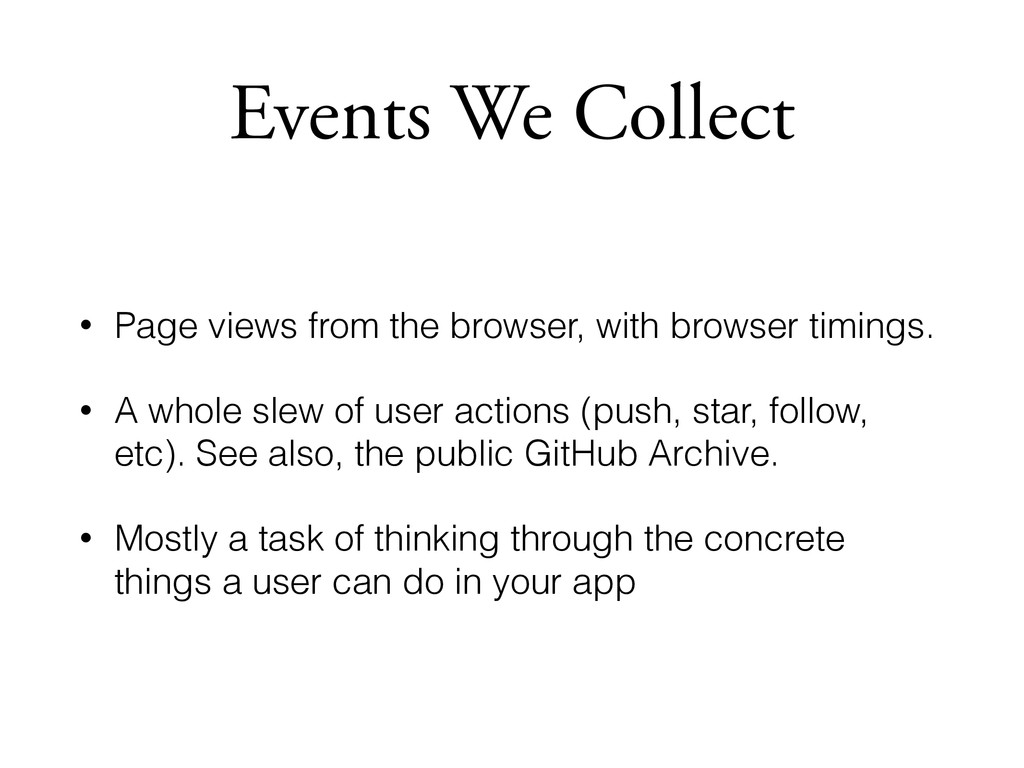
browser timings. • A whole slew of user actions (push, star, follow, etc). See also, the public GitHub Archive. • Mostly a task of thinking through the concrete things a user can do in your app
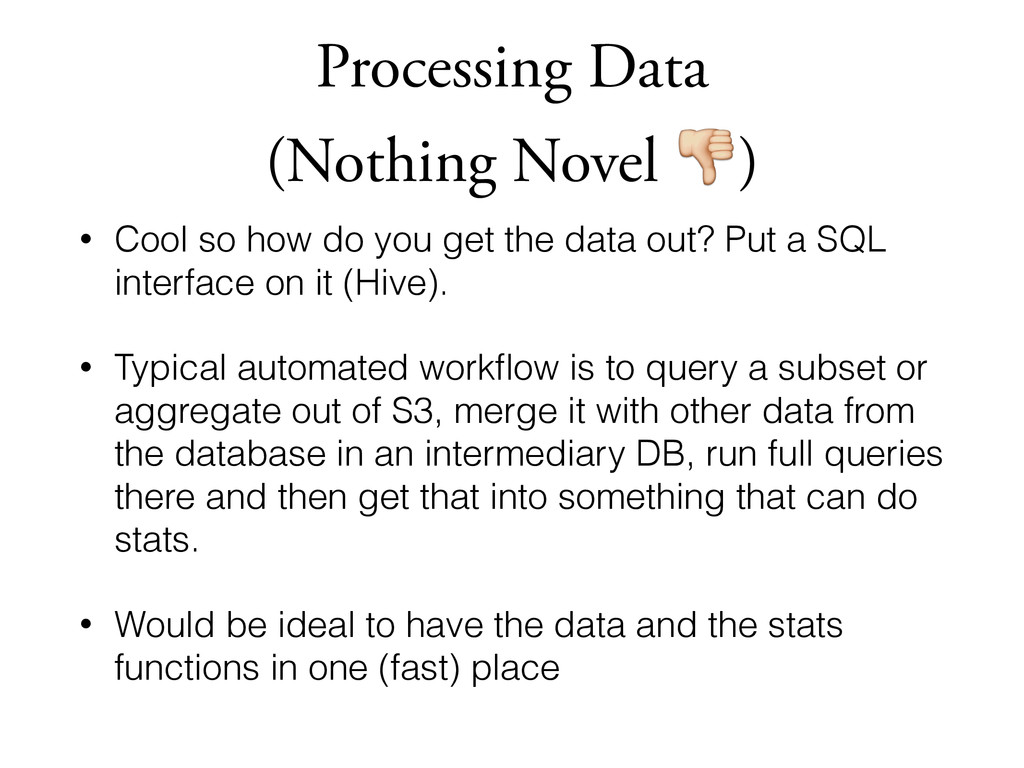
you get the data out? Put a SQL interface on it (Hive). • Typical automated workflow is to query a subset or aggregate out of S3, merge it with other data from the database in an intermediary DB, run full queries there and then get that into something that can do stats. • Would be ideal to have the data and the stats functions in one (fast) place
bit.ly/puzzling-outcomes • “A modern Bayesian look at the multi-armed bandit” bit.ly/bayes-bandits • “Bayesian Reasoning and Machine Learning” bit.ly/bayes-ml • “The Log: What every software engineer should know about real-time data's unifying abstraction” bit.ly/the-log
![Thanks! @jdmaturen [email protected]](https://files.speakerdeck.com/presentations/85feb0a0321201327f242efaeef44115/slide_32.jpg)