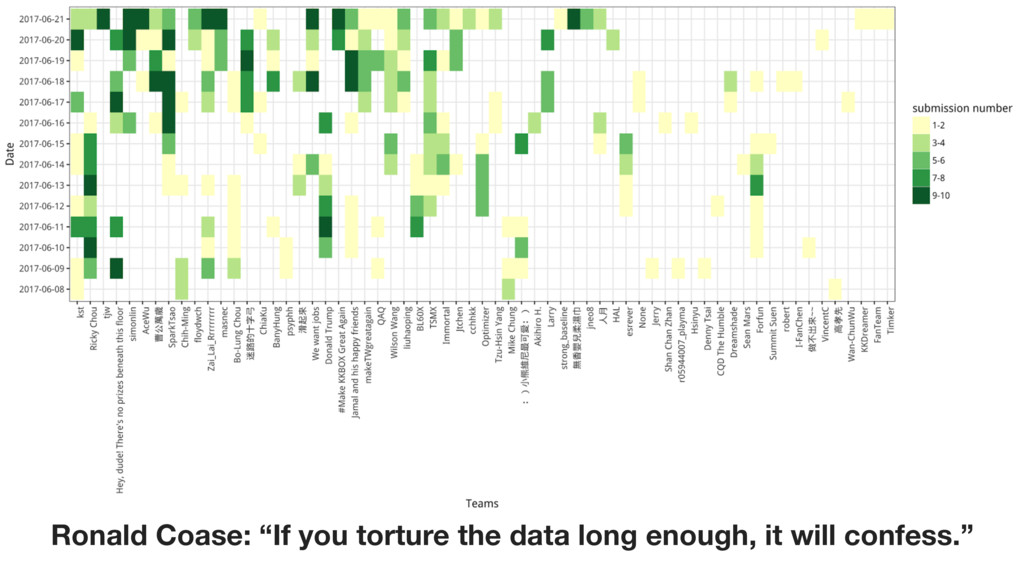
data and turning it into decisions. • Data Scientist, KKStream, 2016 - now • Data Scientist, KKBOX Research Center, 2014 - 2016 • PhD. NTU EE, 2014 Ronald Coase: “If you torture the data long enough, it will confess.”
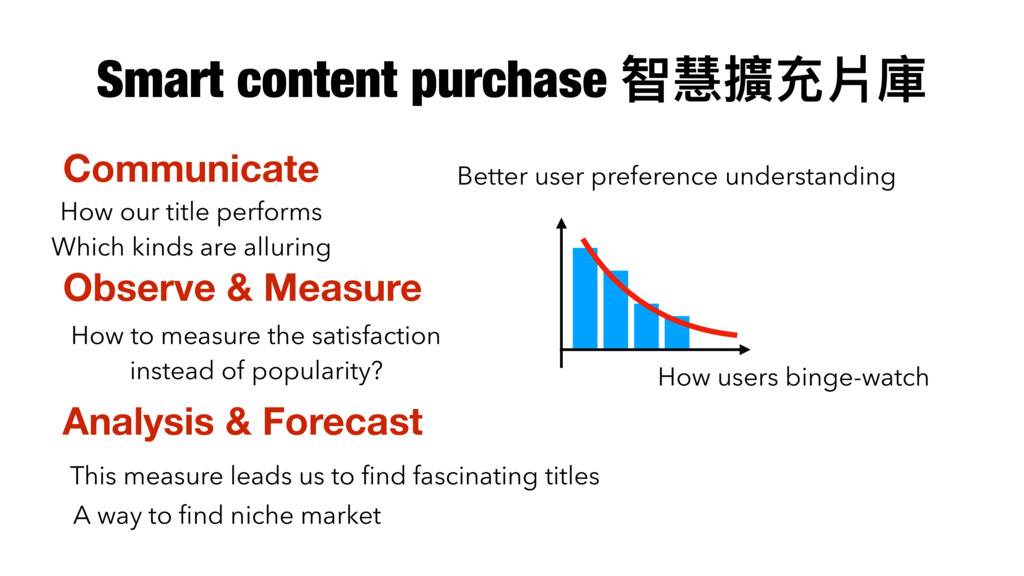
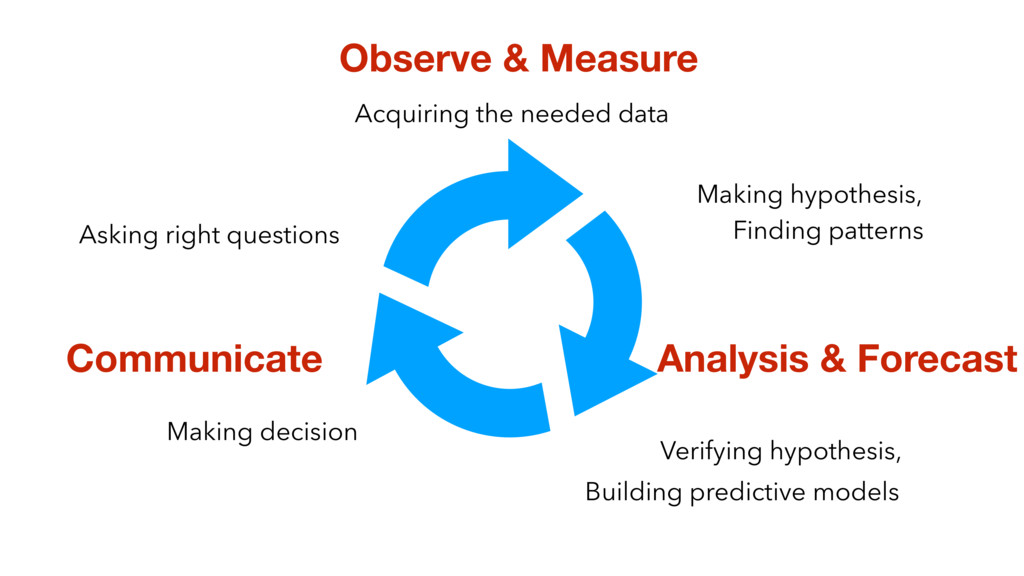
performs Which kinds are alluring How to measure the satisfaction instead of popularity? How users binge-watch This measure leads us to find fascinating titles Better user preference understanding Observe & Measure Analysis & Forecast Smart content purchase 智慧擴充片庫
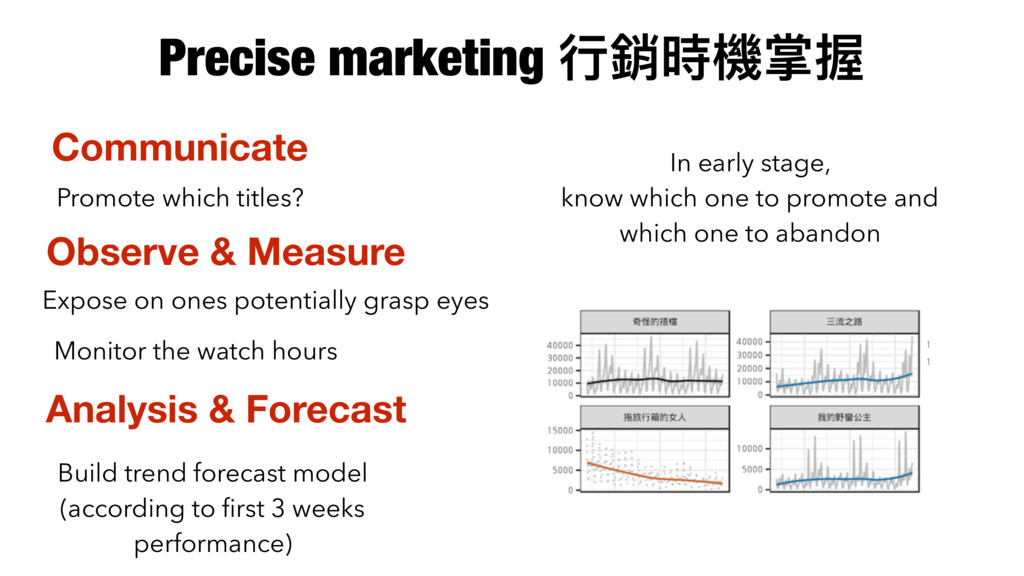
which one to abandon Promote which titles? Expose on ones potentially grasp eyes Monitor the watch hours Build trend forecast model (according to first 3 weeks performance) Precise marketing ⾏行行銷時機掌握 Analysis & Forecast Observe & Measure
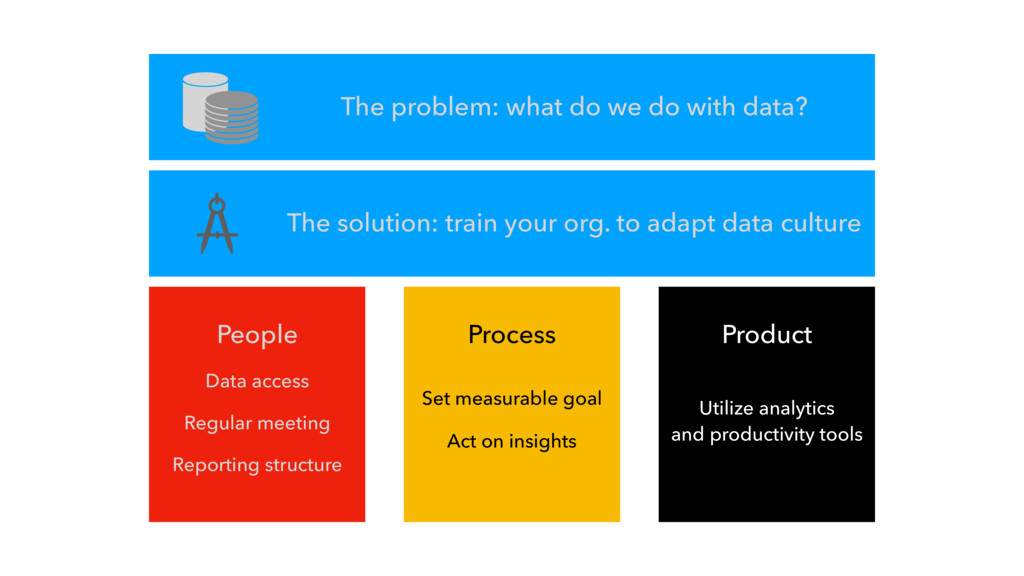
train your org. to adapt data culture People Process Product Data access Regular meeting Reporting structure Set measurable goal Act on insights Utilize analytics and productivity tools
a digital format to be accessible to the average end user. The goal of data democratization is to allow non-specialists to be able to gather and analyze data without requiring outside help.
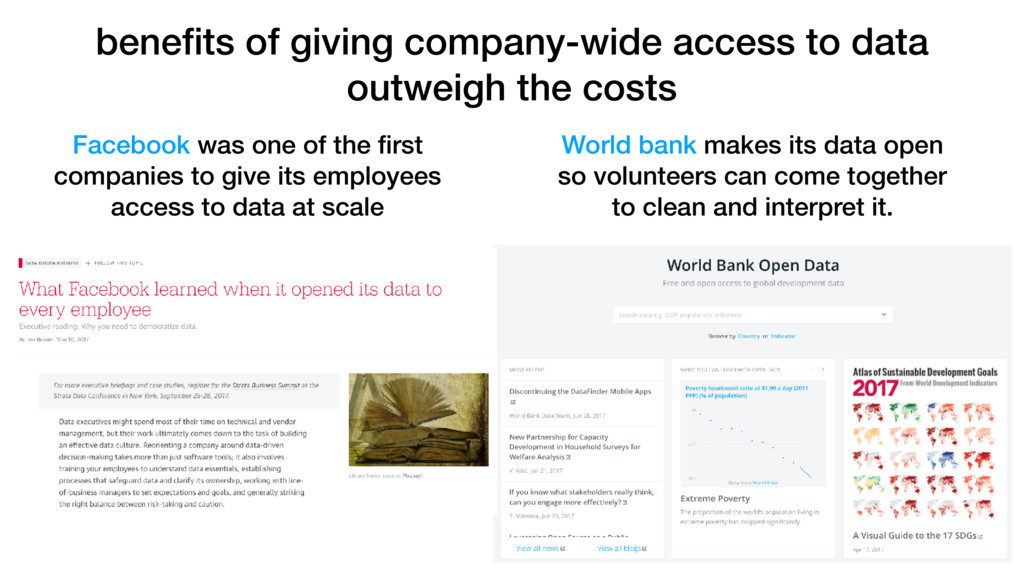
Facebook was one of the first companies to give its employees access to data at scale World bank makes its data open so volunteers can come together to clean and interpret it.
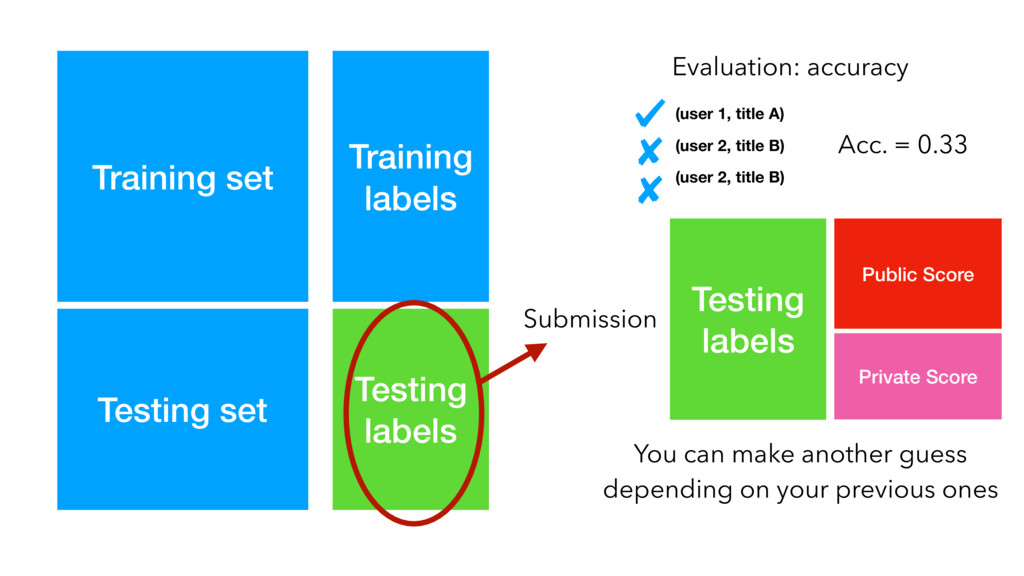
labels Public Score Private Score Evaluation: accuracy (user 1, title A) (user 2, title B) (user 2, title B) Acc. = 0.33 You can make another guess depending on your previous ones
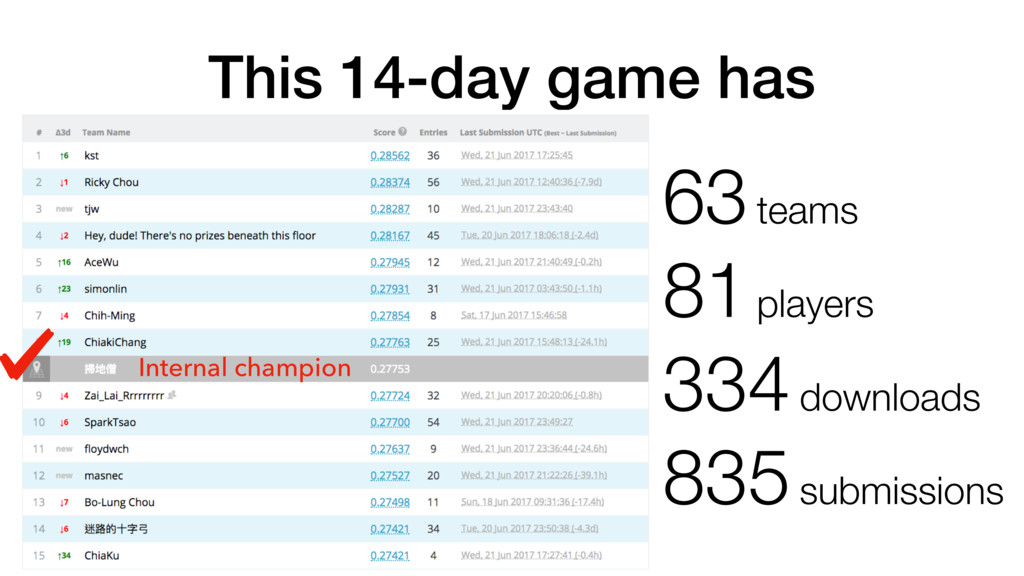
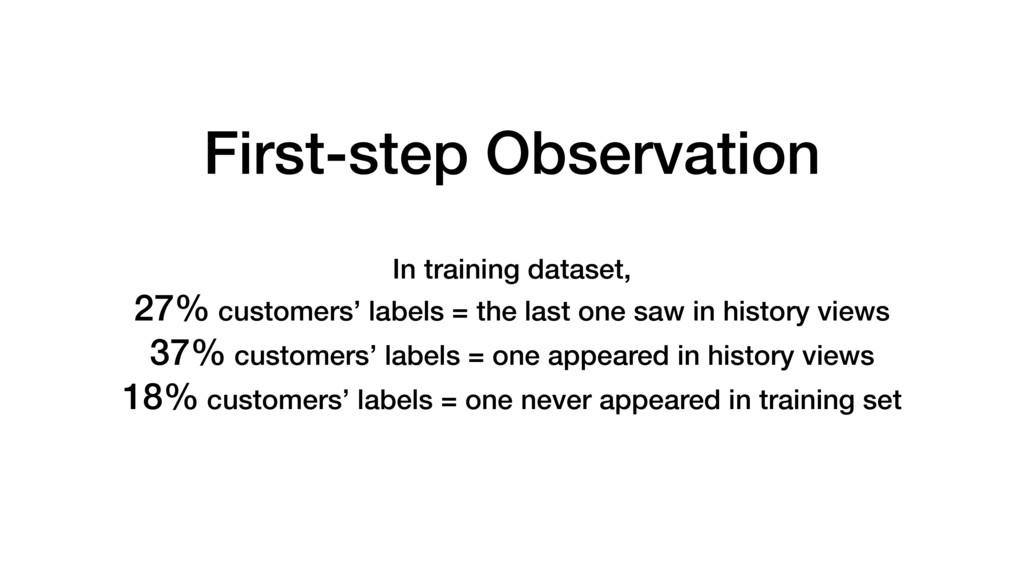
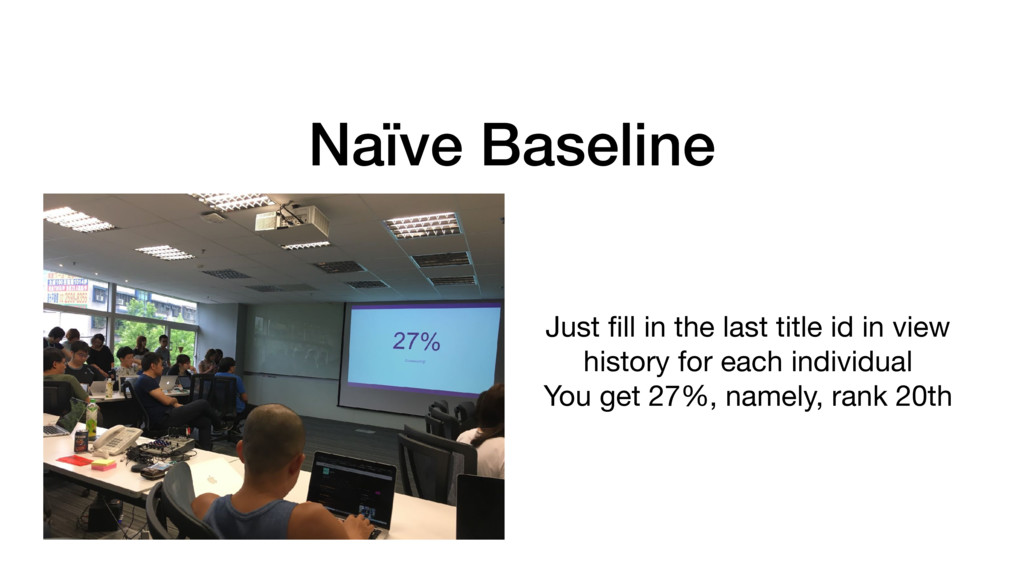
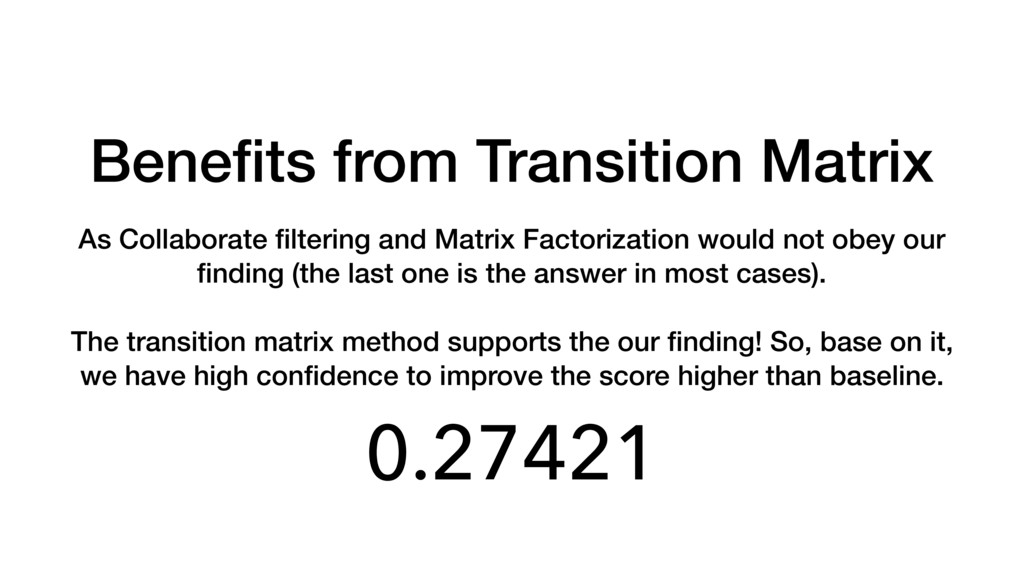
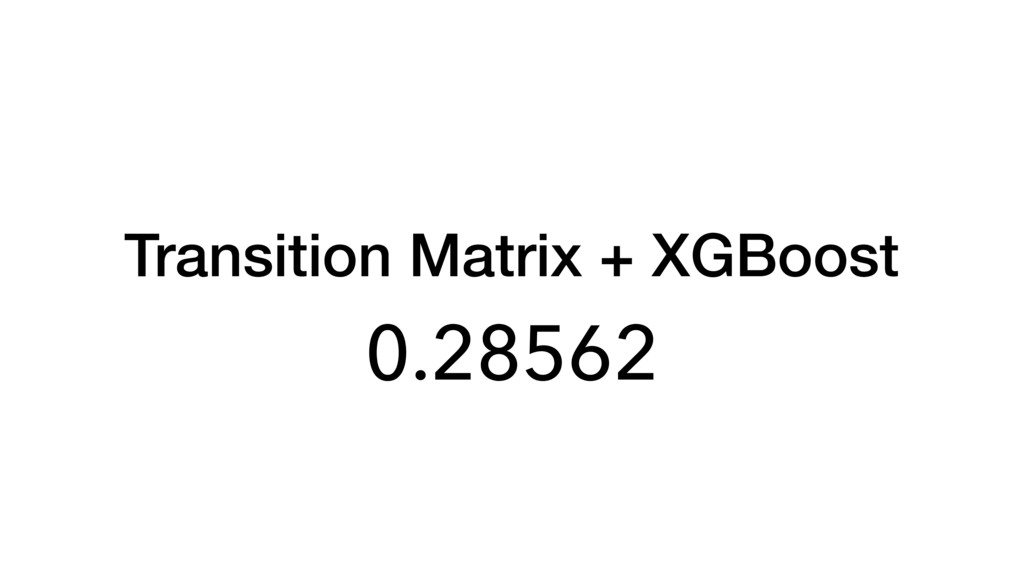
would not obey our finding (the last one is the answer in most cases). The transition matrix method supports the our finding! So, base on it, we have high confidence to improve the score higher than baseline. 0.27421
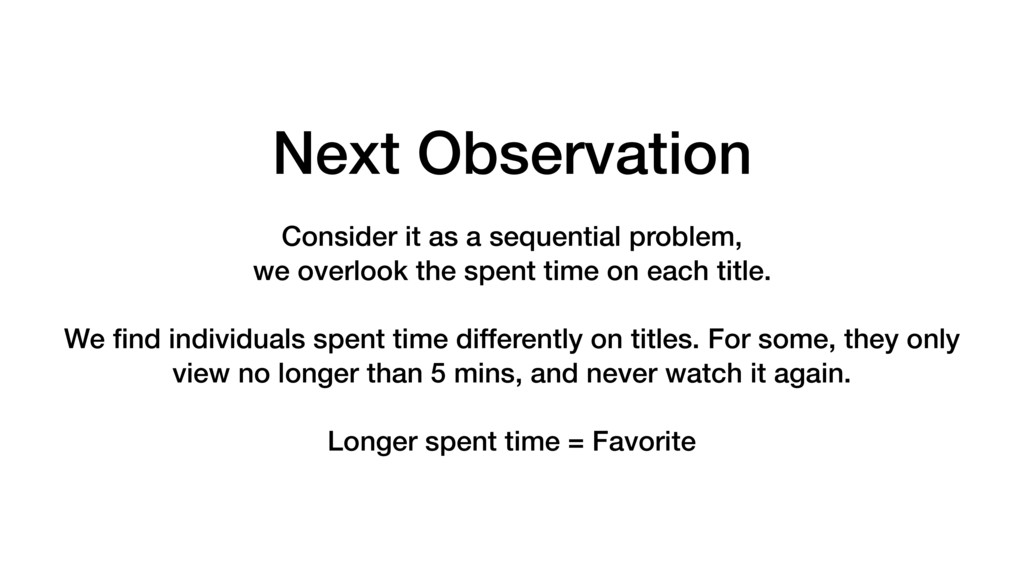
the spent time on each title. We find individuals spent time differently on titles. For some, they only view no longer than 5 mins, and never watch it again. Longer spent time = Favorite
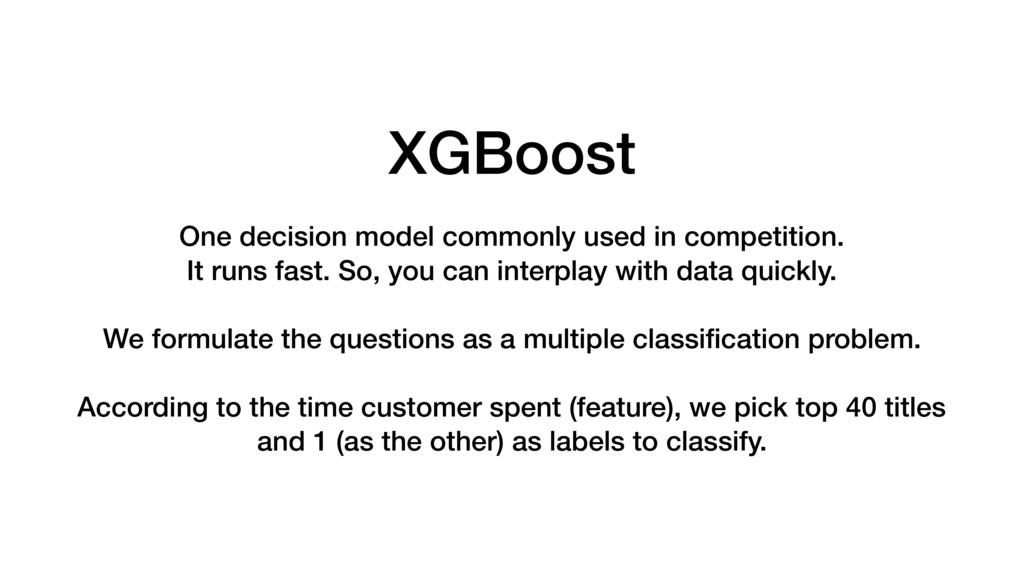
fast. So, you can interplay with data quickly. We formulate the questions as a multiple classification problem. According to the time customer spent (feature), we pick top 40 titles and 1 (as the other) as labels to classify.