Upgrade to Pro
— share decks privately, control downloads, hide ads and more …
Speaker Deck
Features
Speaker Deck
PRO
Sign in
Sign up for free
Search
Search
Visualize BUM topology in SDN environment
Search
k_yoshi
December 14, 2017
Programming
1k
0
Share
Embed
Copy iframe code
Copy JS code
Copy link
Start on current slide
Visualize BUM topology in SDN environment
k_yoshi
December 14, 2017
Other Decks in Programming
See All in Programming
これからAgentCoreを触る方へ トレンドはGatewayです
har1101
6
490
【やさしく解説 設計編 #1】「ドメイン駆動」と「実装駆動」ってなに? 〜設計の考え方を、たとえ話で学ぼう〜
panda728
PRO
1
120
ビデオ通話が繋がる0.2秒で何が起きているのか
supurazako
2
150
使用 Meilisearch 建立新聞搜尋工具
johnroyer
0
150
なぜ関数型プログラミングで「型」と「証明」が語られるのか #fp_matsuri
kajitack
3
930
トークンをケチるな、設計しろ:GitHub Copilotを賢く使うコンテキスト戦略
ochtum
0
320
PHP Application における Kubernetes 内 gRPC 通信
ganchiku
0
430
Creating Composable Callables in Contemporary C++
rollbear
0
210
関数型プログラミングのメリットって何だろう?
wanko_it
0
180
任せる範囲はこう広がった / How the Scope of AI Delegation Has Expanded
nrslib
1
260
【やさしく解説 設計編 #0】DDDのコード、読めるのに分からない人へ
panda728
PRO
2
270
言語を使う側から、作る側へ。 自作 Lisp で得た新たな気づき。
andpad
0
120
Featured
See All Featured
Stewardship and Sustainability of Urban and Community Forests
pwiseman
0
340
Navigating the moral maze — ethical principles for Al-driven product design
skipperchong
2
420
The Director’s Chair: Orchestrating AI for Truly Effective Learning
tmiket
1
220
10 Git Anti Patterns You Should be Aware of
lemiorhan
PRO
659
62k
ReactJS: Keep Simple. Everything can be a component!
pedronauck
666
130k
The Curious Case for Waylosing
cassininazir
1
430
Automating Front-end Workflow
addyosmani
1370
210k
Visual Storytelling: How to be a Superhuman Communicator
reverentgeek
2
590
Balancing Empowerment & Direction
lara
6
1.2k
Lightning Talk: Beautiful Slides for Beginners
inesmontani
PRO
2
610
Creating an realtime collaboration tool: Agile Flush - .NET Oxford
marcduiker
35
2.5k
Scaling GitHub
holman
464
140k
Transcript
SDN 環境の BUMトポロジーを可視化する
自己紹介 2 名前: 吉田 幸治 所属: CTC 職種: ネットワークSE 最近のお仕事:
SDN 案件で Contrail のサポート、技術支援を2年程続けています。
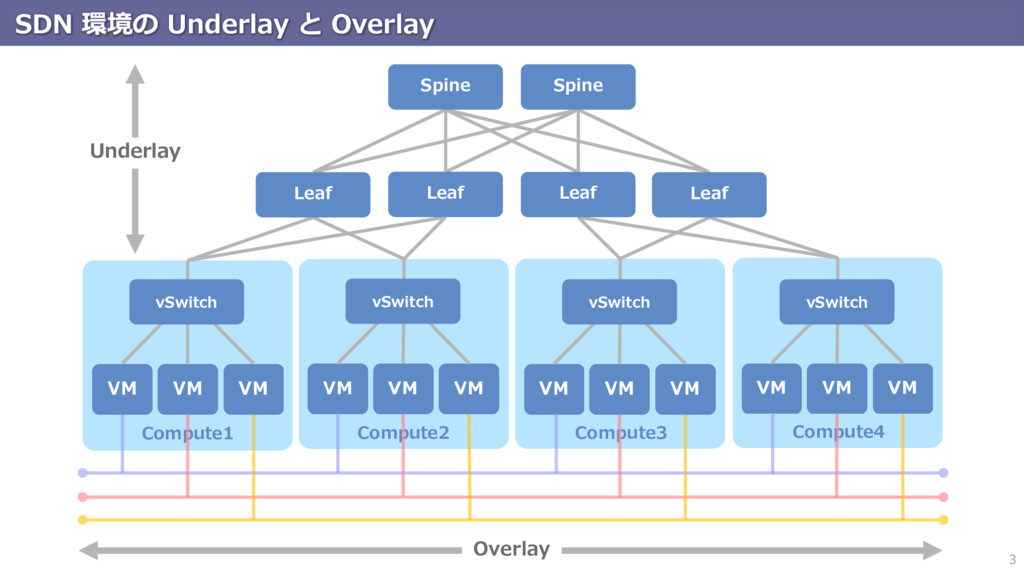
SDN 環境の Underlay と Overlay 3 Compute1 Compute2 Compute3 Compute4
vSwitch vSwitch vSwitch Leaf Leaf Leaf Leaf Spine Spine vSwitch Underlay Overlay
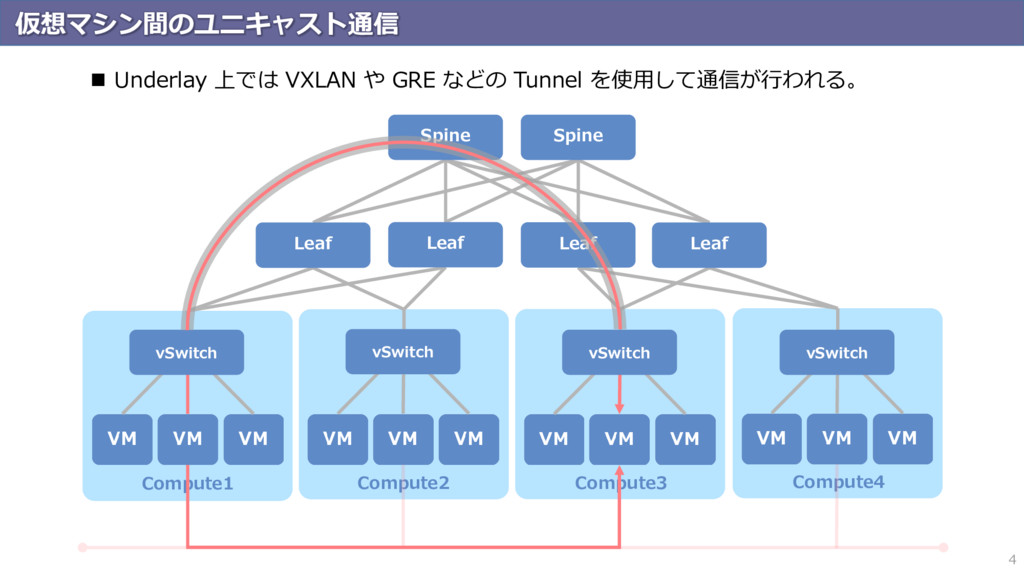
仮想マシン間のユニキャスト通信 4 Compute1 Compute2 Compute3 Compute4 vSwitch vSwitch vSwitch Leaf
Leaf Leaf Leaf Spine Spine vSwitch Underlay 上では VXLAN や GRE などの Tunnel を使用して通信が行われる。
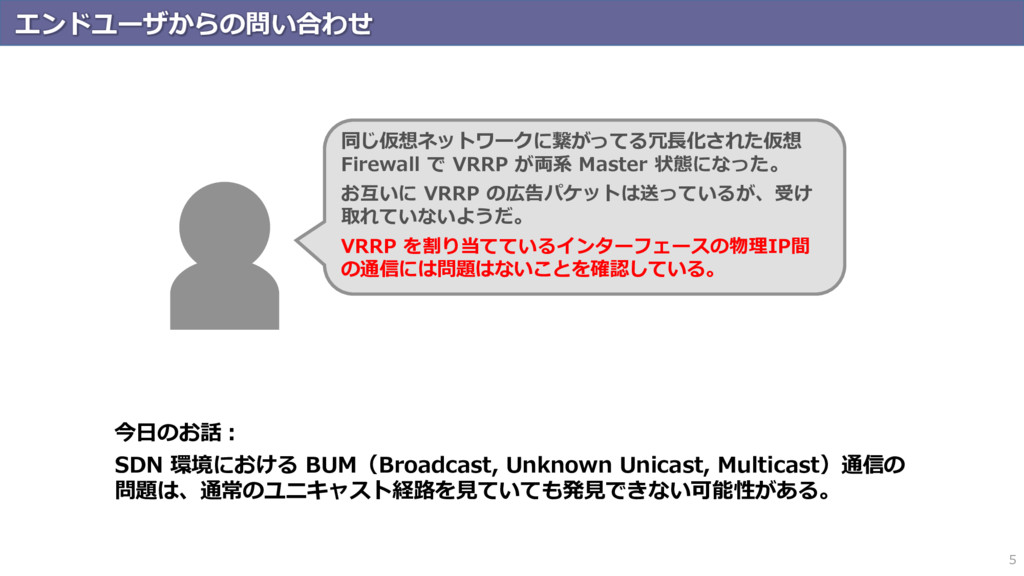
エンドユーザからの問い合わせ 5 同じ仮想ネットワークに繋がってる冗長化された仮想 Firewall で VRRP が両系 Master 状態になった。 お互いに
VRRP の広告パケットは送っているが、受け 取れていないようだ。 VRRP を割り当てているインターフェースの物理IP間 の通信には問題はないことを確認している。 今日のお話: SDN 環境における BUM(Broadcast, Unknown Unicast, Multicast)通信の 問題は、通常のユニキャスト経路を見ていても発見できない可能性がある。
SDN 環境における BUM の転送方式 6 SDN コントローラによって、方式は様々。 今回例として紹介する
Contrail では、Release 3.2 の時点で L2 ネットワークの BUM 転送方式として、Edge Multicast Replication を採用している。 https://www.ietf.org/archive/id/draft-marques-l3vpn-mcast-edge-01.txt
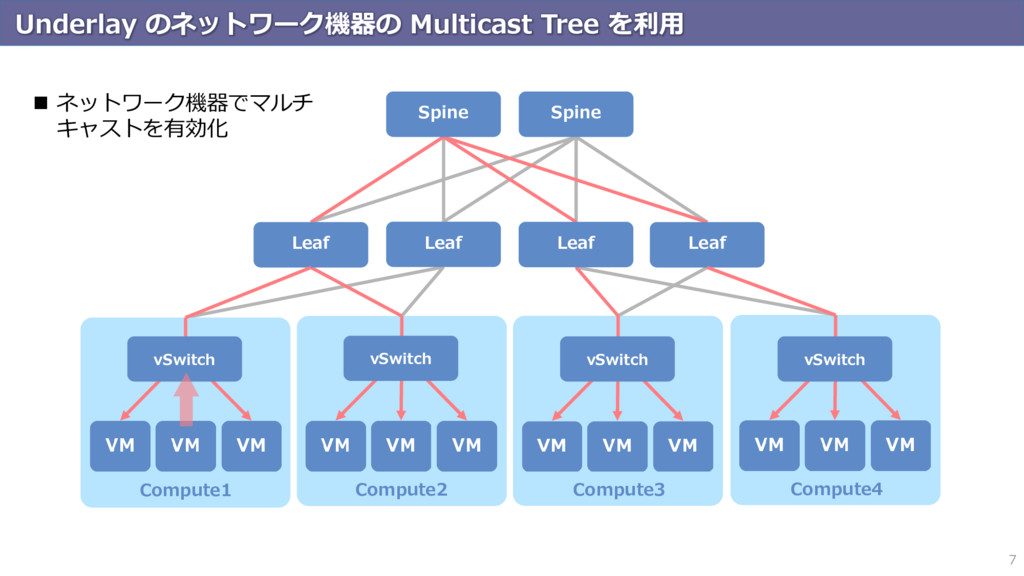
Underlay のネットワーク機器の Multicast Tree を利用 7 Compute1 Compute2 Compute3 Compute4
vSwitch vSwitch vSwitch vSwitch Leaf Leaf Leaf Leaf Spine Spine ネットワーク機器でマルチ キャストを有効化
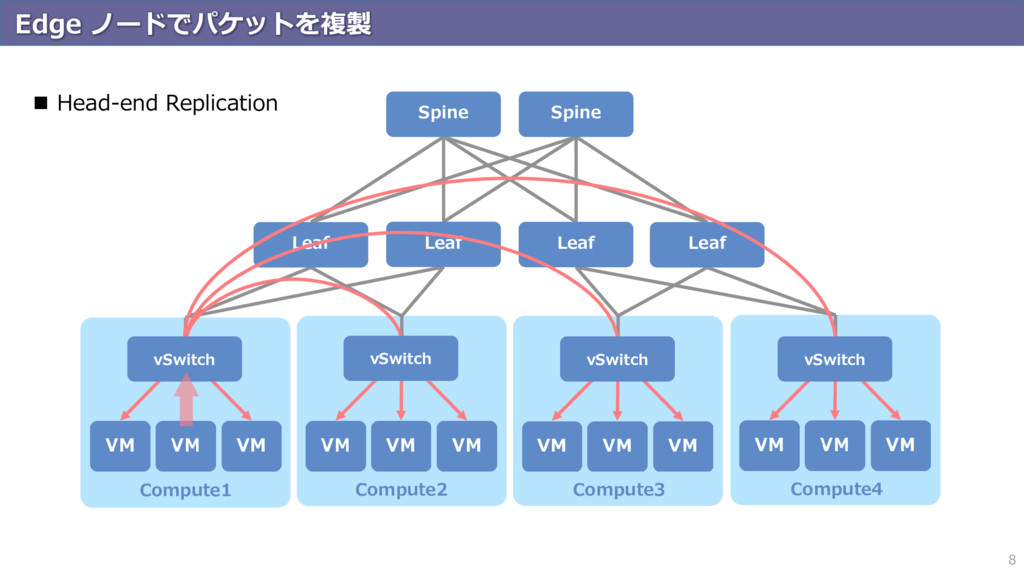
Edge ノードでパケットを複製 8 Compute1 Compute2 Compute3 Compute4 Leaf Leaf Leaf
Leaf Spine Spine vSwitch vSwitch vSwitch vSwitch Head-end Replication
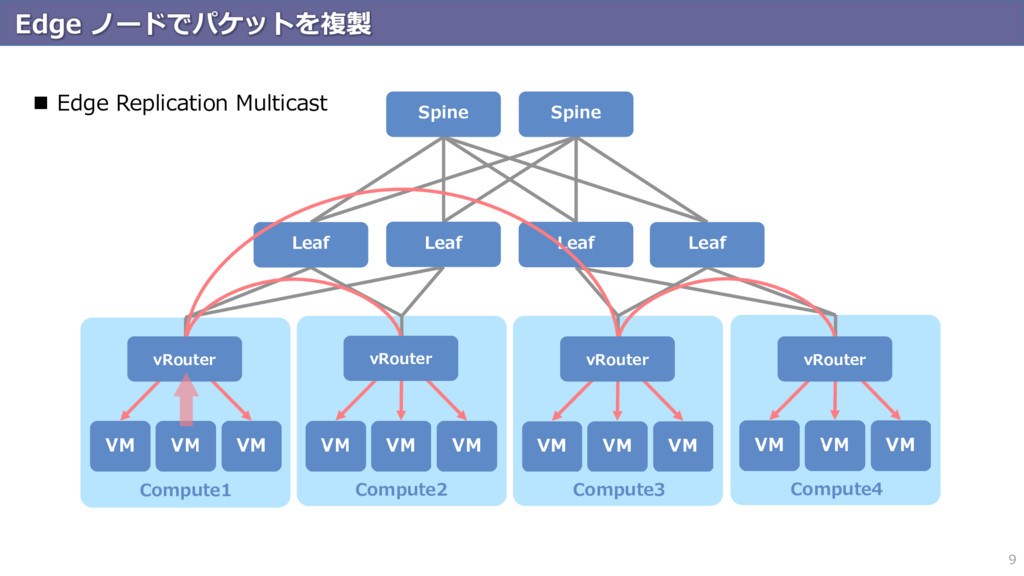
Edge ノードでパケットを複製 9 Compute1 Compute2 Compute3 Compute4 Leaf Leaf Leaf
Leaf Spine Spine vRouter vRouter vRouter vRouter Edge Replication Multicast
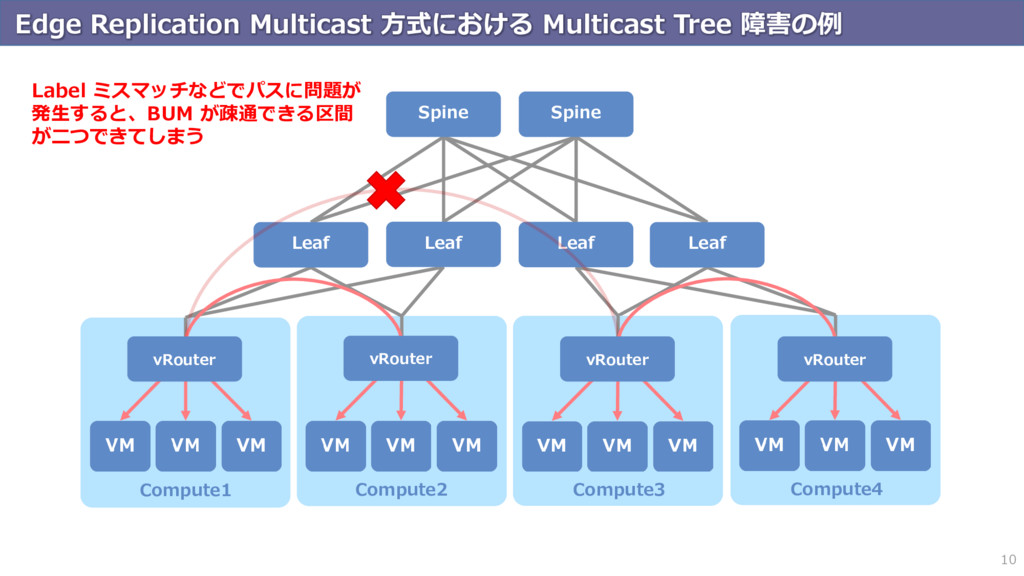
Edge Replication Multicast 方式における Multicast Tree 障害の例 10 Compute1 Compute2
Compute3 Compute4 Leaf Leaf Leaf Leaf Spine Spine vRouter vRouter vRouter vRouter Label ミスマッチなどでパスに問題が 発生すると、BUM が疎通できる区間 が二つできてしまう
保守ベンダとしてのニーズ 11 クラウドインフラ上に作成された多数の仮想ネットワークの中から 問題の発生しているものを見つけ出し、問題がどこにあるのかを 迅速に切り分けたい。
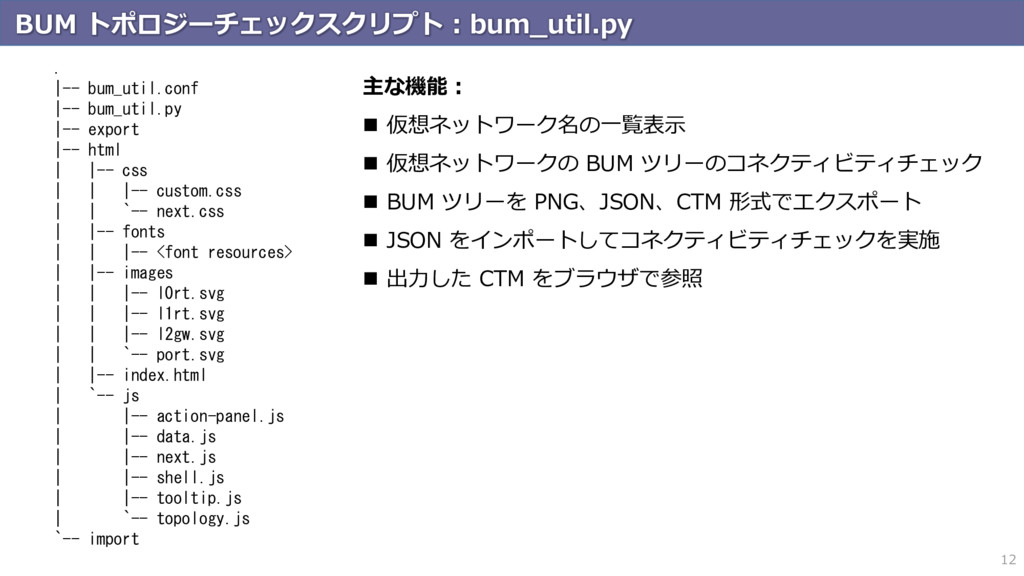
BUM トポロジーチェックスクリプト:bum_util.py 12 . |-- bum_util.conf |-- bum_util.py |-- export
|-- html | |-- css | | |-- custom.css | | `-- next.css | |-- fonts | | |-- <font resources> | |-- images | | |-- l0rt.svg | | |-- l1rt.svg | | |-- l2gw.svg | | `-- port.svg | |-- index.html | `-- js | |-- action-panel.js | |-- data.js | |-- next.js | |-- shell.js | |-- tooltip.js | `-- topology.js `-- import 主な機能: 仮想ネットワーク名の一覧表示 仮想ネットワークの BUM ツリーのコネクティビティチェック BUM ツリーを PNG、JSON、CTM 形式でエクスポート JSON をインポートしてコネクティビティチェックを実施 出力した CTM をブラウザで参照
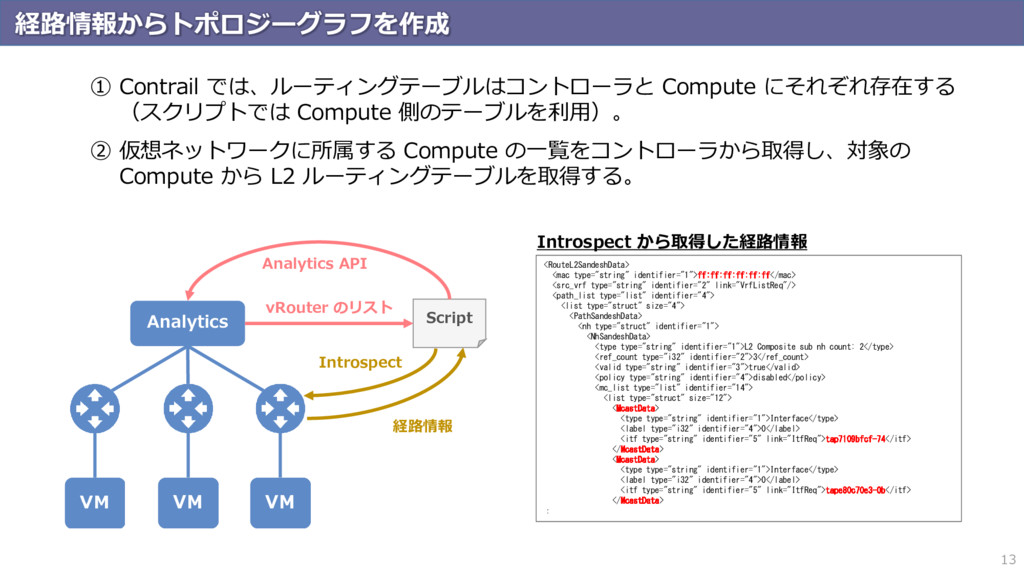
経路情報からトポロジーグラフを作成 13 ① Contrail では、ルーティングテーブルはコントローラと Compute にそれぞれ存在する (スクリプトでは Compute 側のテーブルを利用)。
② 仮想ネットワークに所属する Compute の一覧をコントローラから取得し、対象の Compute から L2 ルーティングテーブルを取得する。 Analytics Script Introspect Analytics API <RouteL2SandeshData> <mac type="string" identifier="1">ff:ff:ff:ff:ff:ff</mac> <src_vrf type="string" identifier="2" link="VrfListReq"/> <path_list type="list" identifier="4"> <list type="struct" size="4"> <PathSandeshData> <nh type="struct" identifier="1"> <NhSandeshData> <type type="string" identifier="1">L2 Composite sub nh count: 2</type> <ref_count type="i32" identifier="2">3</ref_count> <valid type="string" identifier="3">true</valid> <policy type="string" identifier="4">disabled</policy> <mc_list type="list" identifier="14"> <list type="struct" size="12"> <McastData> <type type="string" identifier="1">Interface</type> <label type="i32" identifier="4">0</label> <itf type="string" identifier="5" link="ItfReq">tap7109bfcf-74</itf> </McastData> <McastData> <type type="string" identifier="1">Interface</type> <label type="i32" identifier="4">0</label> <itf type="string" identifier="5" link="ItfReq">tape80c70e3-0b</itf> </McastData> : vRouter のリスト 経路情報 Introspect から取得した経路情報
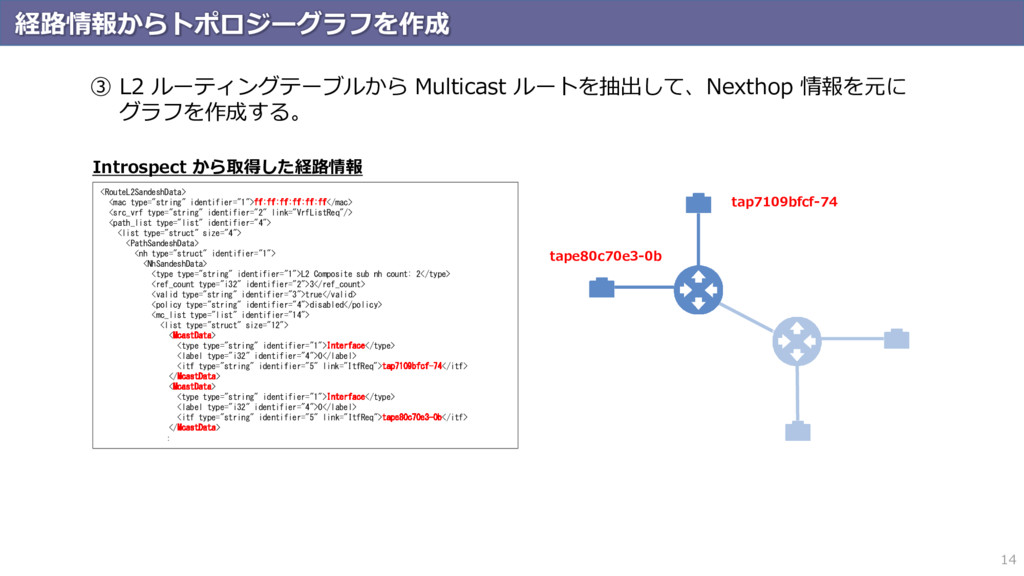
経路情報からトポロジーグラフを作成 14 ③ L2 ルーティングテーブルから Multicast ルートを抽出して、Nexthop 情報を元に グラフを作成する。 <RouteL2SandeshData>
<mac type="string" identifier="1">ff:ff:ff:ff:ff:ff</mac> <src_vrf type="string" identifier="2" link="VrfListReq"/> <path_list type="list" identifier="4"> <list type="struct" size="4"> <PathSandeshData> <nh type="struct" identifier="1"> <NhSandeshData> <type type="string" identifier="1">L2 Composite sub nh count: 2</type> <ref_count type="i32" identifier="2">3</ref_count> <valid type="string" identifier="3">true</valid> <policy type="string" identifier="4">disabled</policy> <mc_list type="list" identifier="14"> <list type="struct" size="12"> <McastData> <type type="string" identifier="1">Interface</type> <label type="i32" identifier="4">0</label> <itf type="string" identifier="5" link="ItfReq">tap7109bfcf-74</itf> </McastData> <McastData> <type type="string" identifier="1">Interface</type> <label type="i32" identifier="4">0</label> <itf type="string" identifier="5" link="ItfReq">tape80c70e3-0b</itf> </McastData> : tape80c70e3-0b tap7109bfcf-74 Introspect から取得した経路情報
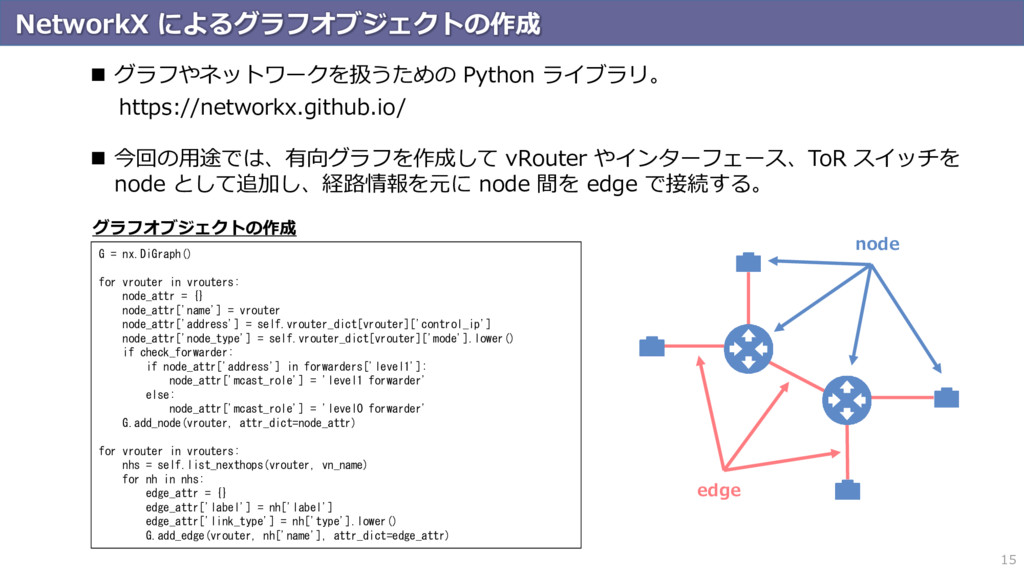
NetworkX によるグラフオブジェクトの作成 15 グラフやネットワークを扱うための Python ライブラリ。 https://networkx.github.io/ 今回の用途では、有向グラフを作成して
vRouter やインターフェース、ToR スイッチを node として追加し、経路情報を元に node 間を edge で接続する。 G = nx.DiGraph() for vrouter in vrouters: node_attr = {} node_attr['name'] = vrouter node_attr['address'] = self.vrouter_dict[vrouter]['control_ip'] node_attr['node_type'] = self.vrouter_dict[vrouter]['mode'].lower() if check_forwarder: if node_attr['address'] in forwarders['level1']: node_attr['mcast_role'] = 'level1 forwarder' else: node_attr['mcast_role'] = 'level0 forwarder' G.add_node(vrouter, attr_dict=node_attr) for vrouter in vrouters: nhs = self.list_nexthops(vrouter, vn_name) for nh in nhs: edge_attr = {} edge_attr['label'] = nh['label'] edge_attr['link_type'] = nh['type'].lower() G.add_edge(vrouter, nh['name'], attr_dict=edge_attr) グラフオブジェクトの作成 node edge
グラフの連結度の確認 16 In [1]: import networkx as nx In [2]:
G = nx.DiGraph() In [3]: G.add_nodes_from(range(3)) In [4]: G.add_edges_from([(0, 1), (1, 0), (0,2), (2,0)]) In [5]: G.edge Out[5]: {0: {1: {}, 2: {}}, 1: {0: {}}, 2: {0: {}}} In [6]: nx.is_strongly_connected(G) Out[6]: True In [7]: G.remove_edge(0, 1) In [8]: G.edge Out[8]: {0: {2: {}}, 1: {0: {}}, 2: {0: {}}} In [9]: nx.is_strongly_connected(G) Out[9]: False 0 2 1 0 2 1 全てのノードの間に接続性があることを確認するためには、グラフの連結度を確認する。 有向グラフが強連結である時、全てのノードは相互に到達するための経路を持っている。 True → 強連結である False → 強連結でない
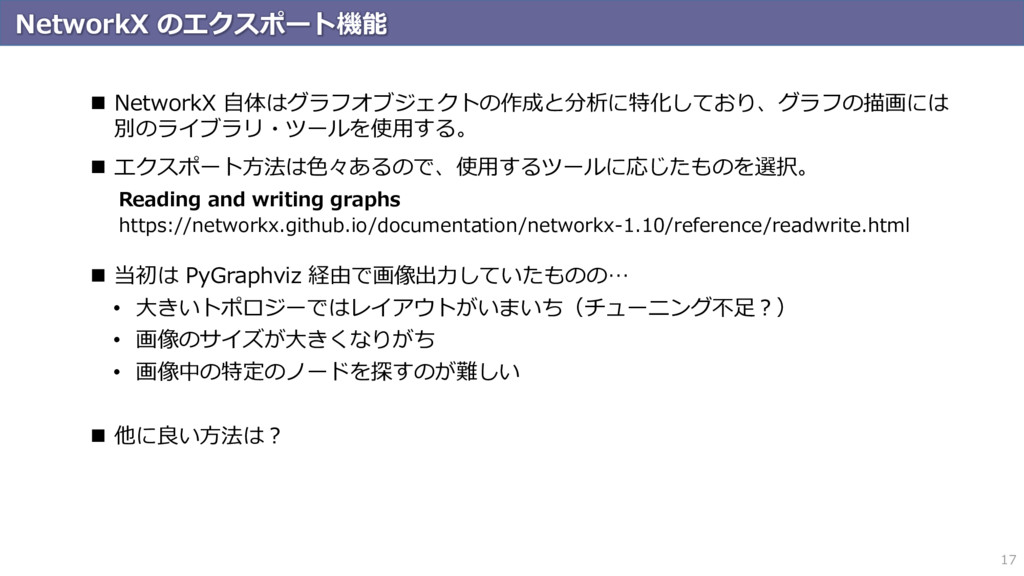
NetworkX のエクスポート機能 17 NetworkX 自体はグラフオブジェクトの作成と分析に特化しており、グラフの描画には 別のライブラリ・ツールを使用する。 エクスポート方法は色々あるので、使用するツールに応じたものを選択。 Reading
and writing graphs https://networkx.github.io/documentation/networkx-1.10/reference/readwrite.html 当初は PyGraphviz 経由で画像出力していたものの… • 大きいトポロジーではレイアウトがいまいち(チューニング不足?) • 画像のサイズが大きくなりがち • 画像中の特定のノードを探すのが難しい 他に良い方法は?
NeXt UI Toolkit 18 ネットワークトポロジーを扱う Web アプリケーションのための JavaScript ベースの
ツールキット。 Cisco によって開発されており、オープンソースとして Eclipse Public License v1.0 で公開されている。 Cisco のネットワーク管理ソフトウェアや VIRL、OpenDaylight 等で使用されている。 DevNet や GitHub に多数のチュートリアルやサンプルが公開されており、データ ソースさえ用意すれば、ほぼ開発無しで動くアプリが作れる。 日本語情報は。。。
関連リンク 19 GitHub レポジトリ https://github.com/NeXt-UI/next チュートリアル https://github.com/NeXt-UI/next-tutorials
DevNet https://developer.cisco.com/site/neXt/ DevNet 上の Demo サイト https://developer.cisco.com/site/neXt/discover/demo/ Cisco Community サイト https://communities.cisco.com/community/developer/devnetlabs/next dCloud 日本語スクリプト https://supportforums.cisco.com/kxiwq67737/attachments/kxiwq67737/12255886-docs- systems-engineering/89/1/d-08_overview-of-the-next-ui-toolkit.pdf
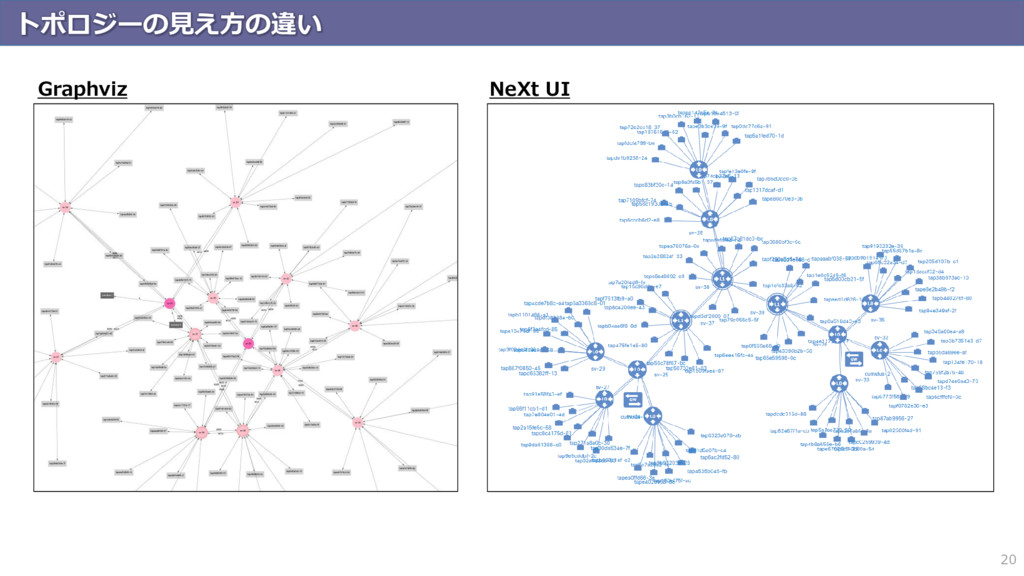
トポロジーの見え方の違い 20 Graphviz NeXt UI
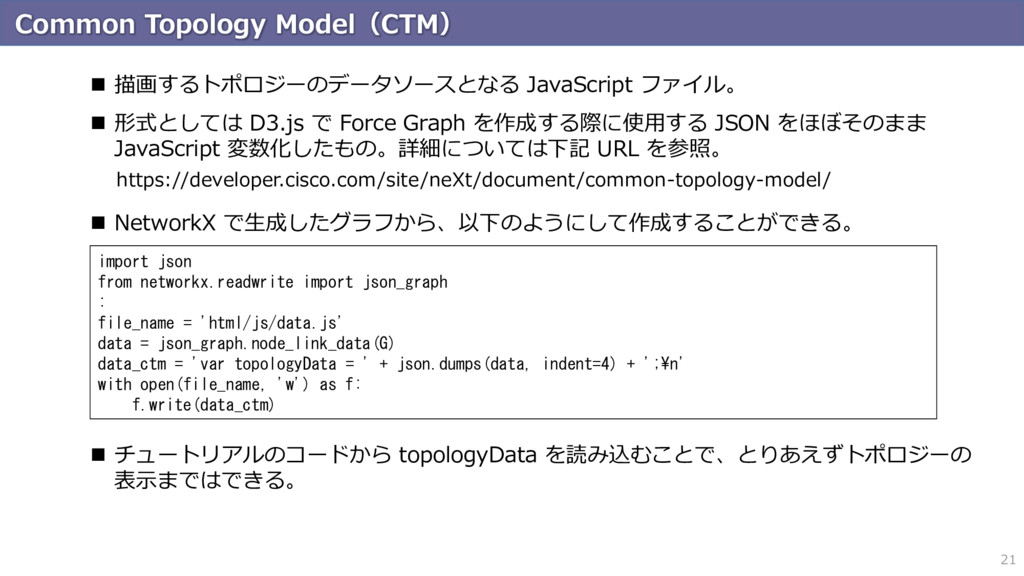
Common Topology Model(CTM) 21 描画するトポロジーのデータソースとなる JavaScript ファイル。 形式としては
D3.js で Force Graph を作成する際に使用する JSON をほぼそのまま JavaScript 変数化したもの。詳細については下記 URL を参照。 https://developer.cisco.com/site/neXt/document/common-topology-model/ NetworkX で生成したグラフから、以下のようにして作成することができる。 import json from networkx.readwrite import json_graph : file_name = 'html/js/data.js' data = json_graph.node_link_data(G) data_ctm = 'var topologyData = ' + json.dumps(data, indent=4) + ';¥n' with open(file_name, 'w') as f: f.write(data_ctm) チュートリアルのコードから topologyData を読み込むことで、とりあえずトポロジーの 表示まではできる。
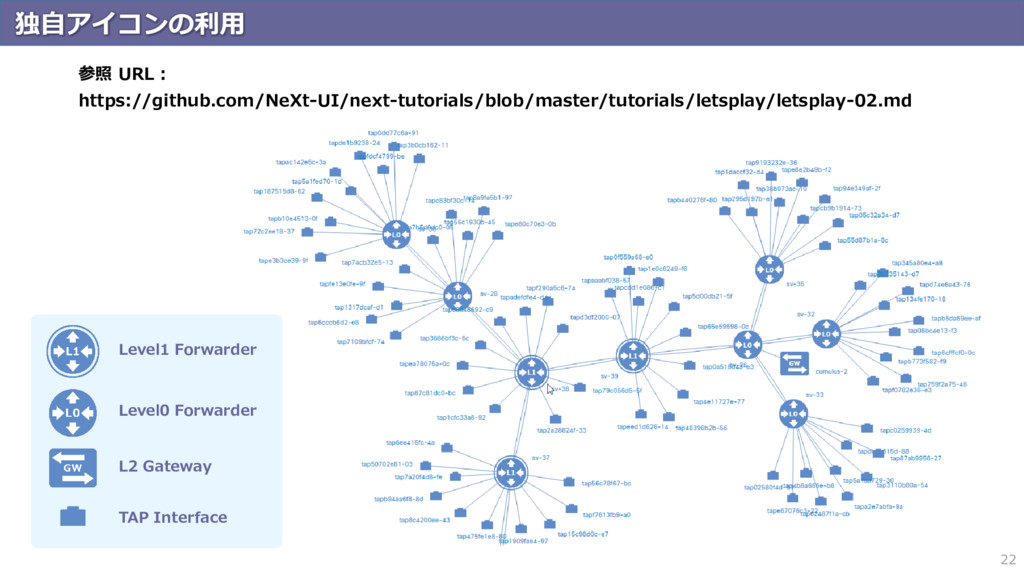
独自アイコンの利用 22 Level1 Forwarder Level0 Forwarder L2 Gateway TAP Interface
参照 URL: https://github.com/NeXt-UI/next-tutorials/blob/master/tutorials/letsplay/letsplay-02.md
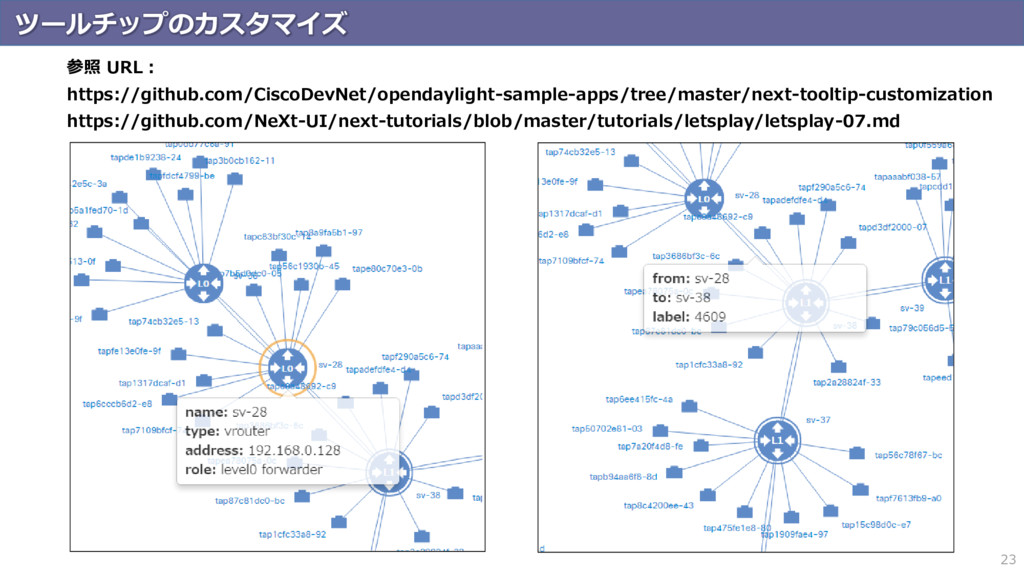
ツールチップのカスタマイズ 23 参照 URL: https://github.com/CiscoDevNet/opendaylight-sample-apps/tree/master/next-tooltip-customization https://github.com/NeXt-UI/next-tutorials/blob/master/tutorials/letsplay/letsplay-07.md
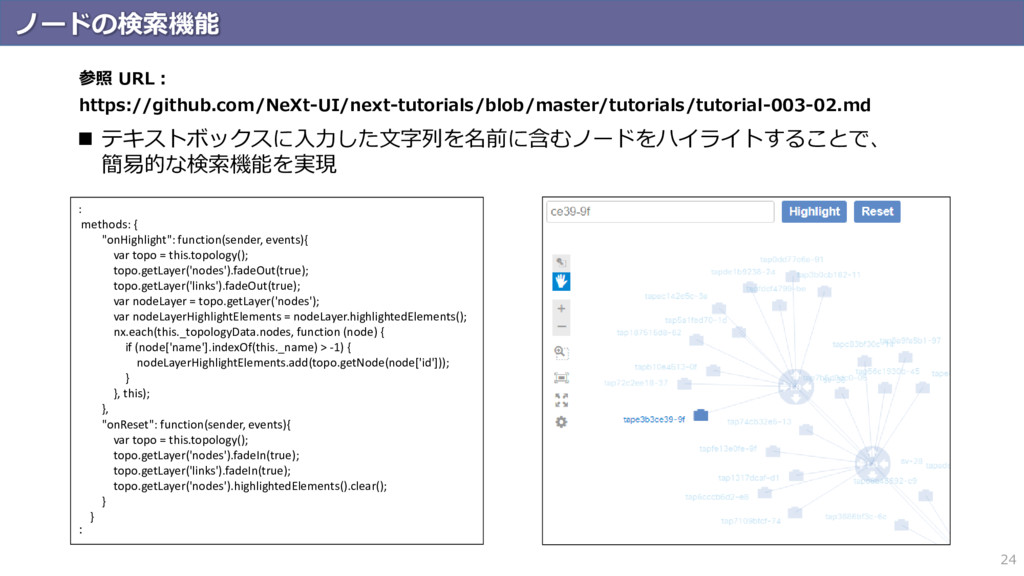
ノードの検索機能 24 テキストボックスに入力した文字列を名前に含むノードをハイライトすることで、 簡易的な検索機能を実現 : methods: { "onHighlight": function(sender,
events){ var topo = this.topology(); topo.getLayer('nodes').fadeOut(true); topo.getLayer('links').fadeOut(true); var nodeLayer = topo.getLayer('nodes'); var nodeLayerHighlightElements = nodeLayer.highlightedElements(); nx.each(this._topologyData.nodes, function (node) { if (node['name'].indexOf(this._name) > -1) { nodeLayerHighlightElements.add(topo.getNode(node['id'])); } }, this); }, "onReset": function(sender, events){ var topo = this.topology(); topo.getLayer('nodes').fadeIn(true); topo.getLayer('links').fadeIn(true); topo.getLayer('nodes').highlightedElements().clear(); } } : 参照 URL: https://github.com/NeXt-UI/next-tutorials/blob/master/tutorials/tutorial-003-02.md
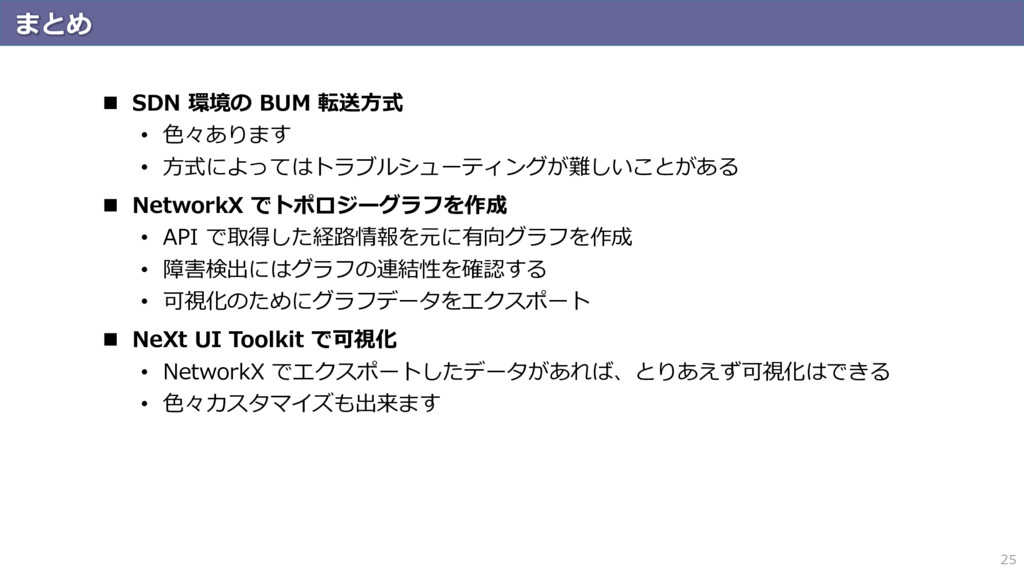
まとめ 25 SDN 環境の BUM 転送方式 • 色々あります •
方式によってはトラブルシューティングが難しいことがある NetworkX でトポロジーグラフを作成 • API で取得した経路情報を元に有向グラフを作成 • 障害検出にはグラフの連結性を確認する • 可視化のためにグラフデータをエクスポート NeXt UI Toolkit で可視化 • NetworkX でエクスポートしたデータがあれば、とりあえず可視化はできる • 色々カスタマイズも出来ます
![グラフの連結度の確認 16 In [1]: import networkx as nx In [2]:](https://files.speakerdeck.com/presentations/d92725d383c94dfab2f55535295f12fb/slide_15.jpg)