This is a talk I gave at JavaONE 2017 and NetBean's Day in which I presented some free tooling that can be used to diagnose performance regressions in production.applications
performance diagnostic model ▸ Bring predictability into the diagnostic process ▸ Co-founded jClarity ▸ Building the smart generation of performance diagnostic tooling ▸ Co-founded JCrete ▸ The hotest unconference on the planet ▸ Java Champion (2006)
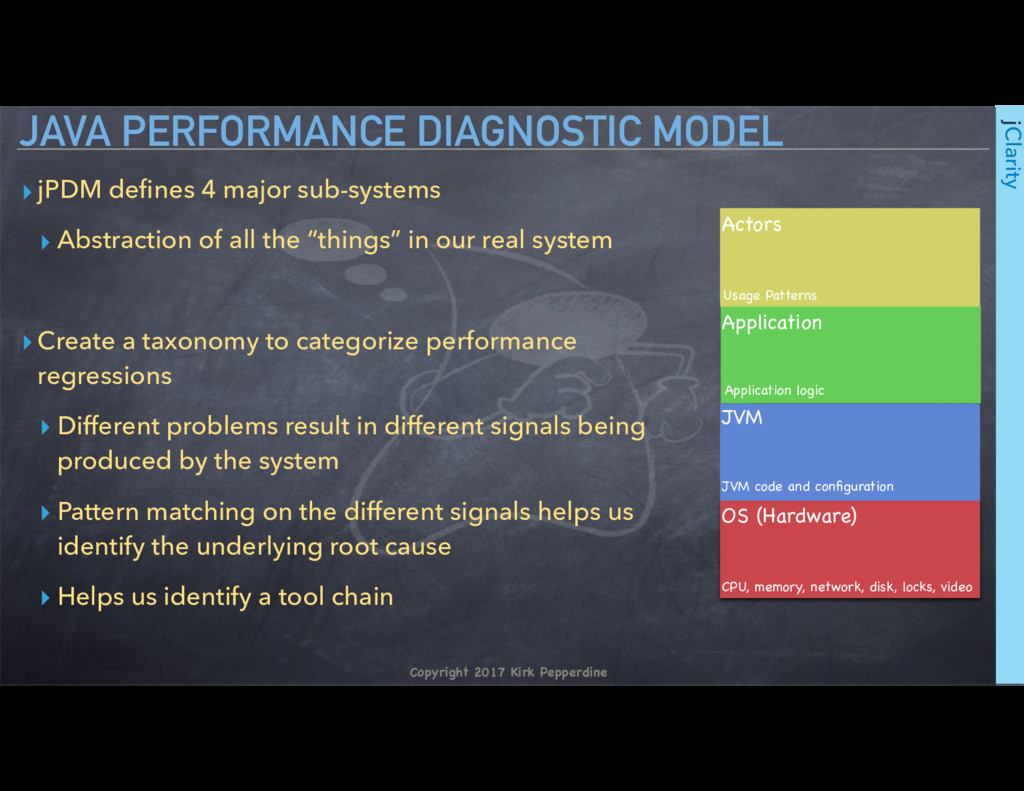
▸ Abstraction of all the “things” in our real system ▸Create a taxonomy to categorize performance regressions ▸ Different problems result in different signals being produced by the system ▸ Pattern matching on the different signals helps us identify the underlying root cause ▸ Helps us identify a tool chain JAVA PERFORMANCE DIAGNOSTIC MODEL Application Application logic OS (Hardware) CPU, memory, network, disk, locks, video JVM JVM code and configuration Actors Usage Patterns
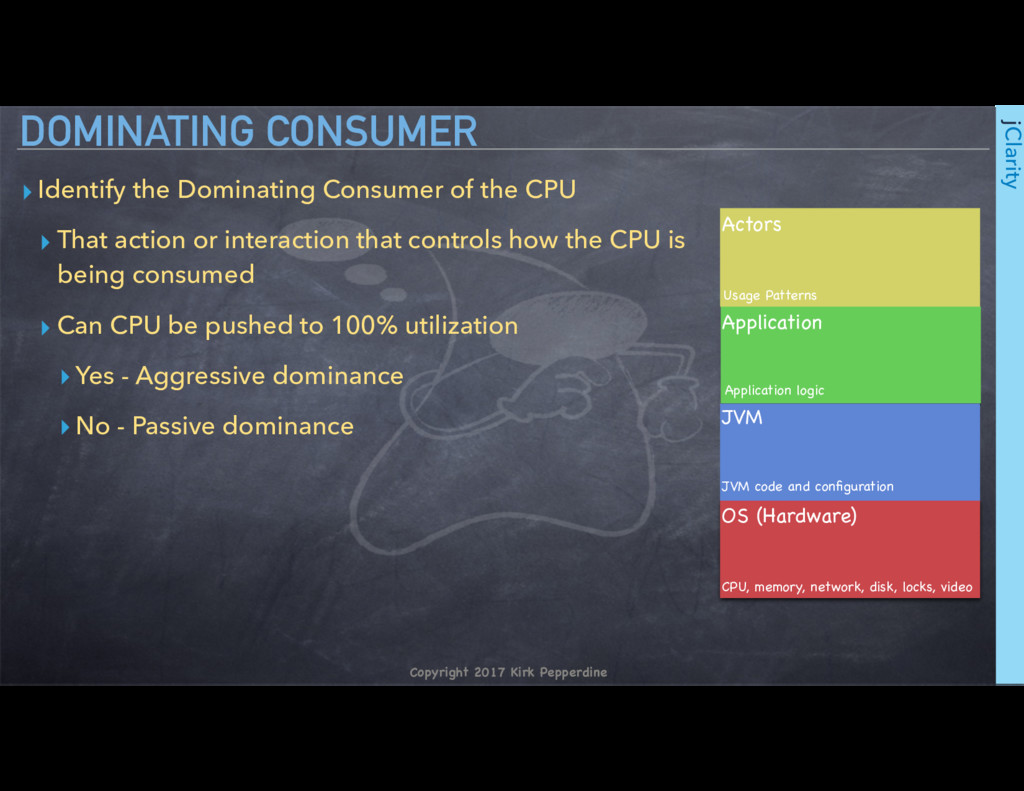
the CPU ▸ That action or interaction that controls how the CPU is being consumed ▸ Can CPU be pushed to 100% utilization ▸Yes - Aggressive dominance ▸No - Passive dominance DOMINATING CONSUMER Application Application logic OS (Hardware) CPU, memory, network, disk, locks, video JVM JVM code and configuration Actors Usage Patterns
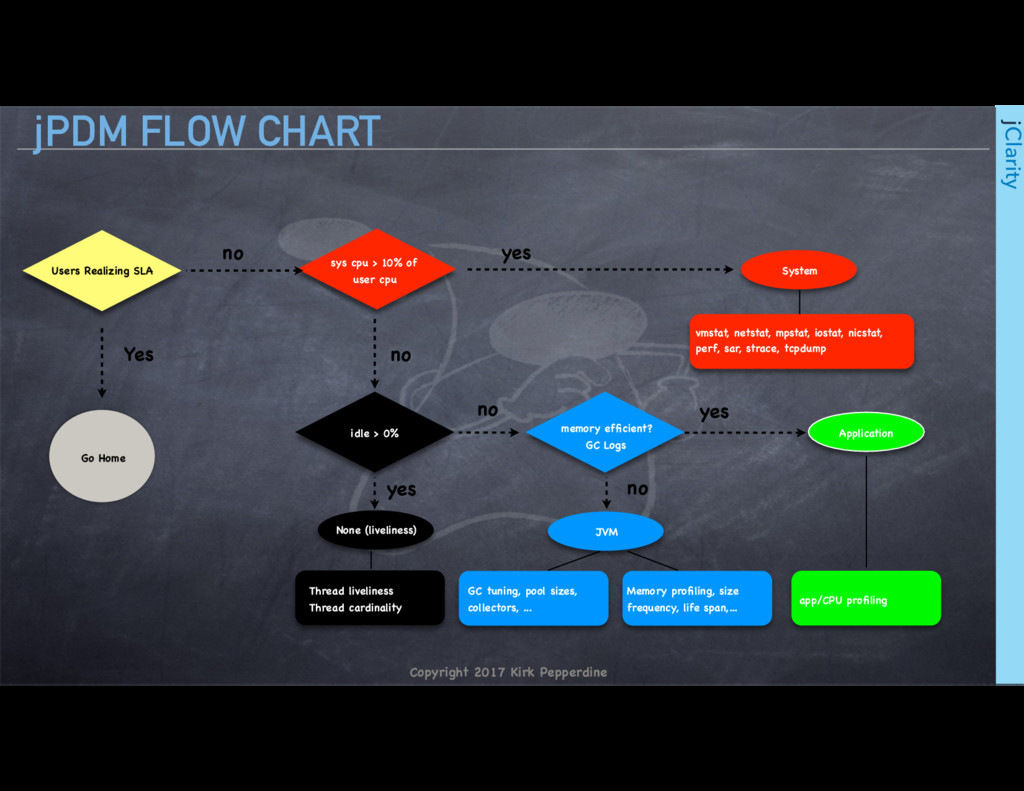
> 10% of user cpu idle > 0% memory efficient? GC Logs Application JVM None (liveliness) System vmstat, netstat, mpstat, iostat, nicstat, perf, sar, strace, tcpdump Thread liveliness Thread cardinality app/CPU profiling GC tuning, pool sizes, collectors, ... Memory profiling, size frequency, life span,... yes no yes no no yes Users Realizing SLA no Yes Go Home