Improvement Plan that will be Executed Over a Period of Time Martin, Karen; Martin, Karen; Osterling, Mike; Osterling, Mike. (2017). Value Stream Mapping: How to Visualize Work and Align Leadership for Organizational Transformation. McGraw-Hill Education. Kindle Edition.
a value stream map is macro level; the specific steps needed to generate output are irrelevant at this point. • This is what differentiates a value stream map from a process map. • A process map would include all the individual actions (steps) required to enter an order, quote a project, administer medication, perform validation testing, or make an arrest, whereas… • A value stream map looks at the high-level activities that transform a request into some sort of deliverable. • The purpose of value stream mapping is to design a strategic improvement plan that will be executed over a period; it’s not designed to address problems at a detailed level.
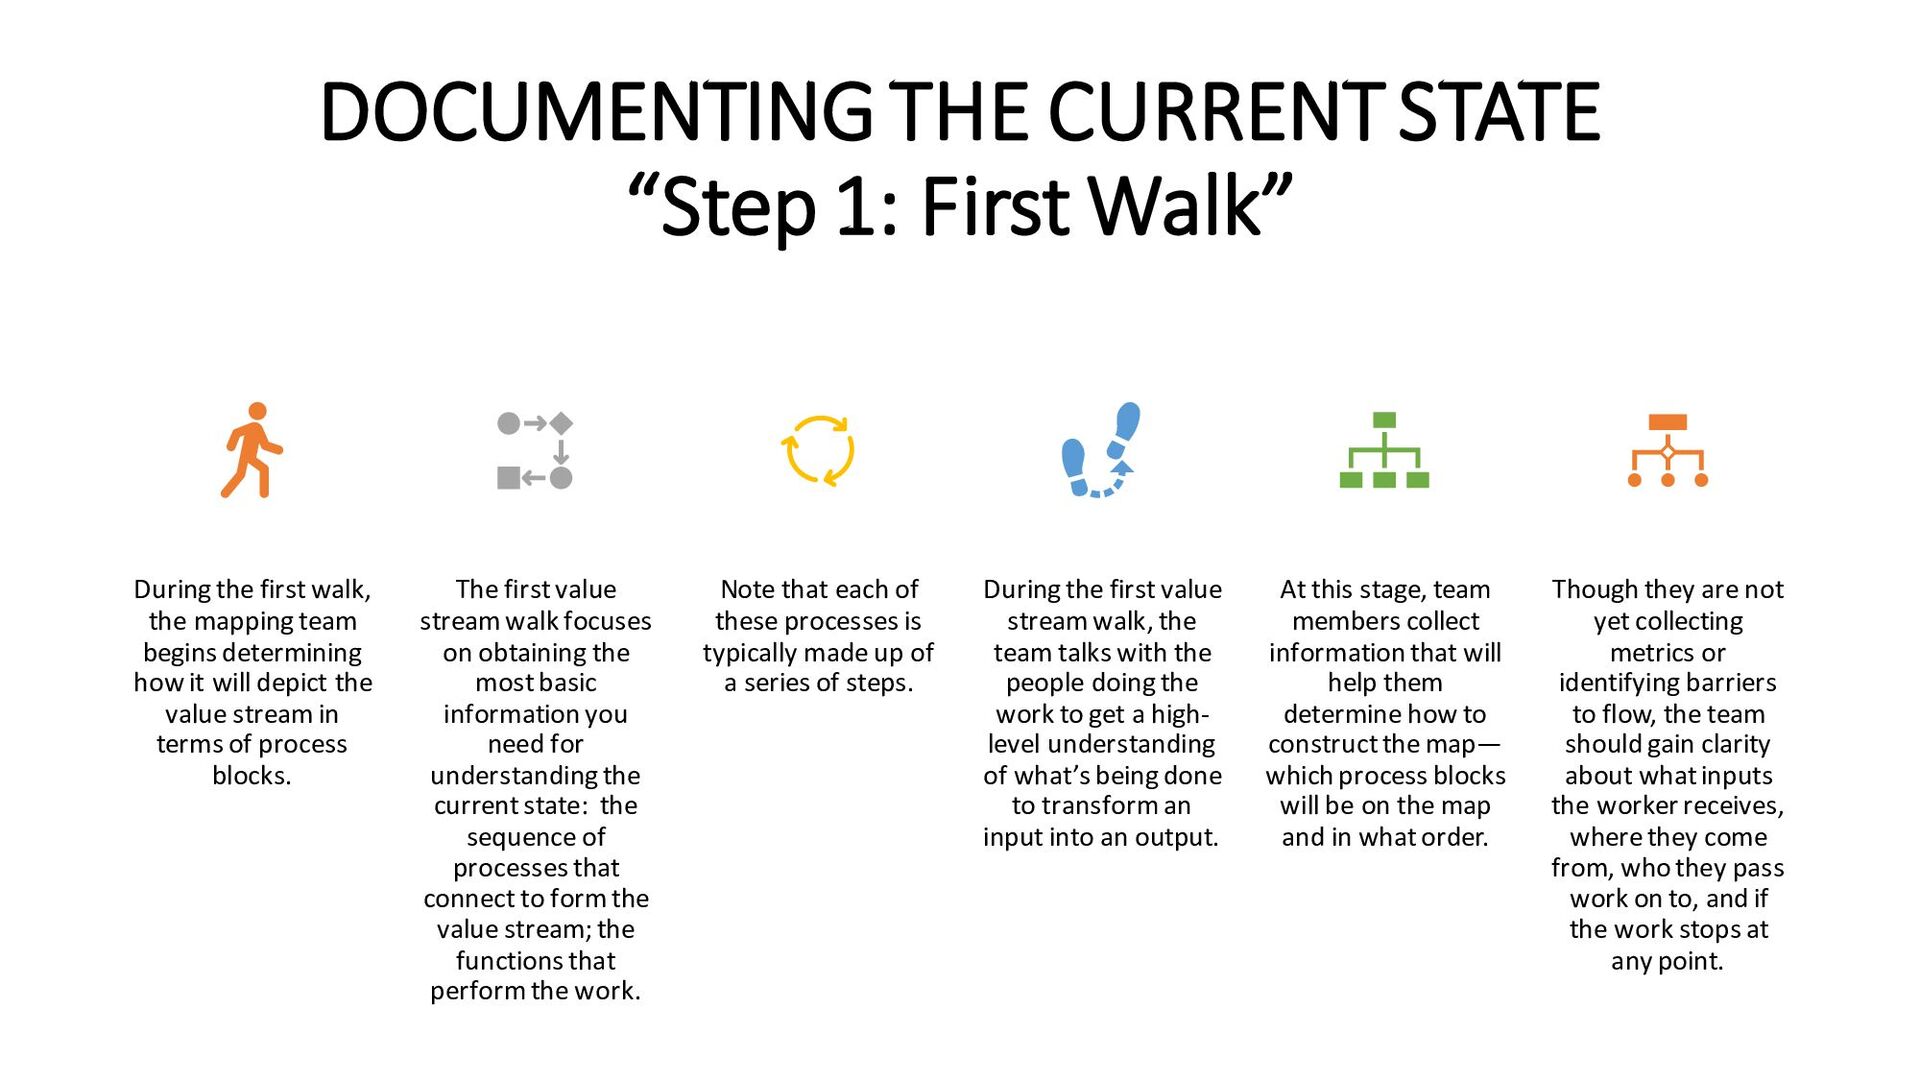
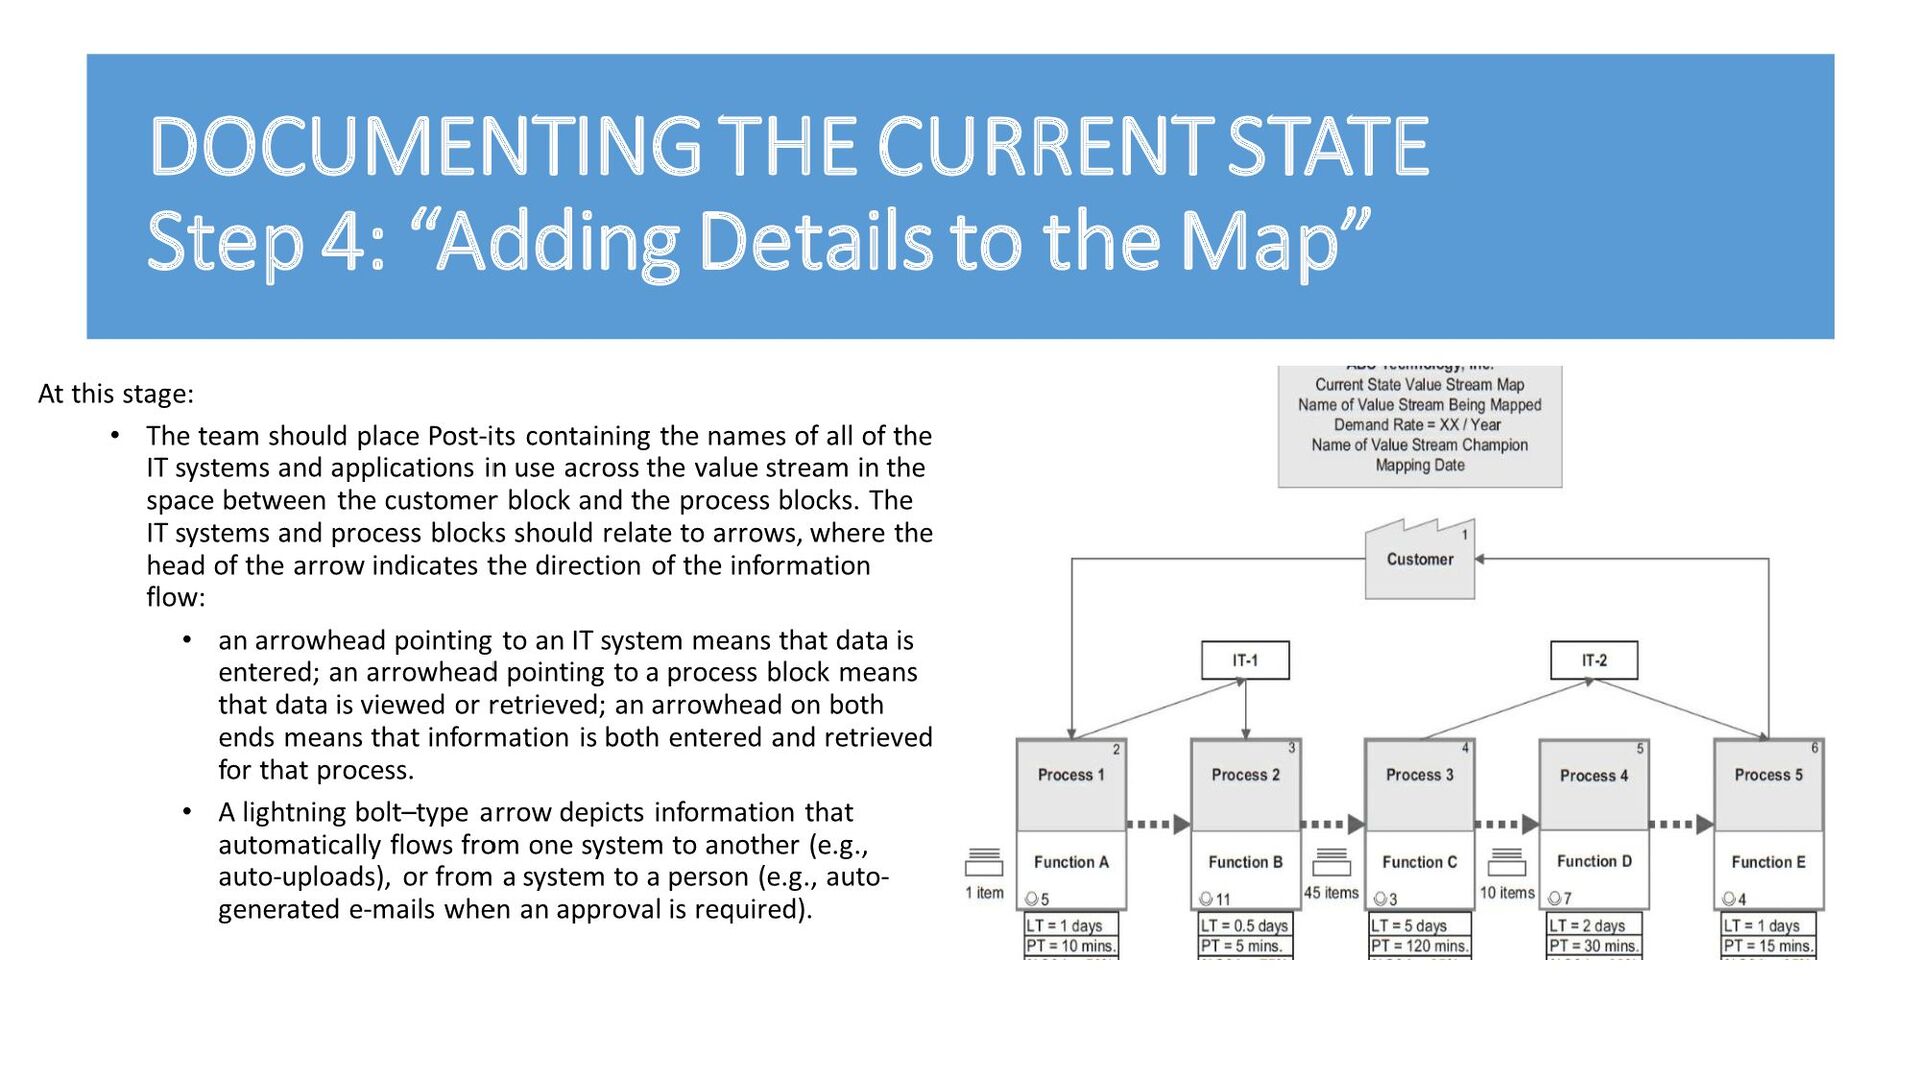
first walk, the mapping team begins determining how it will depict the value stream in terms of process blocks. The first value stream walk focuses on obtaining the most basic information you need for understanding the current state: the sequence of processes that connect to form the value stream; the functions that perform the work. Note that each of these processes is typically made up of a series of steps. During the first value stream walk, the team talks with the people doing the work to get a high- level understanding of what’s being done to transform an input into an output. At this stage, team members collect information that will help them determine how to construct the map— which process blocks will be on the map and in what order. Though they are not yet collecting metrics or identifying barriers to flow, the team should gain clarity about what inputs the worker receives, where they come from, who they pass work on to, and if the work stops at any point.
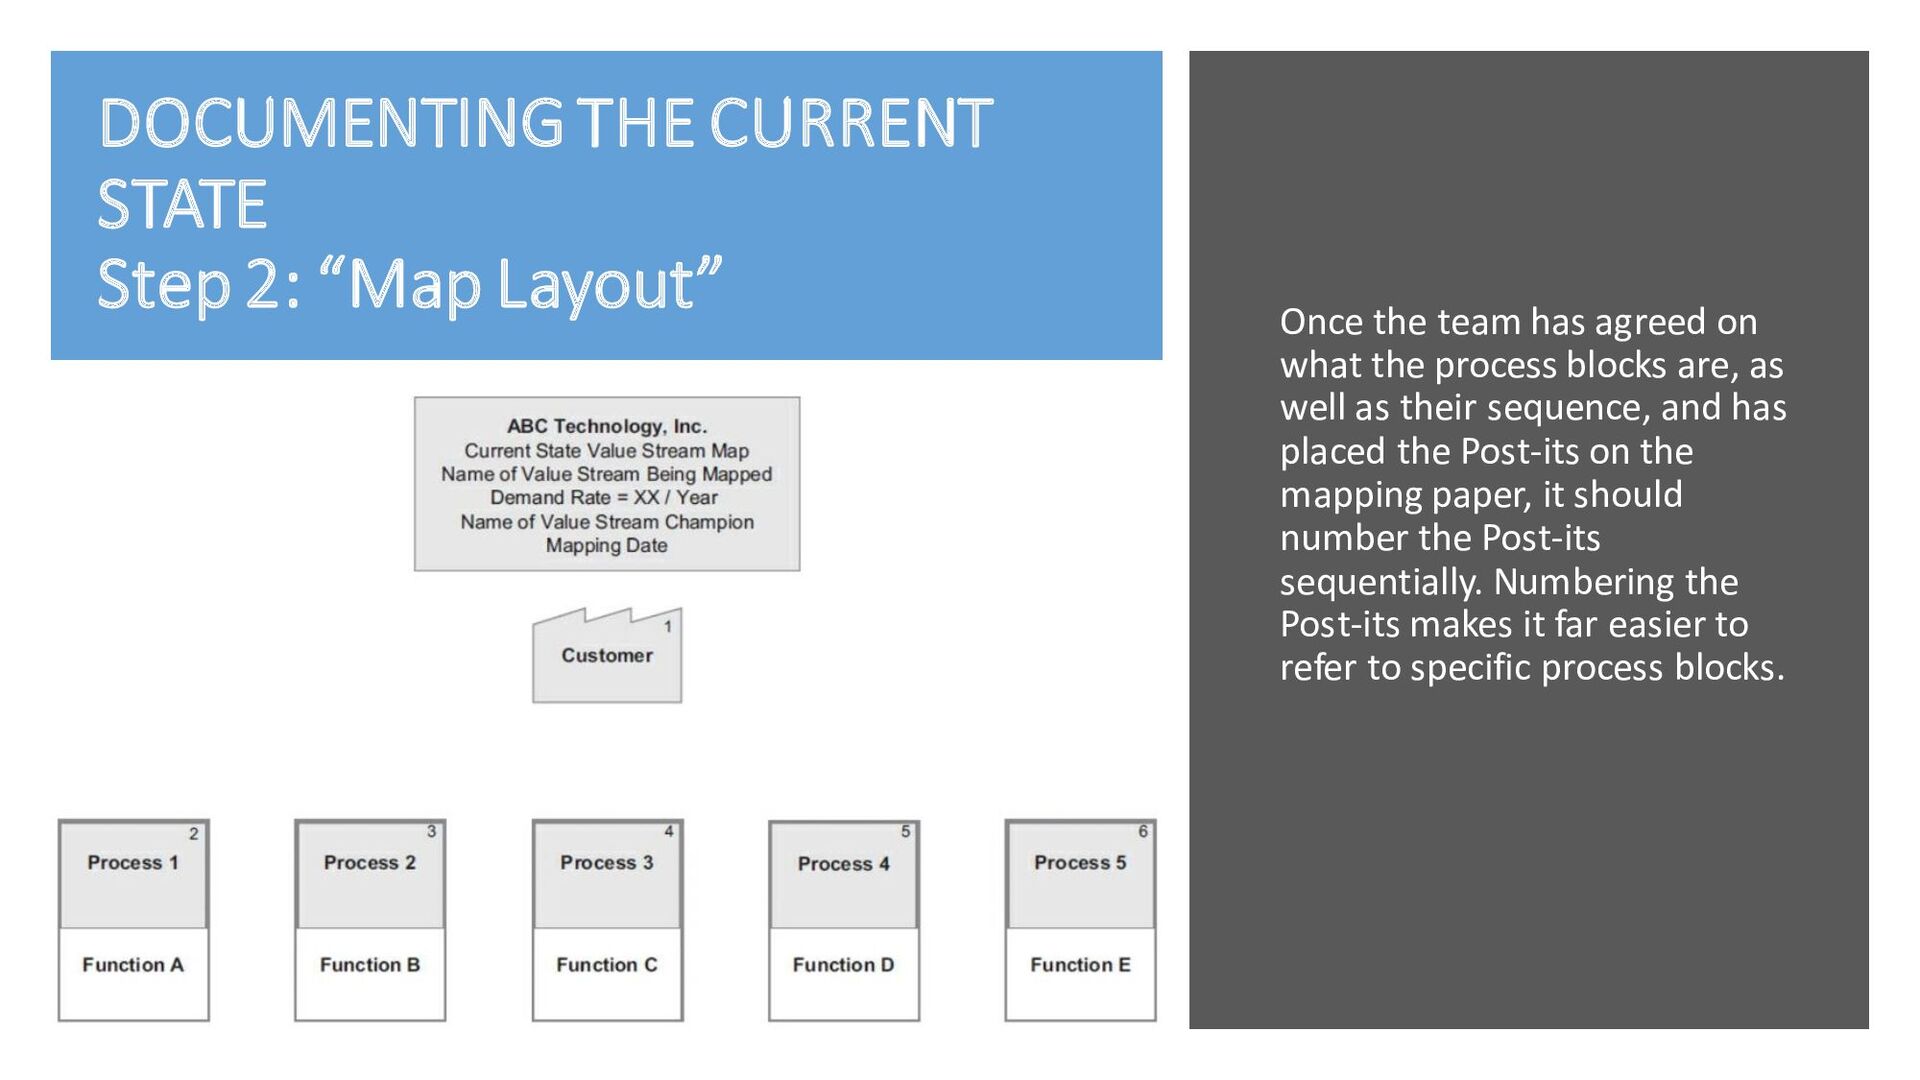
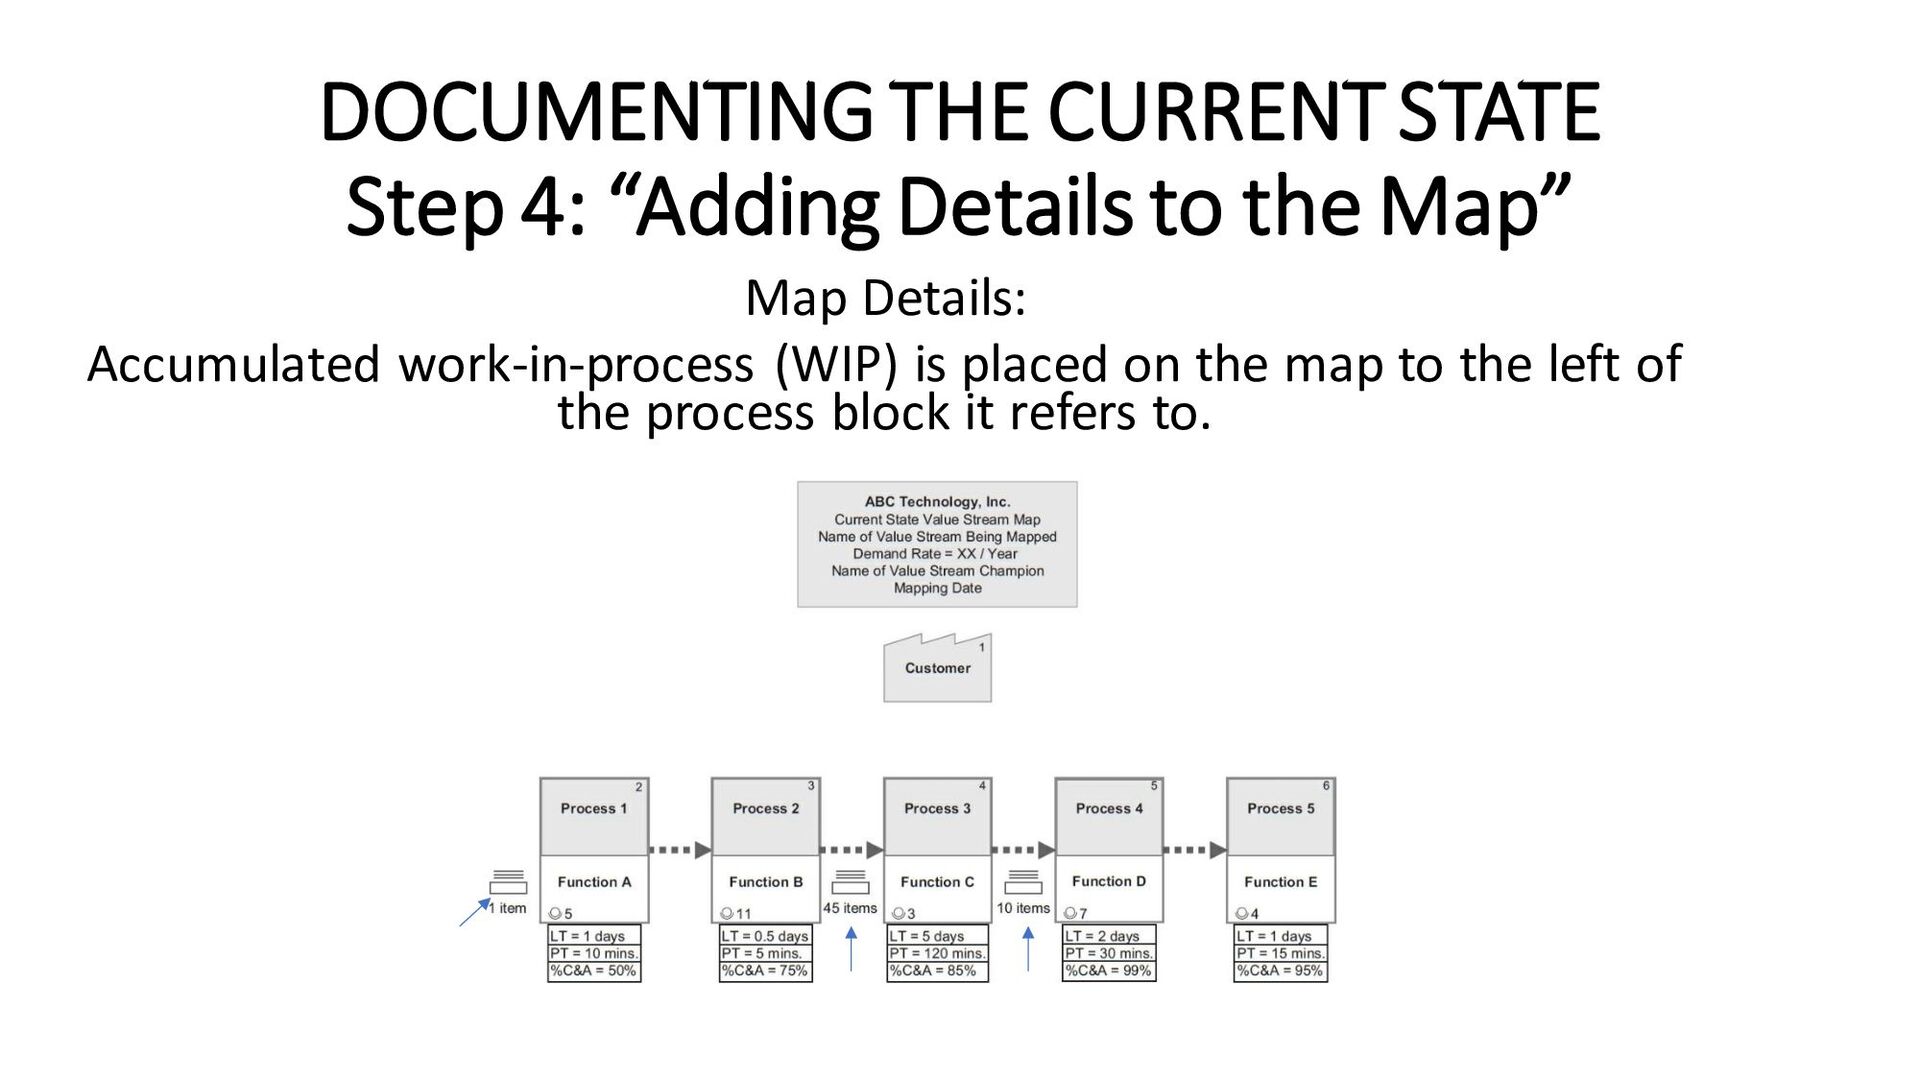
begin building a rudimentary view of the value stream by placing four- by six-inch Post-its on the mapping paper. • The team focuses on the basics—what is done, who does it, and in what order— upon which they’ll layer in detail down the road. • The Post-it for the customer—whether external as is found in a full value stream or internal (value stream segment or support value stream)—is typically placed in the top center position on the mapping paper. • If the value stream involves outside suppliers, we typically place the customer Post- it in the upper right of our maps and the supplier in the upper left. • But for those value streams with no external suppliers, we place the customer Post-it in the top center position. • Next, the team agrees on the process blocks that will form the value stream. (note, determining how macro to go takes some practice.) • To aid in targeting the right level of information, we aim for 5 to 15 serial process blocks. • Flow is present when work moves from one process to the next in the value stream without interruption or delay. • Once the team members agree on the process blocks, they write a description of the activities in the fewest words possible and in verb-plus-noun format (e.g., test specimen, interview candidates, enter order, create drawing) and the functions that perform them on the Post-its, using only the upper portion of the Post-it.
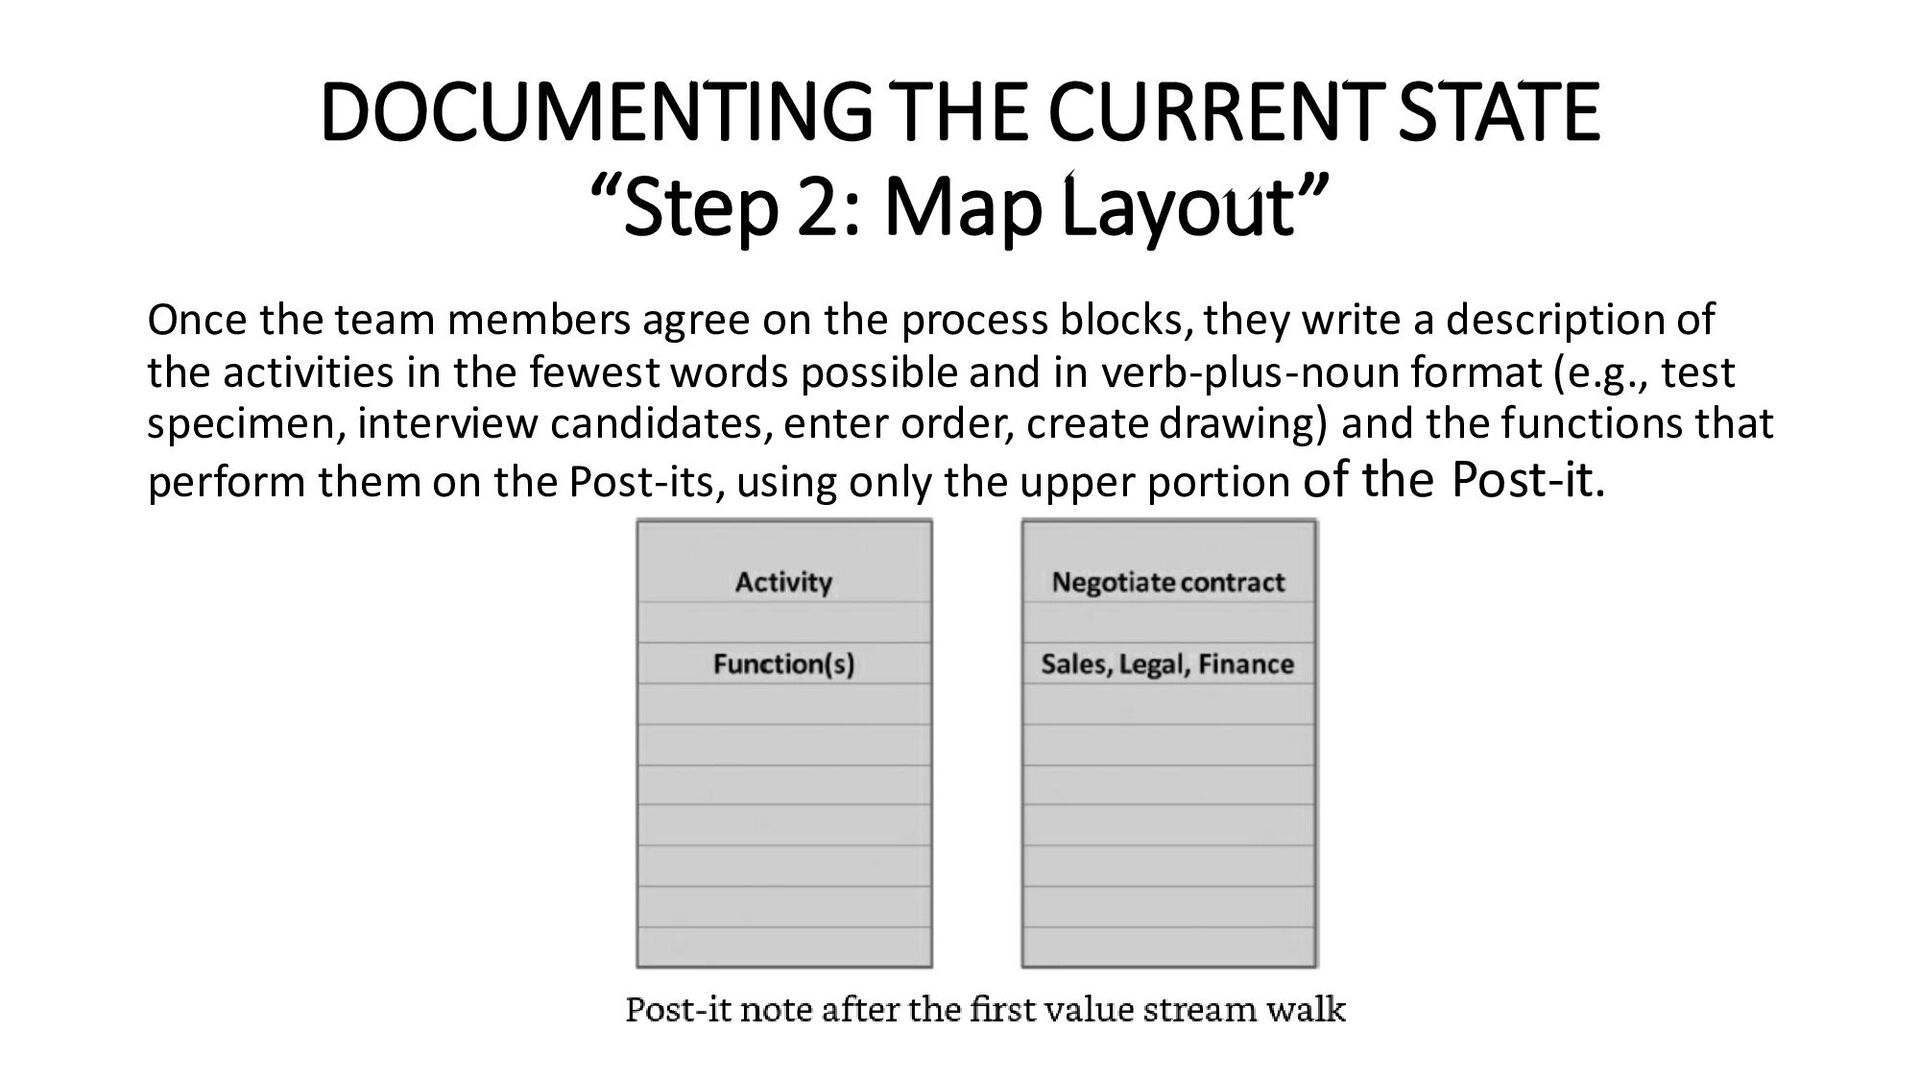
team members agree on the process blocks, they write a description of the activities in the fewest words possible and in verb-plus-noun format (e.g., test specimen, interview candidates, enter order, create drawing) and the functions that perform them on the Post-its, using only the upper portion of the Post-it.
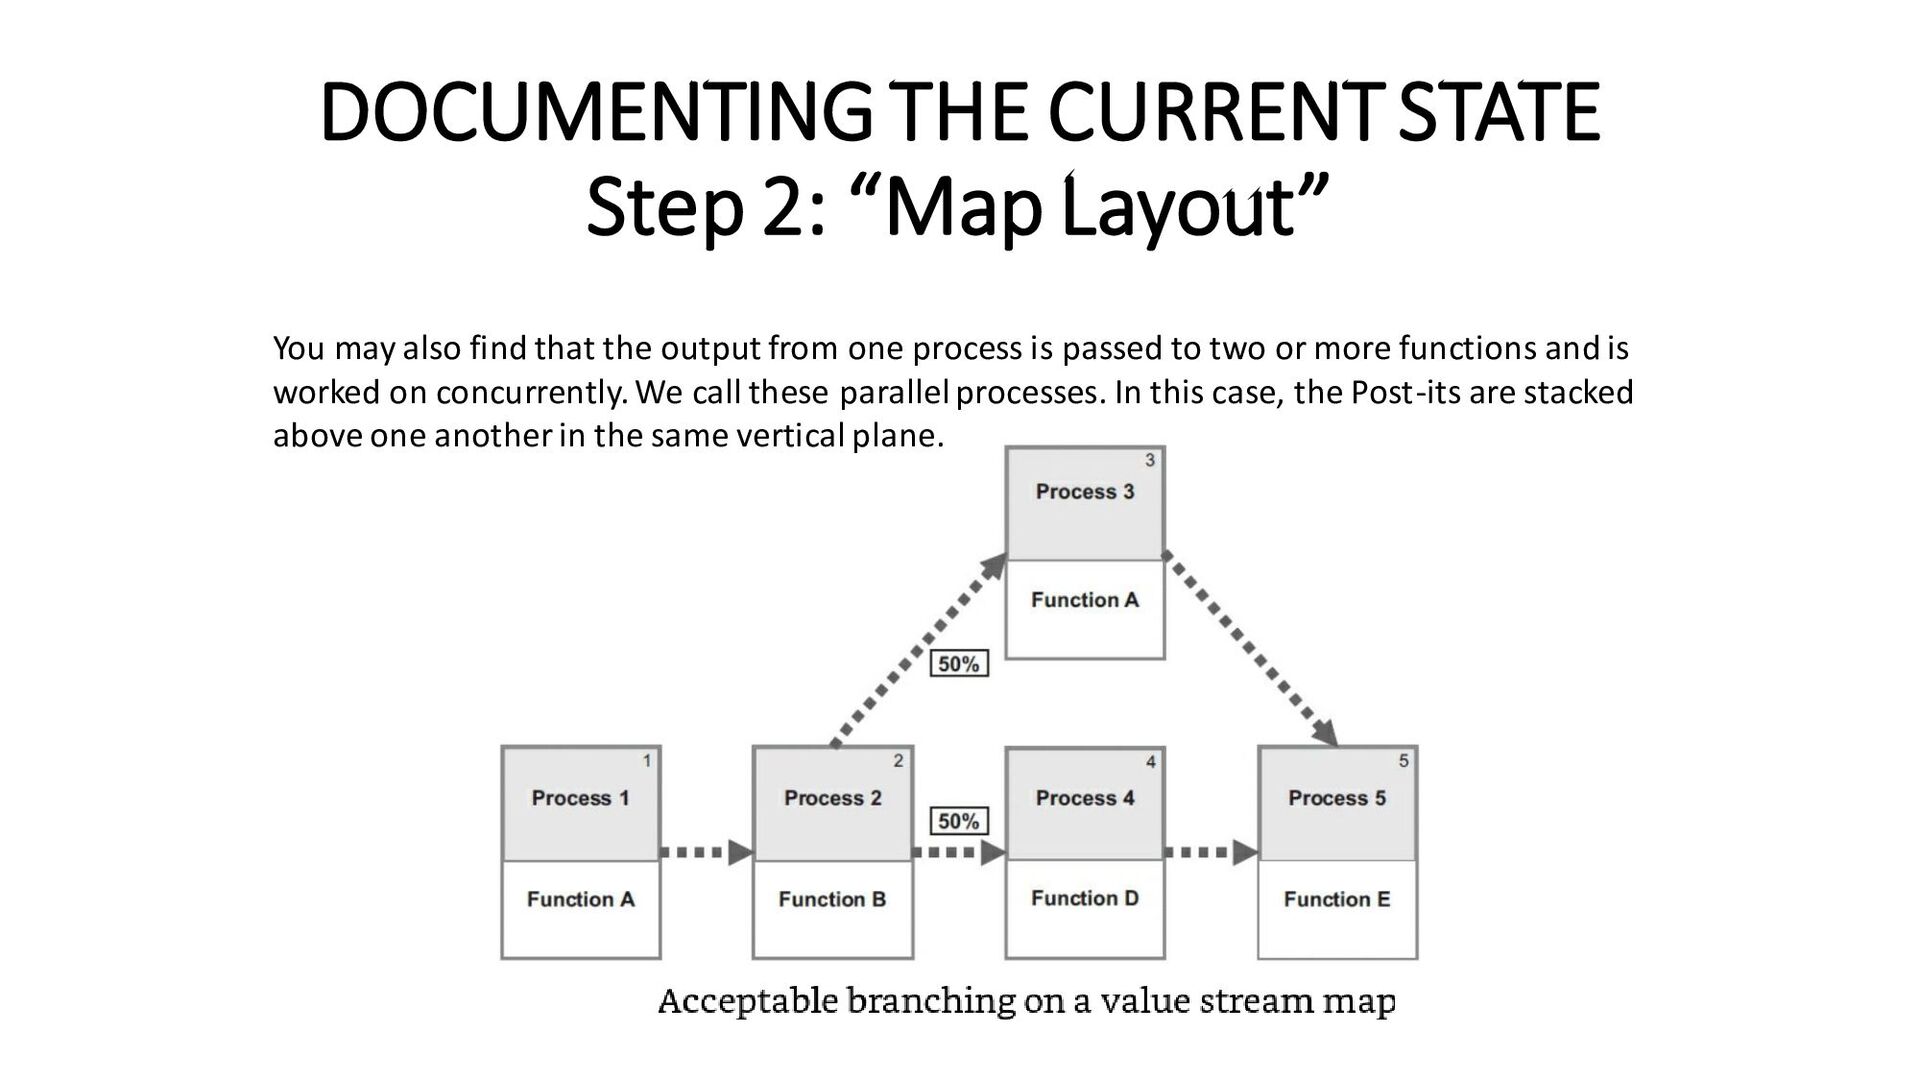
also find that the output from one process is passed to two or more functions and is worked on concurrently. We call these parallel processes. In this case, the Post-its are stacked above one another in the same vertical plane.
team has agreed on what the process blocks are, as well as their sequence, and has placed the Post-its on the mapping paper, it should number the Post-its sequentially. Numbering the Post-its makes it far easier to refer to specific process blocks.
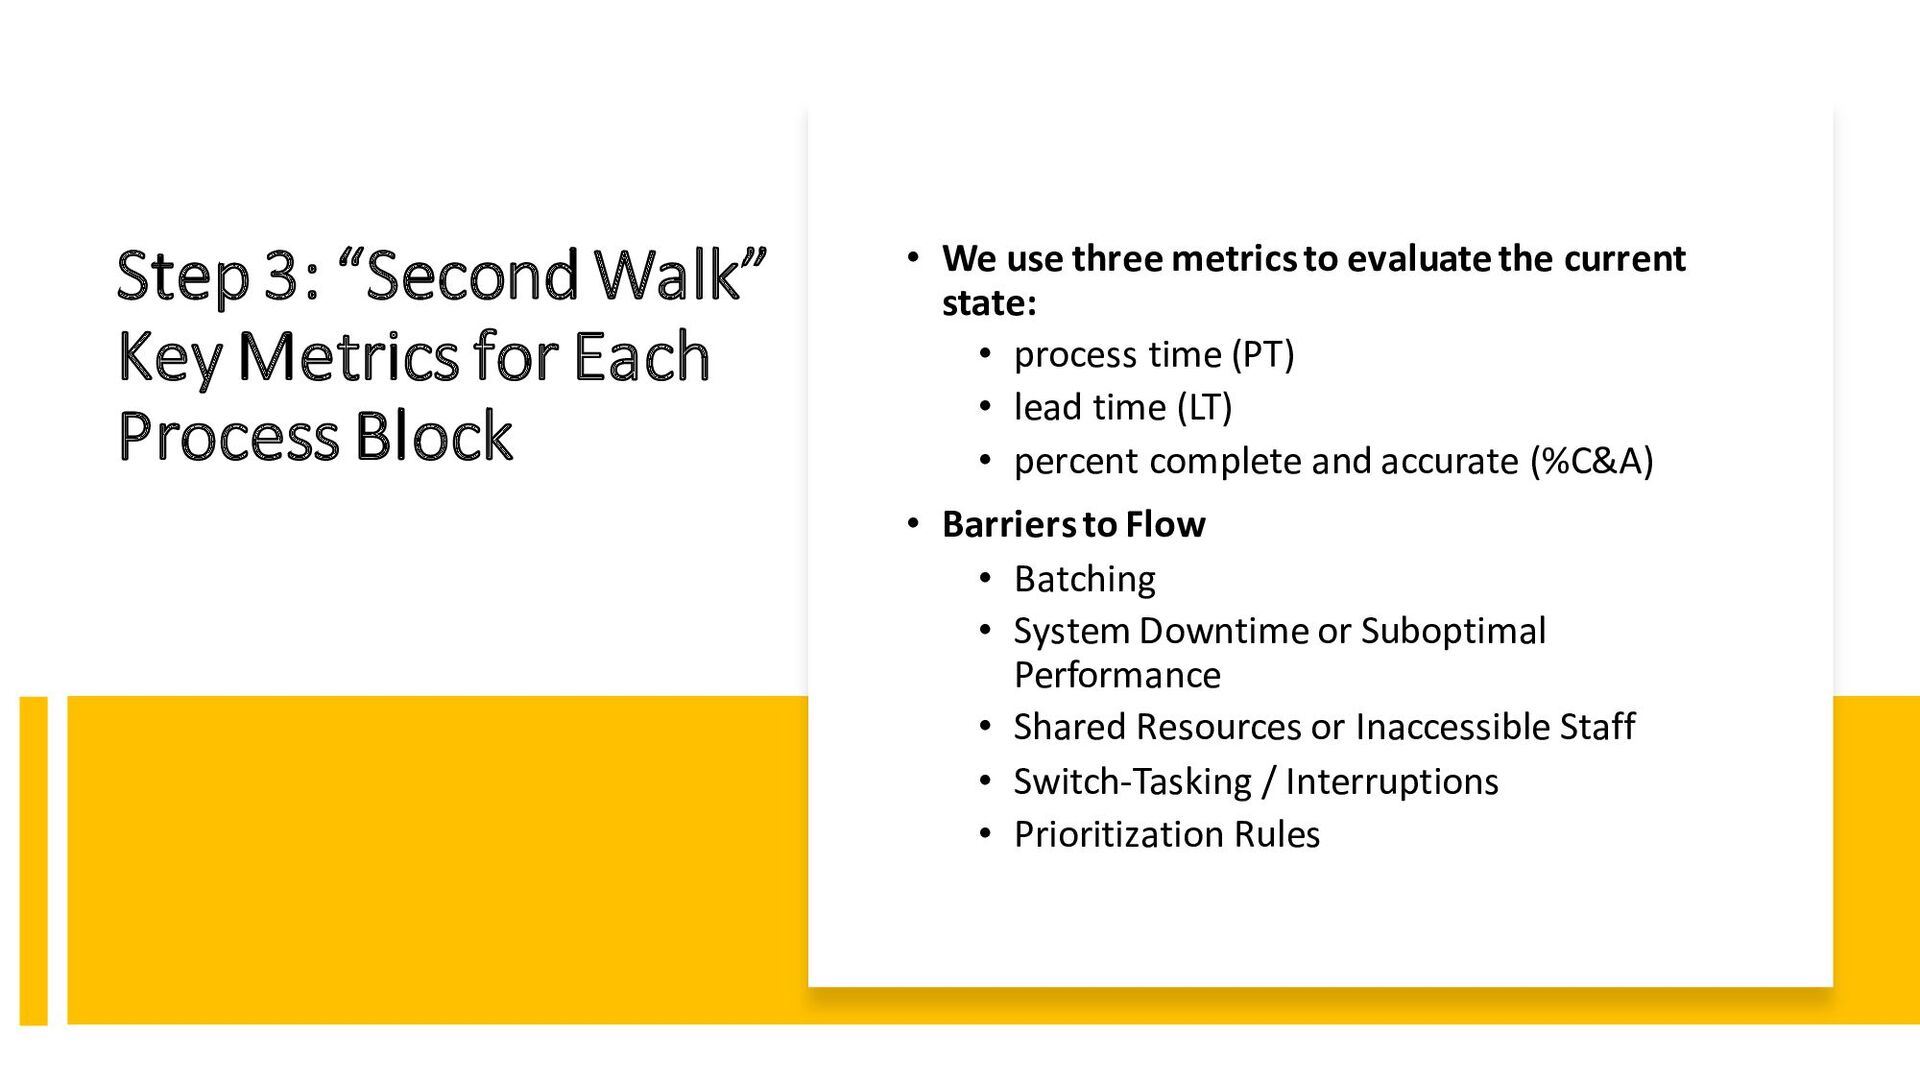
of the second value stream walk is for the team to gain a deeper understanding about how the value stream currently performs and identify significant barriers to flow. Every value stream has unique characteristics. Therefore, every value stream will require that you assess current state performance based on the specific problems you wish to address and/or opportunities you wish to leverage, the type of work flowing through the system, and the work environment. In most circumstances, grasping the current condition of a value stream targeted for improvement requires that you assess its performance in terms of both time and quality. The team needs to understand the speed at which work progresses from process to process, the hands-on work effort required, and the quality of the process output that moves through the value stream.
• We use three metrics to evaluate the current state: • process time (PT) • lead time (LT) • percent complete and accurate (%C&A) • Barriers to Flow • Batching • System Downtime or Suboptimal Performance • Shared Resources or Inaccessible Staff • Switch-Tasking / Interruptions • Prioritization Rules
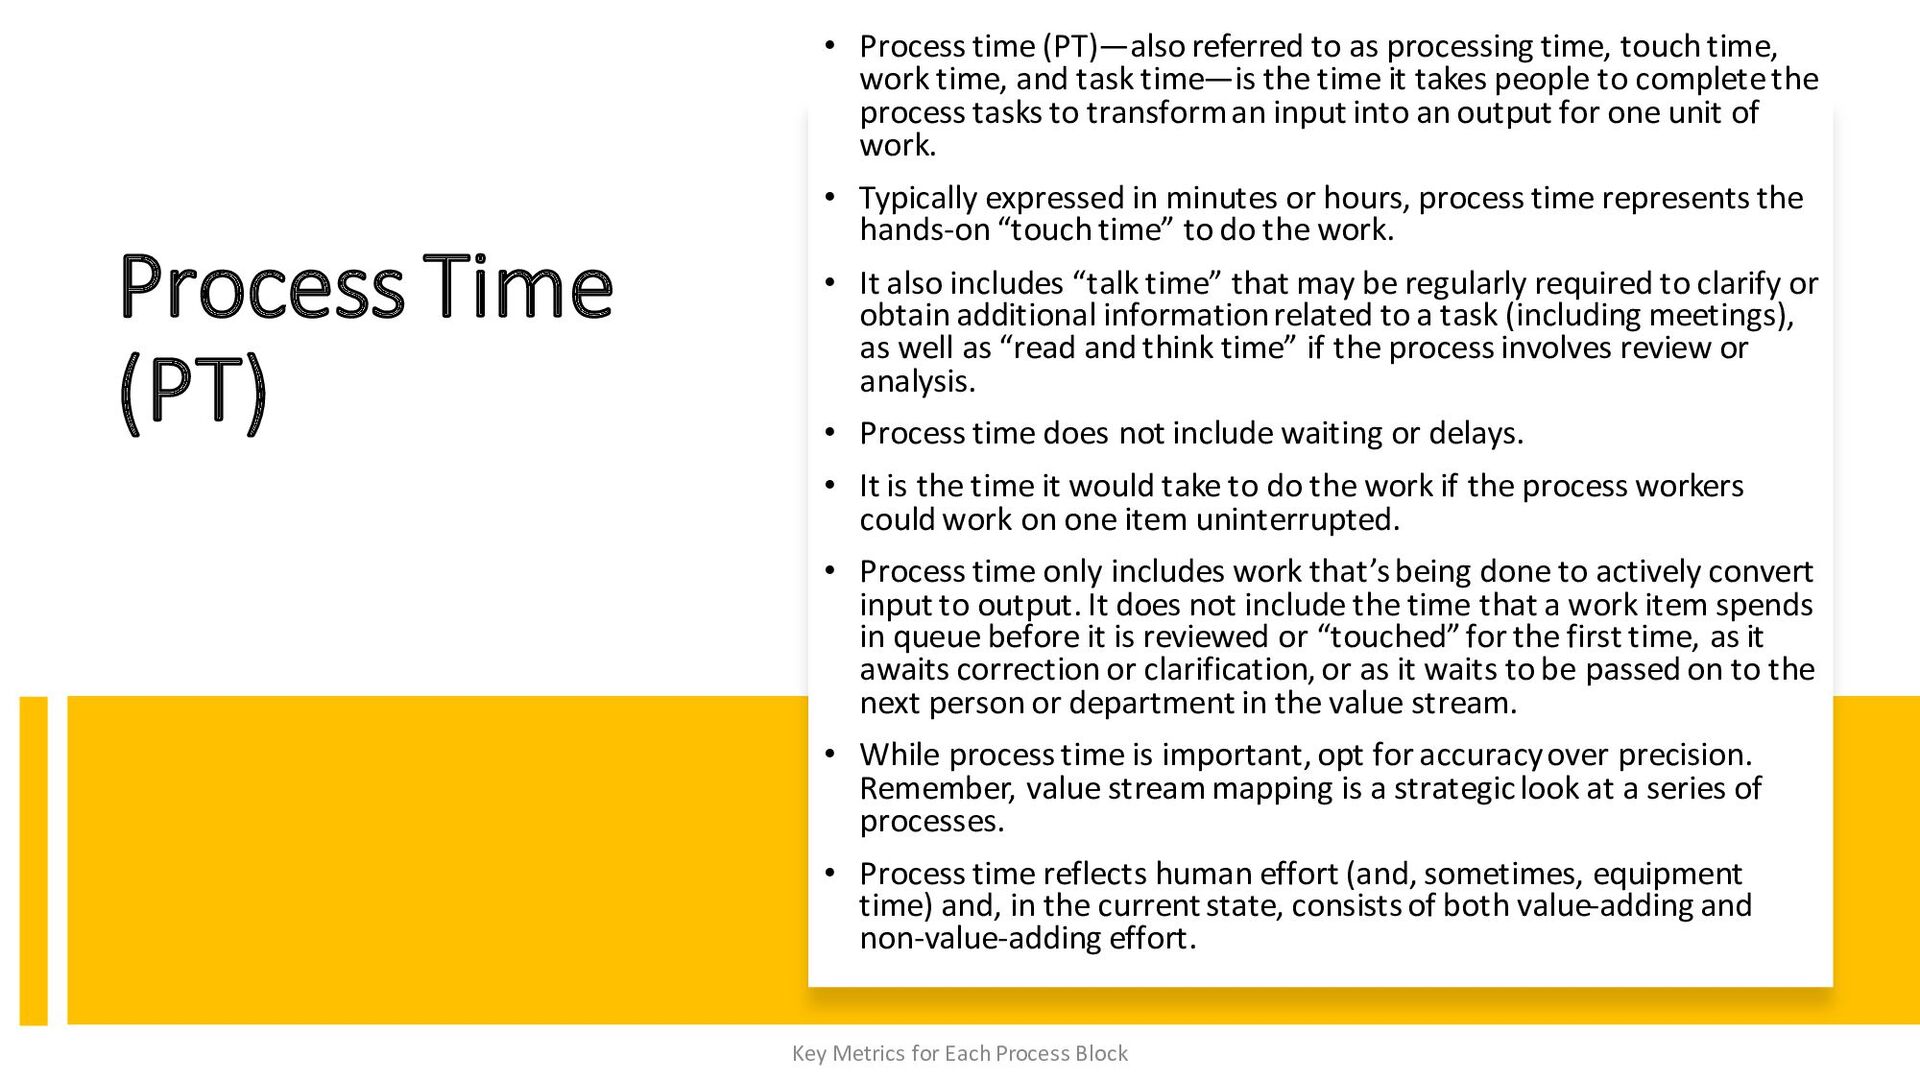
processing time, touch time, work time, and task time—is the time it takes people to complete the process tasks to transform an input into an output for one unit of work. • Typically expressed in minutes or hours, process time represents the hands-on “touch time” to do the work. • It also includes “talk time” that may be regularly required to clarify or obtain additional information related to a task (including meetings), as well as “read and think time” if the process involves review or analysis. • Process time does not include waiting or delays. • It is the time it would take to do the work if the process workers could work on one item uninterrupted. • Process time only includes work that’s being done to actively convert input to output. It does not include the time that a work item spends in queue before it is reviewed or “touched” for the first time, as it awaits correction or clarification, or as it waits to be passed on to the next person or department in the value stream. • While process time is important, opt for accuracy over precision. Remember, value stream mapping is a strategic look at a series of processes. • Process time reflects human effort (and, sometimes, equipment time) and, in the current state, consists of both value-adding and non-value-adding effort. Key Metrics for Each Process Block
values and is willing to pay for—or that’s a requirement of doing business with the customer. All other expenses and effort are non-value-adding. Key Metrics for Each Process Block
two types of non-value-adding work: necessary and unnecessary. • Necessary non-value-adding work includes activities that an organization believes it must presently do to have a viable business. • We sometimes refer to this work as value-enabling. • In other words, if this work wasn’t performed, the organization would be hard-pressed to deliver value.
work: necessary and unnecessary. • Unnecessary non-value-adding work is true waste: the customer doesn’t value it and the business doesn’t have to do it to remain a viable enterprise. • Note: The goal of value stream transformation is to deliver greater value to one’s customers. • One means for achieving greater value is to eliminate non-value-adding work—or, in the case of necessary non-value-adding work, reduce it so that it consumes fewer resources. • Value stream mapping helps us identify how to achieve this goal. Key Metrics for Each Process Block
time (LT)— also referred to as throughput time, response time, and turnaround time—is the elapsed time from the moment work is made available to an individual, work team, or department until it has been completed and made available to the next person or team in the value stream. Lead time is often expressed in hours, days, or even weeks or months. For example, If incoming work sits in a department’s electronic queue for an average of six hours before anyone begins work on it, and then it takes a person an average of 30 minutes (process time) to complete the work, and then it’s held for an additional hour before it’s passed to the next function in the value stream, the lead time for that process block is 7.5 hours.
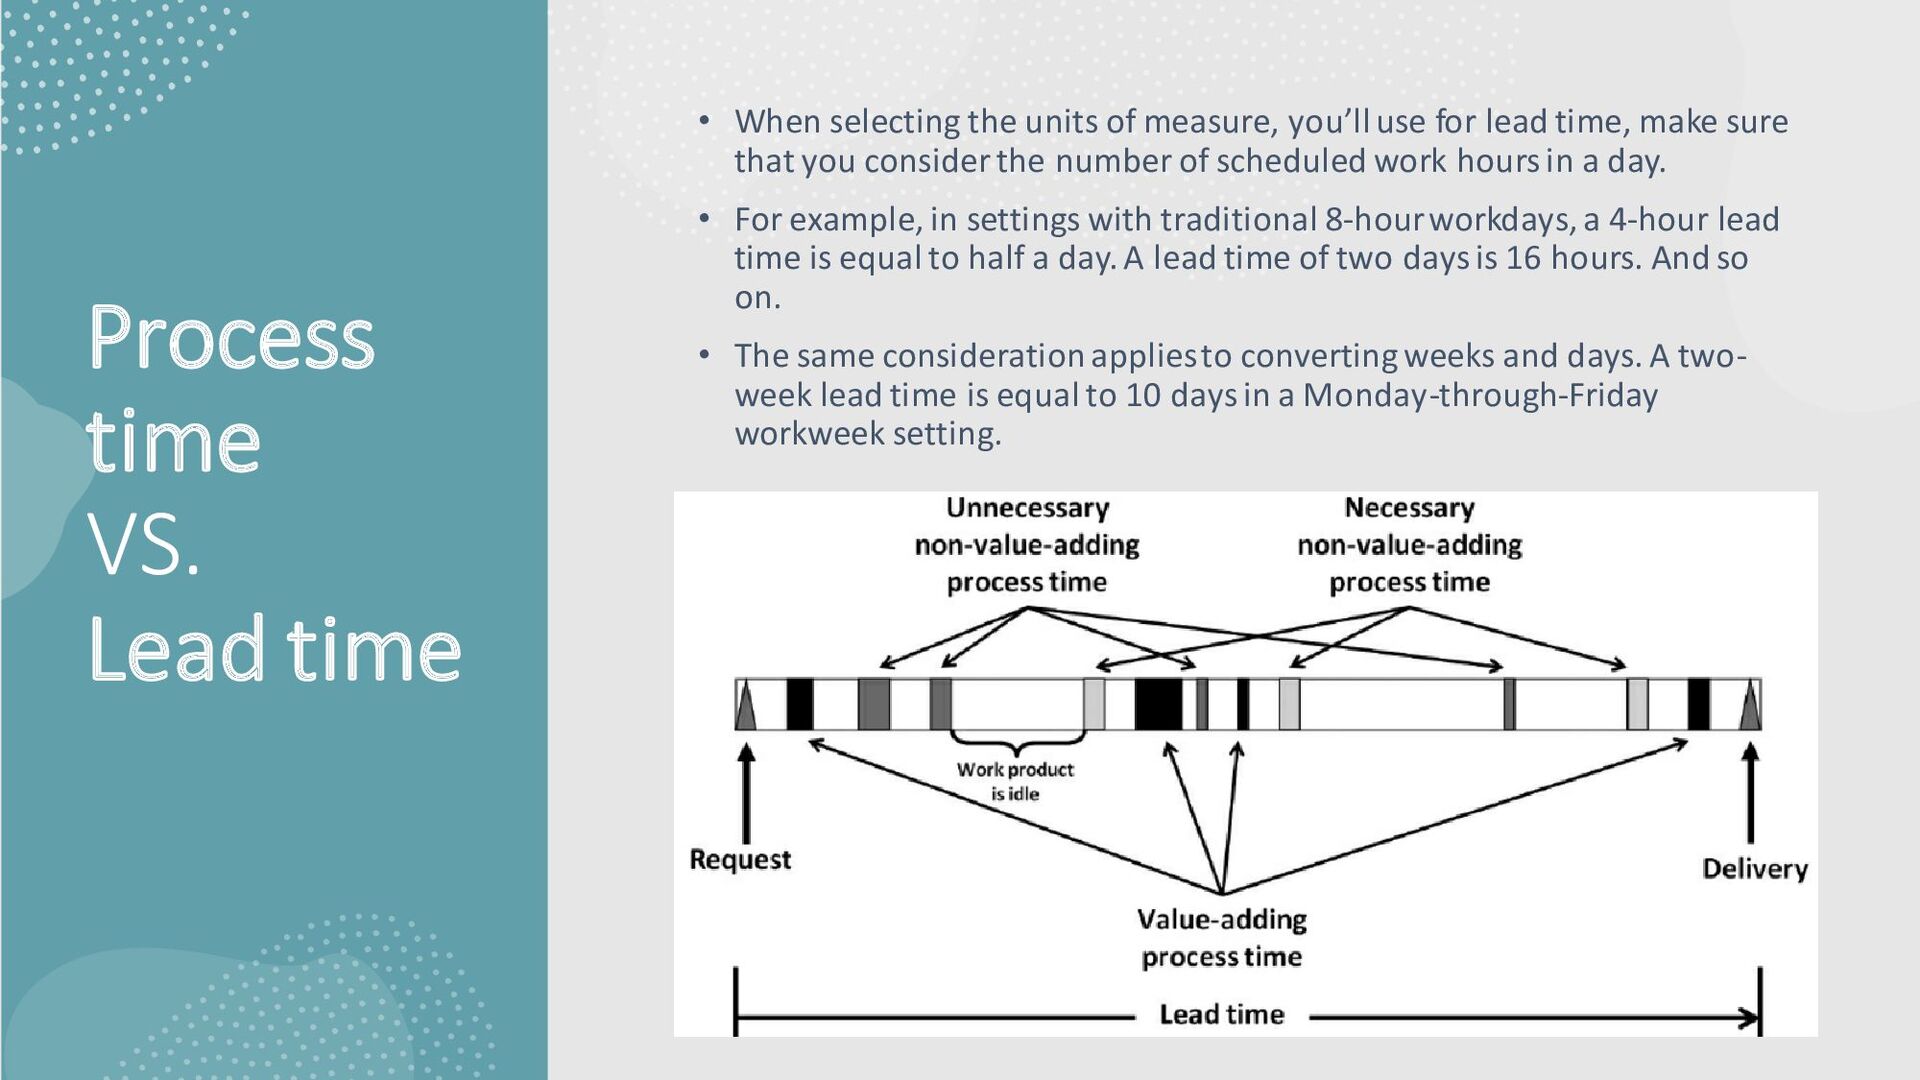
of measure, you’ll use for lead time, make sure that you consider the number of scheduled work hours in a day. • For example, in settings with traditional 8-hour workdays, a 4-hour lead time is equal to half a day. A lead time of two days is 16 hours. And so on. • The same consideration applies to converting weeks and days. A two- week lead time is equal to 10 days in a Monday-through-Friday workweek setting.
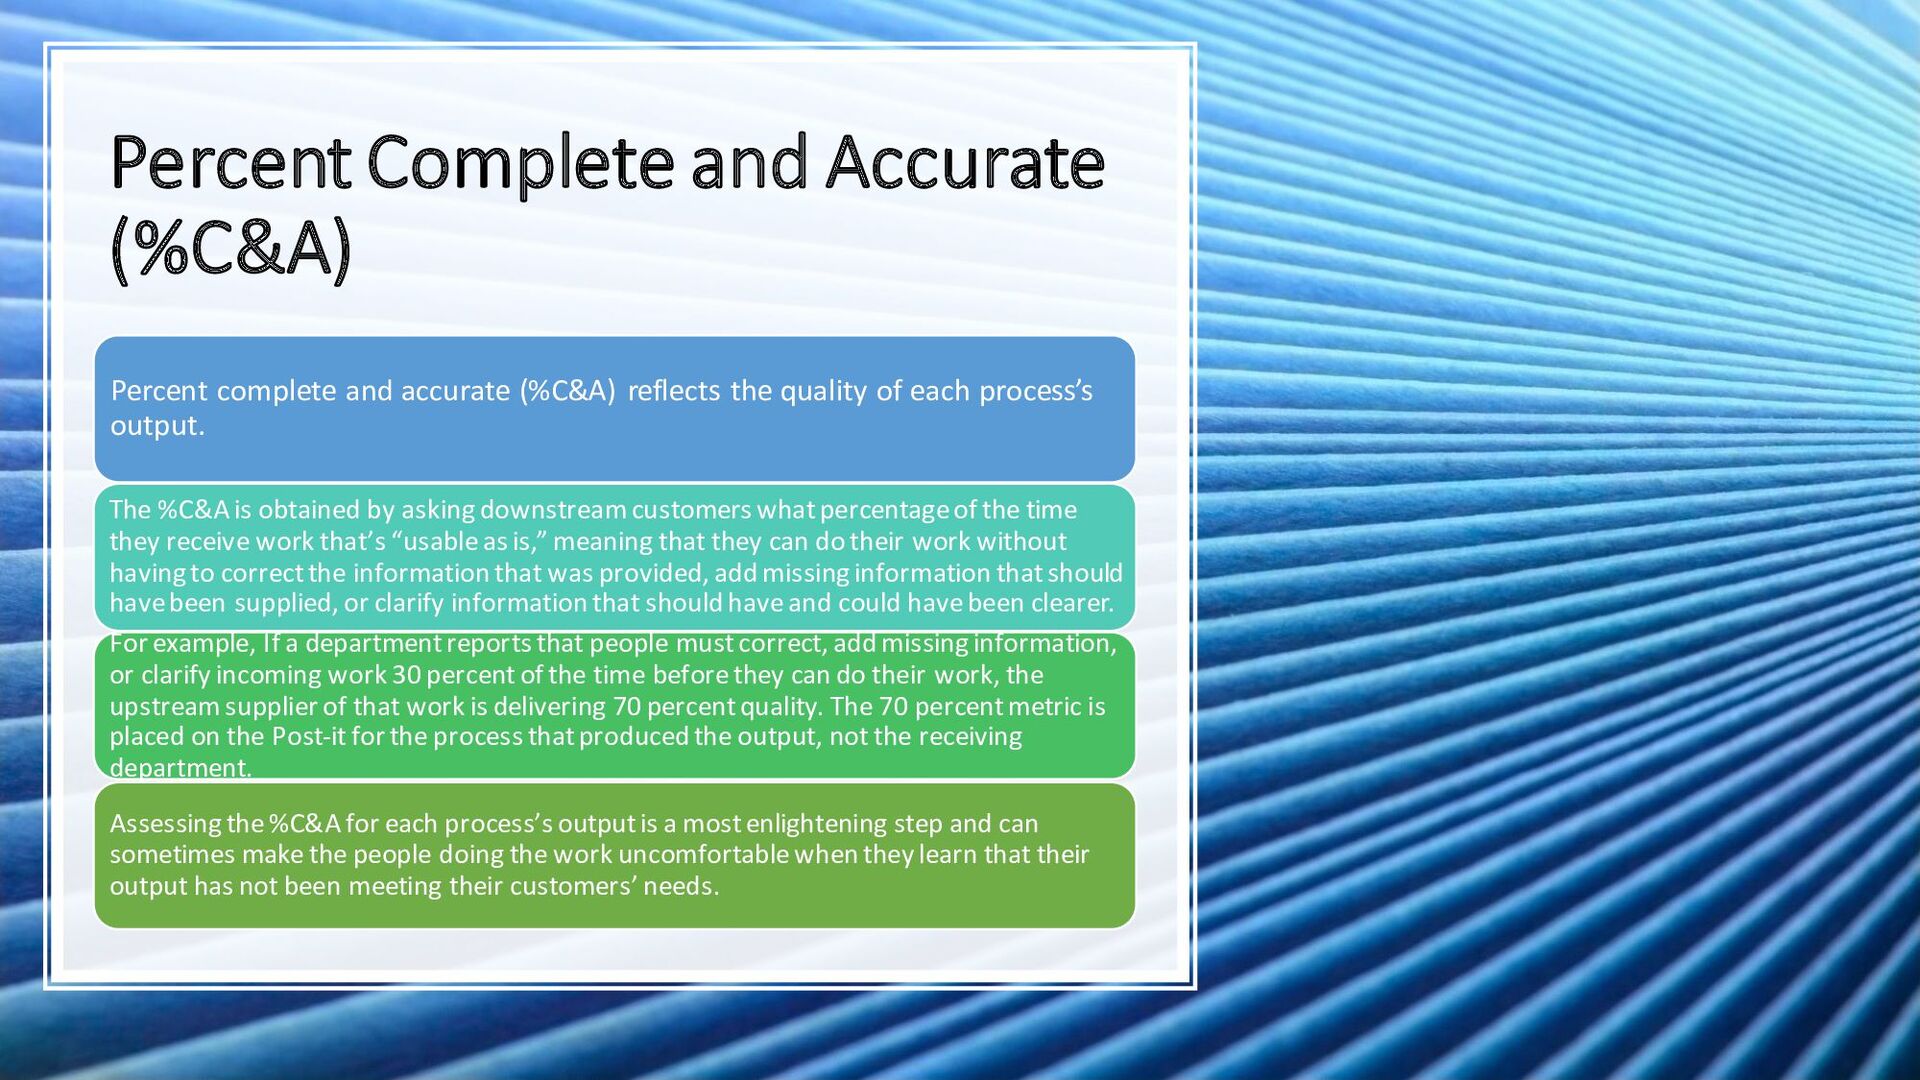
reflects the quality of each process’s output. The %C&A is obtained by asking downstream customers what percentage of the time they receive work that’s “usable as is,” meaning that they can do their work without having to correct the information that was provided, add missing information that should have been supplied, or clarify information that should have and could have been clearer. For example, If a department reports that people must correct, add missing information, or clarify incoming work 30 percent of the time before they can do their work, the upstream supplier of that work is delivering 70 percent quality. The 70 percent metric is placed on the Post-it for the process that produced the output, not the receiving department. Assessing the %C&A for each process’s output is a most enlightening step and can sometimes make the people doing the work uncomfortable when they learn that their output has not been meeting their customers’ needs.
you may be interviewing the people who do the work and/or reviewing performance reports to obtain the time and quality metrics. Thus, you need to also discover any additional barriers to flow that are significant and aren’t already reflected in the time and quality metrics. Barriers to flow are any actions or conditions that inhibits the uninterrupted progression of work. Excessive lead times due to the presence of waste are not in themselves barriers to flow—they are merely symptoms indicating that there are “flow stoppers” or barriers to flow. For example, you don’t need to note an additional barrier to flow for excessive lead times due to unneeded handoffs—these barriers are visually apparent on the map. Similar thinking applies to rework. While it’s an obvious barrier to flow, because it’s a natural by-product of low %C&A, it doesn’t need to be spelled out. On the other hand, the following barriers to flow are common, often create significant flow issues, and aren’t obvious from the process time, lead time, and %C&A metrics.
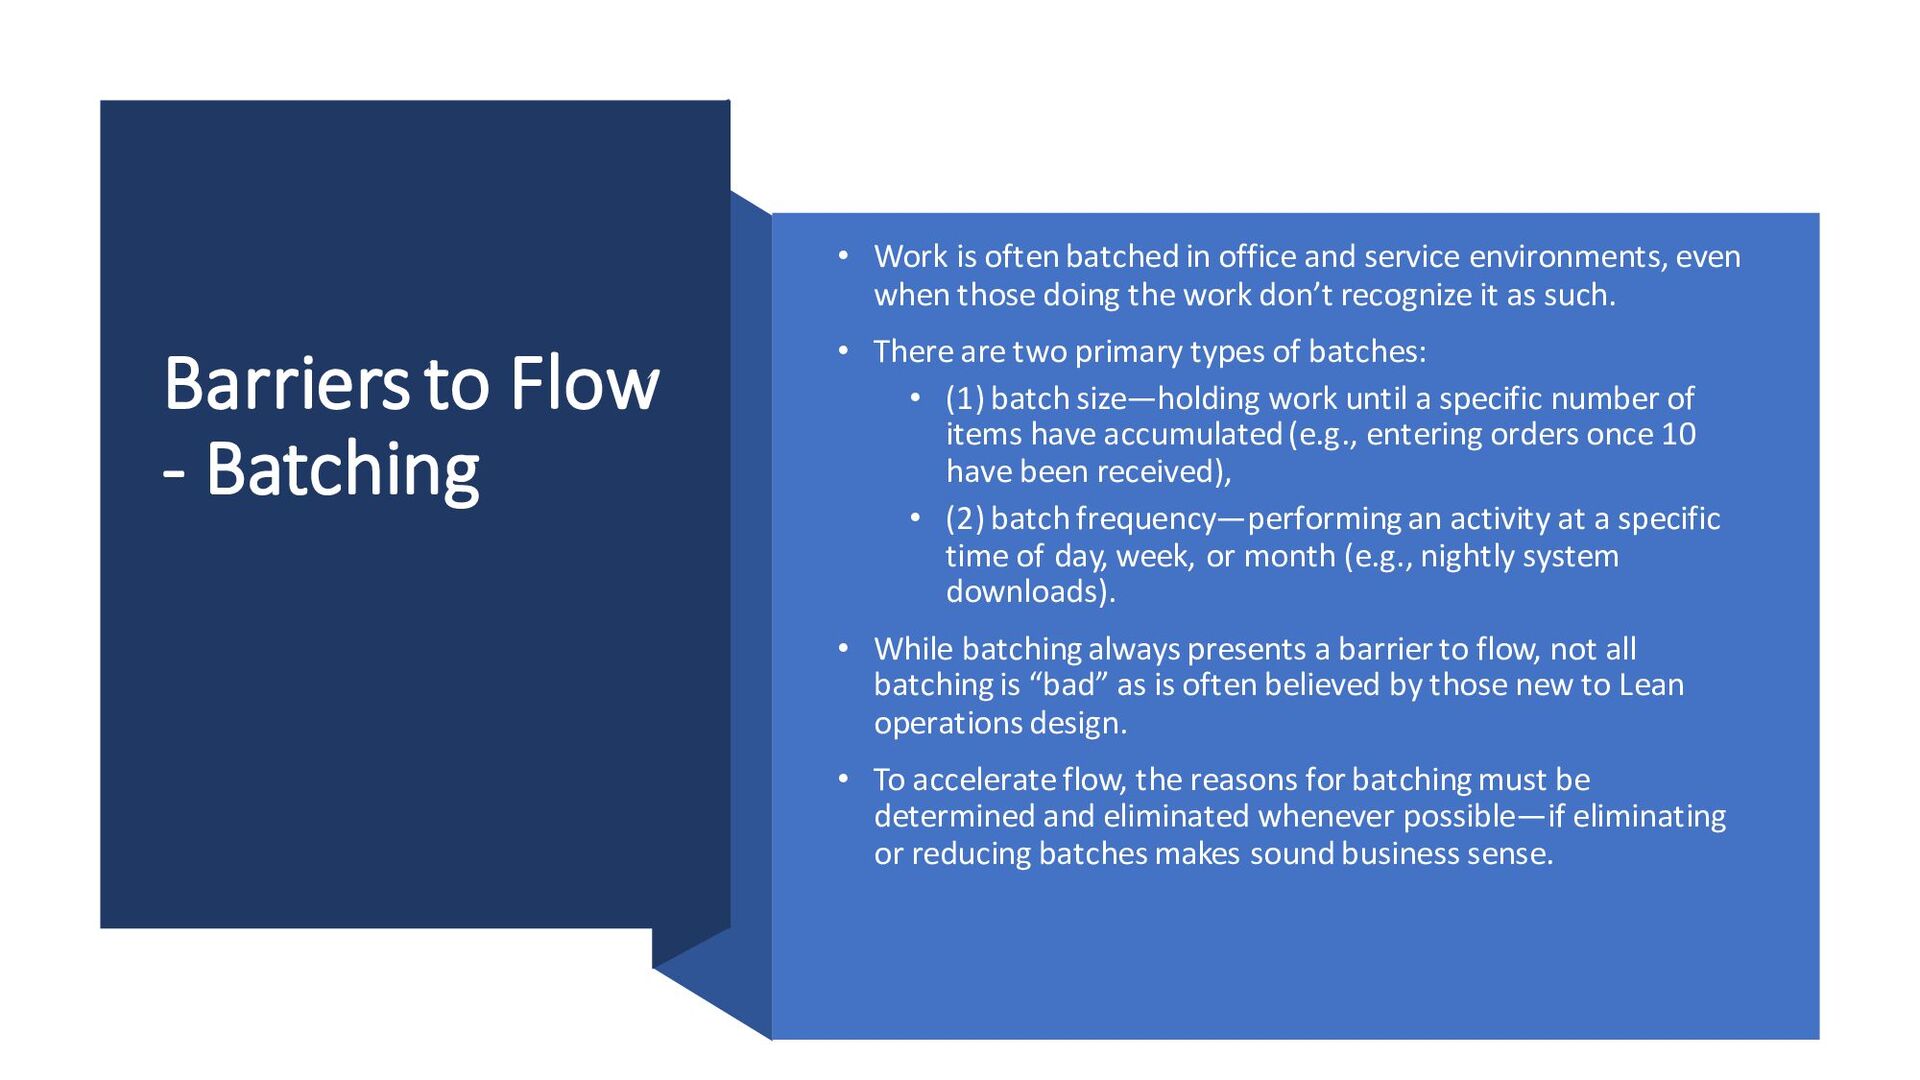
in office and service environments, even when those doing the work don’t recognize it as such. • There are two primary types of batches: • (1) batch size—holding work until a specific number of items have accumulated (e.g., entering orders once 10 have been received), • (2) batch frequency—performing an activity at a specific time of day, week, or month (e.g., nightly system downloads). • While batching always presents a barrier to flow, not all batching is “bad” as is often believed by those new to Lean operations design. • To accelerate flow, the reasons for batching must be determined and eliminated whenever possible—if eliminating or reducing batches makes sound business sense.
some environments, excessive system downtime and/or slow responsiveness present a significant barrier to flow and should be noted. Shared Resources or Inaccessible Staff If those responsible for performing the work have multiple obligations and priorities that make them unavailable to do the work as soon as it arrives, this may present a significant barrier to flow. If staff is unavailable or inaccessible for other reasons (e.g., significant travel, medical leave), this, too, should be noted. When relevant, it’s helpful to show the percentage of time staff is typically available to perform the process when the work arrives.
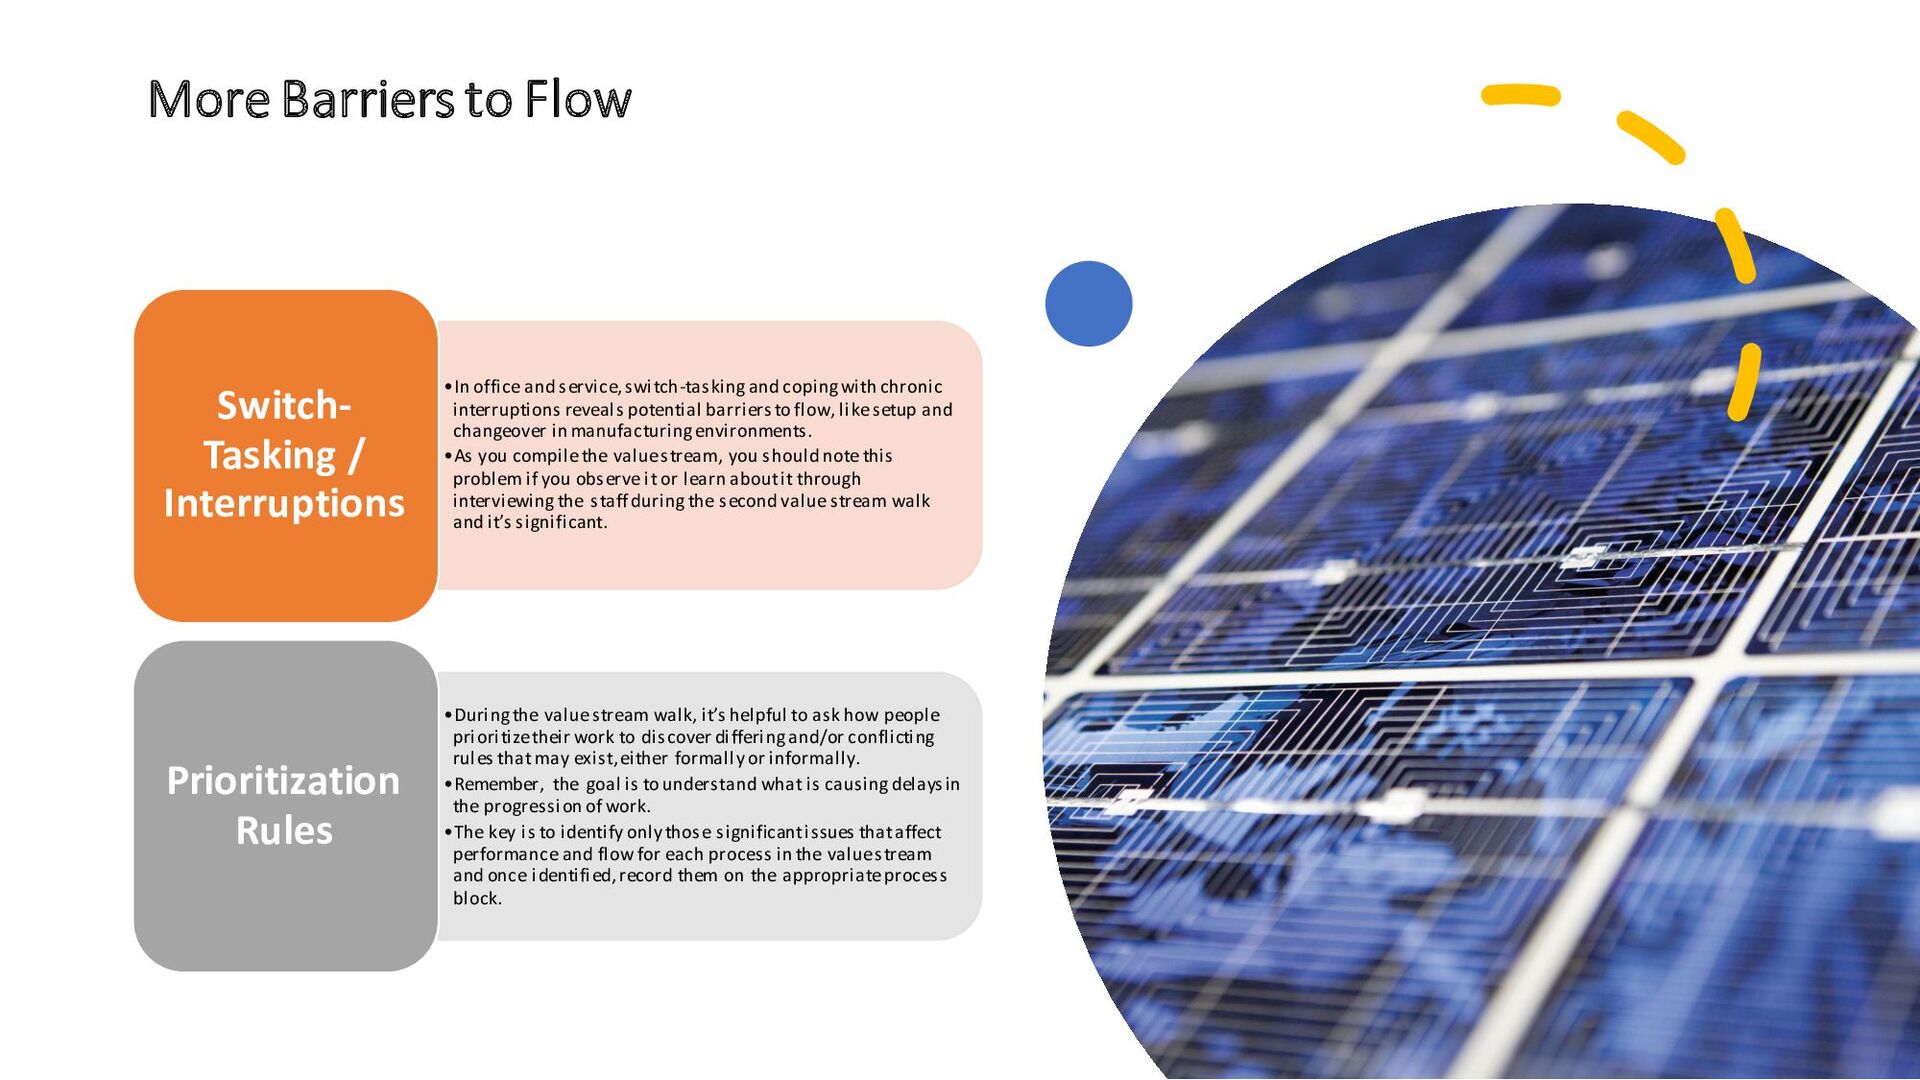
coping with chronic interruptions reveals potential barriers to flow, like setup and changeover in manufacturing environments. •As you compile the value stream, you should note this problem if you observe it or learn about it through interviewing the staff during the second value stream walk and it’s significant. Switch- Tasking / Interruptions •During the value stream walk, it’s helpful to ask how people prioritize their work to discover differing and/or conflicting rules that may exist, either formally or informally. •Remember, the goal is to understand what is causing delays in the progression of work. •The key is to identify only those significant issues that affect performance and flow for each process in the value stream and once identified, record them on the appropriate process block. Prioritization Rules
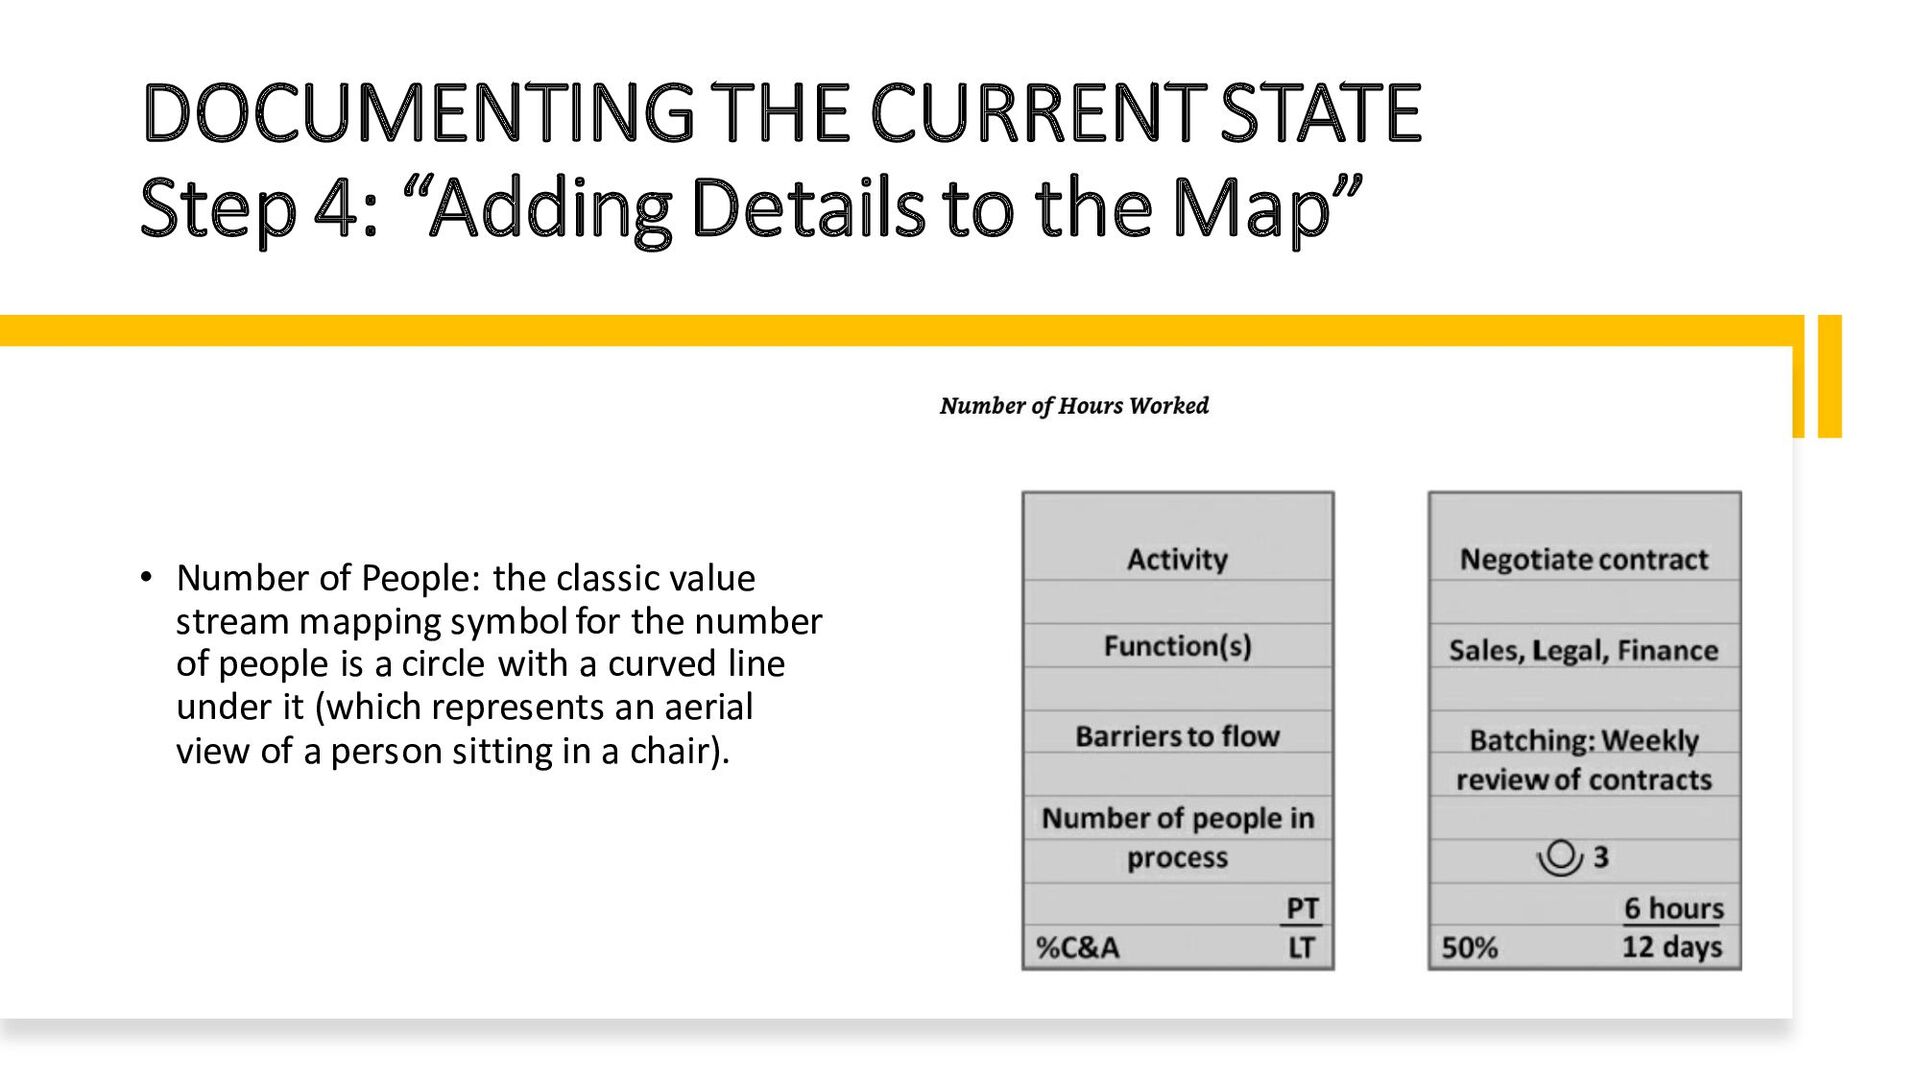
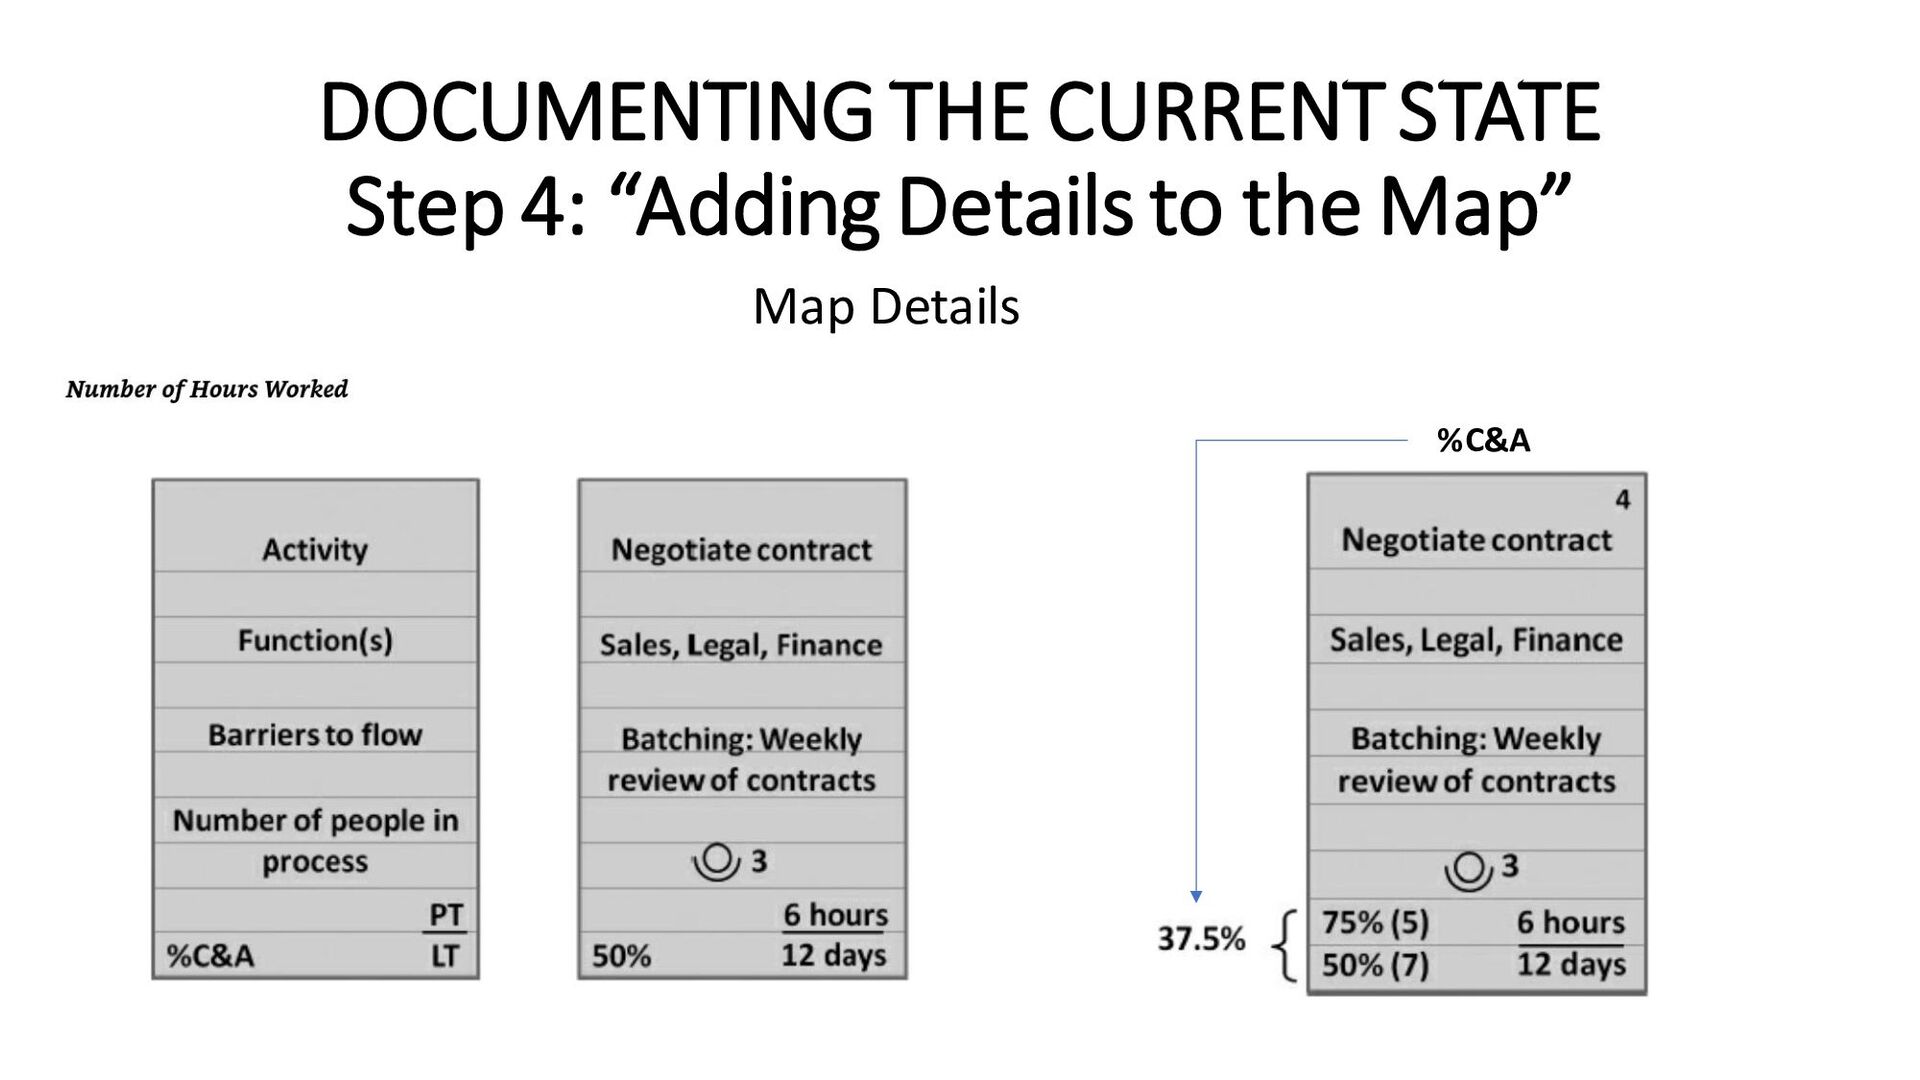
Map” • Number of People: the classic value stream mapping symbol for the number of people is a circle with a curved line under it (which represents an aerial view of a person sitting in a chair).
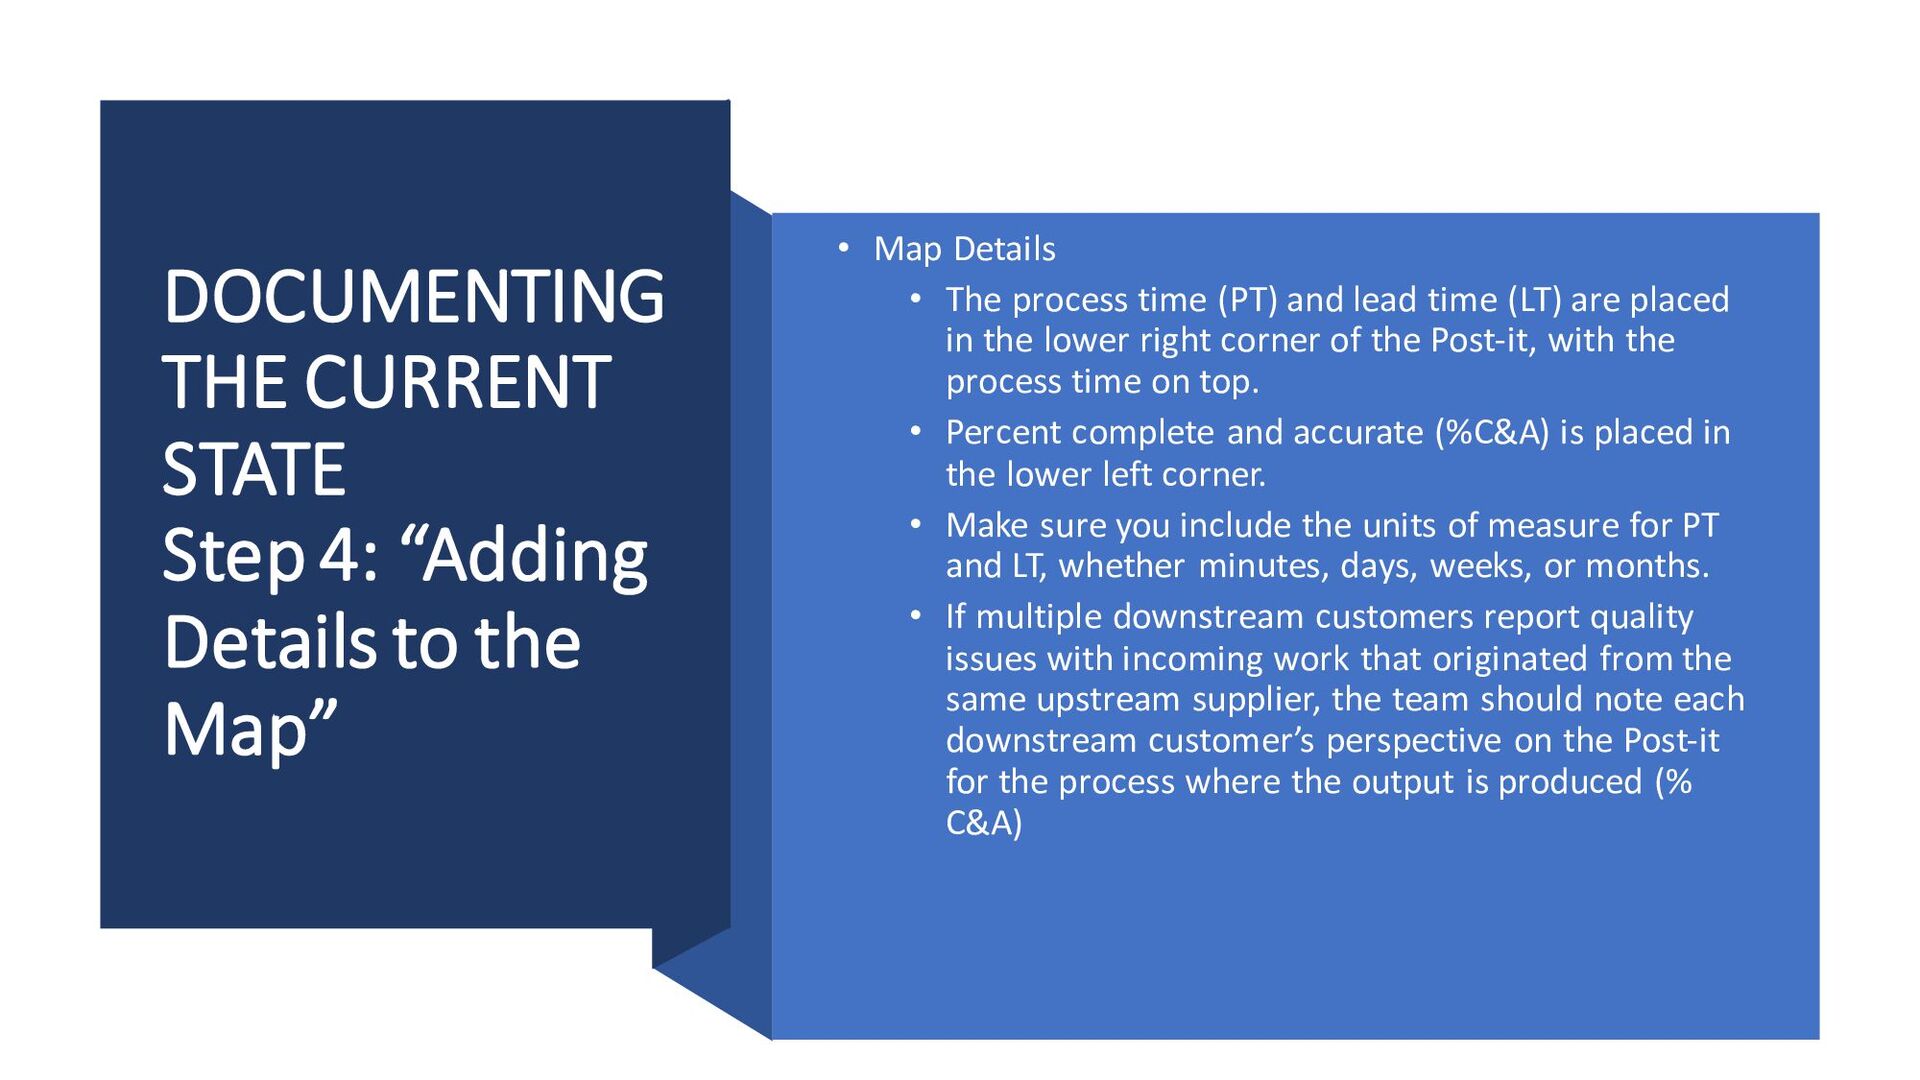
Map” • Map Details • The process time (PT) and lead time (LT) are placed in the lower right corner of the Post-it, with the process time on top. • Percent complete and accurate (%C&A) is placed in the lower left corner. • Make sure you include the units of measure for PT and LT, whether minutes, days, weeks, or months. • If multiple downstream customers report quality issues with incoming work that originated from the same upstream supplier, the team should note each downstream customer’s perspective on the Post-it for the process where the output is produced (% C&A)
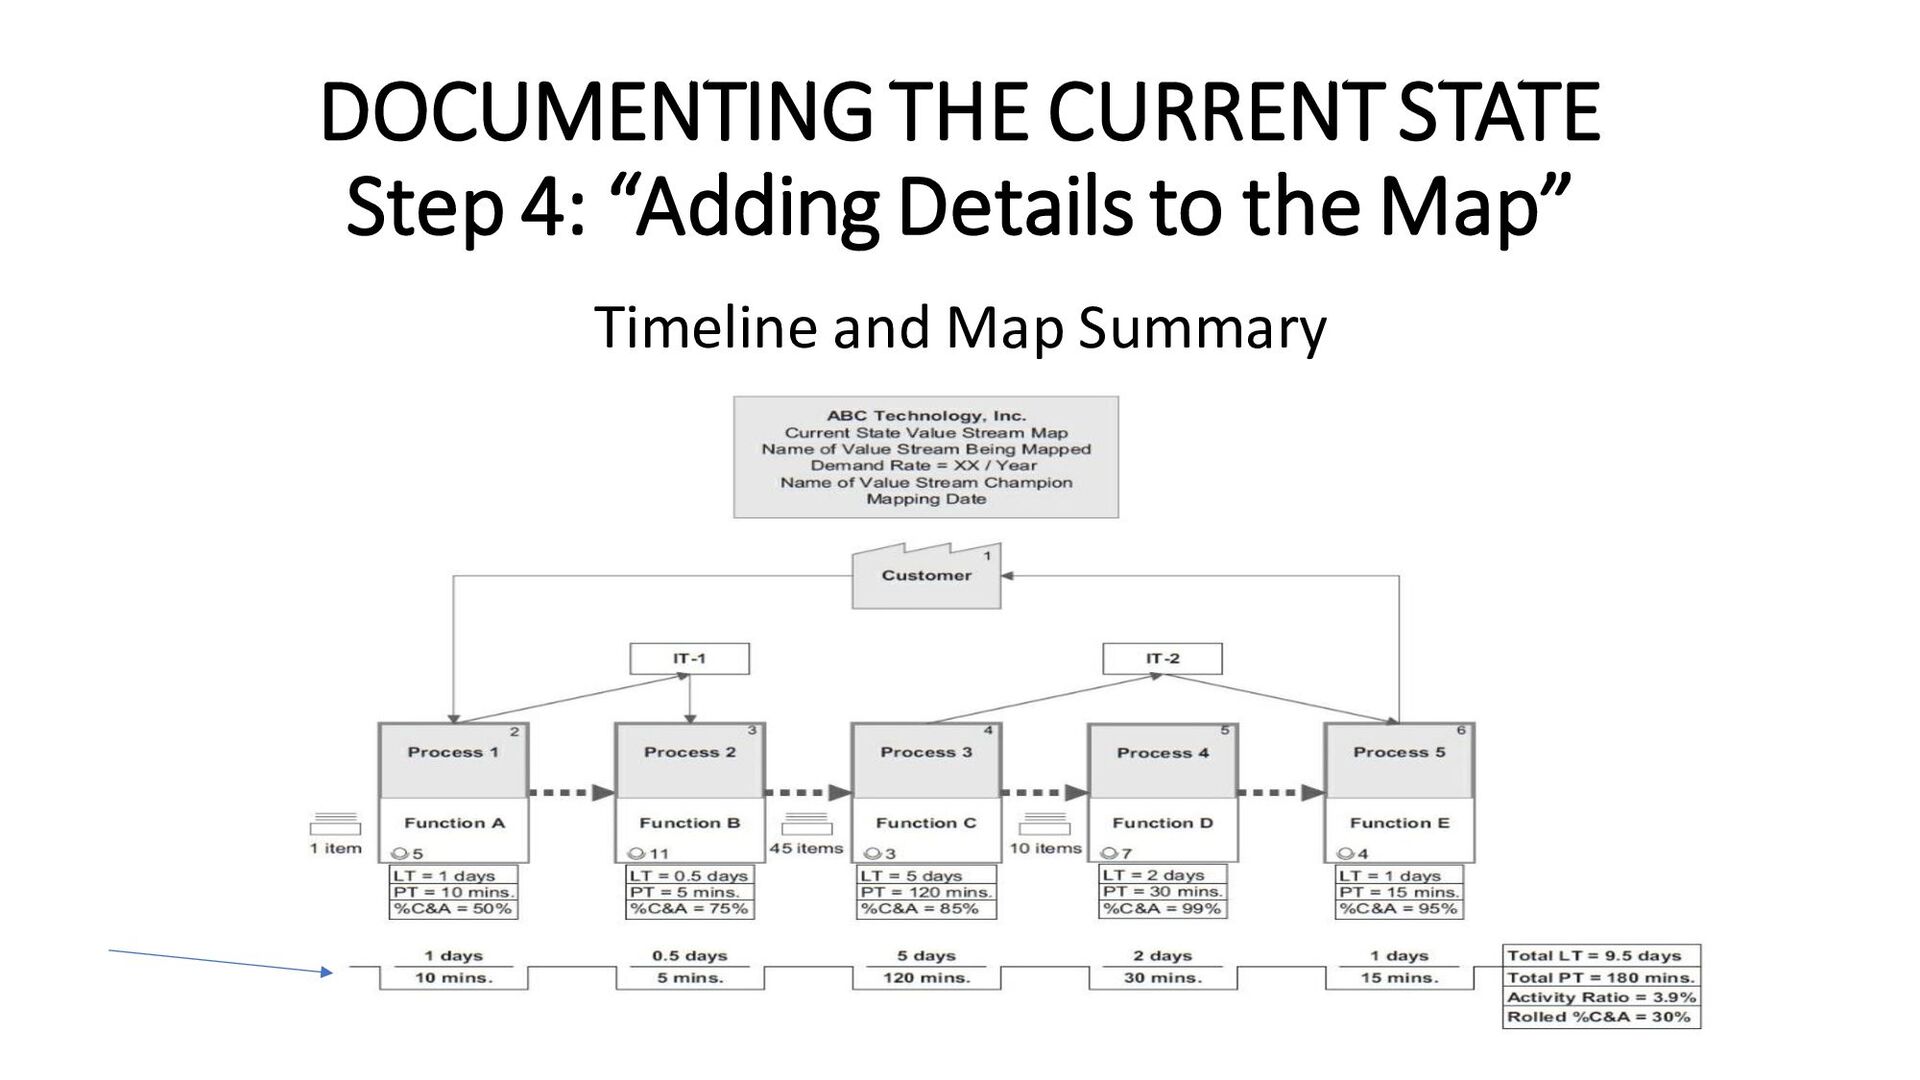
Map” Timeline and Map Summary • The next step in creating a current state value stream map is creating the timeline that demonstrates the degree of flow present, the speed at which your organization delivers goods or services to the customer, and the amount of work effort involved across the value stream. • The timeline falls directly below the Post-its. • With parallel processes, the process times and lead times for only one of the Post-its—or series of Post-its—is brought down to the timeline. • On maps with only one parallel process block before the work reconverges with the main value stream, you select the lead time and process time from the parallel process Post-it that has the longest lead time and place those values on the timeline.
Map” Timeline and Map Summary On maps with parallel paths that have more than one consecutive process block, calculate and compare the total lead time for each path. The parallel path with the longest total lead time is the timeline critical path. The lead times and process times from the process blocks on the timeline critical path are carried down to the summary timeline.
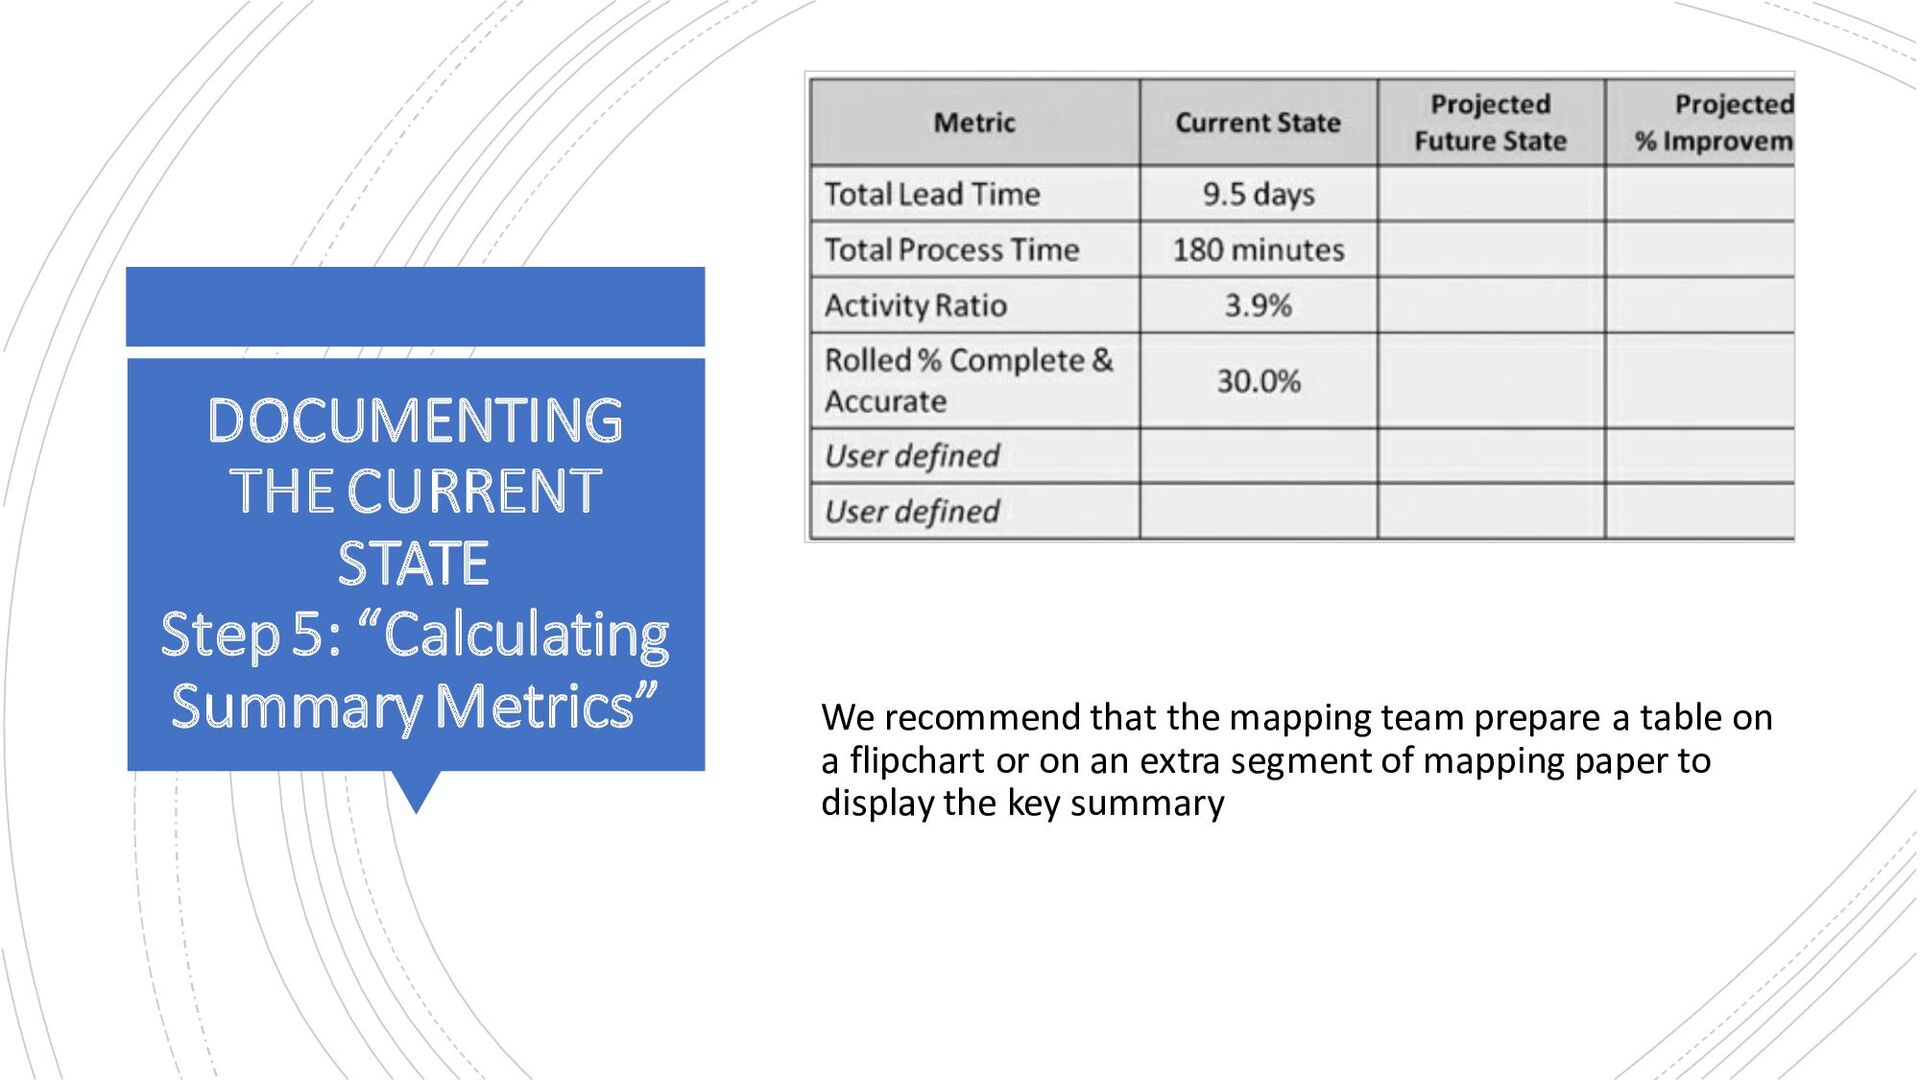
The team will summarize the metrics across the full value stream. We recommend, at a minimum, the first four of the following summary metrics: • Total Lead Time (Total LT) This value reflects the total time it takes to deliver on a customer request. Remember that, when parallel processes (concurrent work activities) exist, the total lead time includes the longest lead time of the various parallel processes that form the timeline critical path of the value stream. • Total Process Time (Total PT) This value reflects the total work effort required by all functions on the timeline critical path of the value stream.
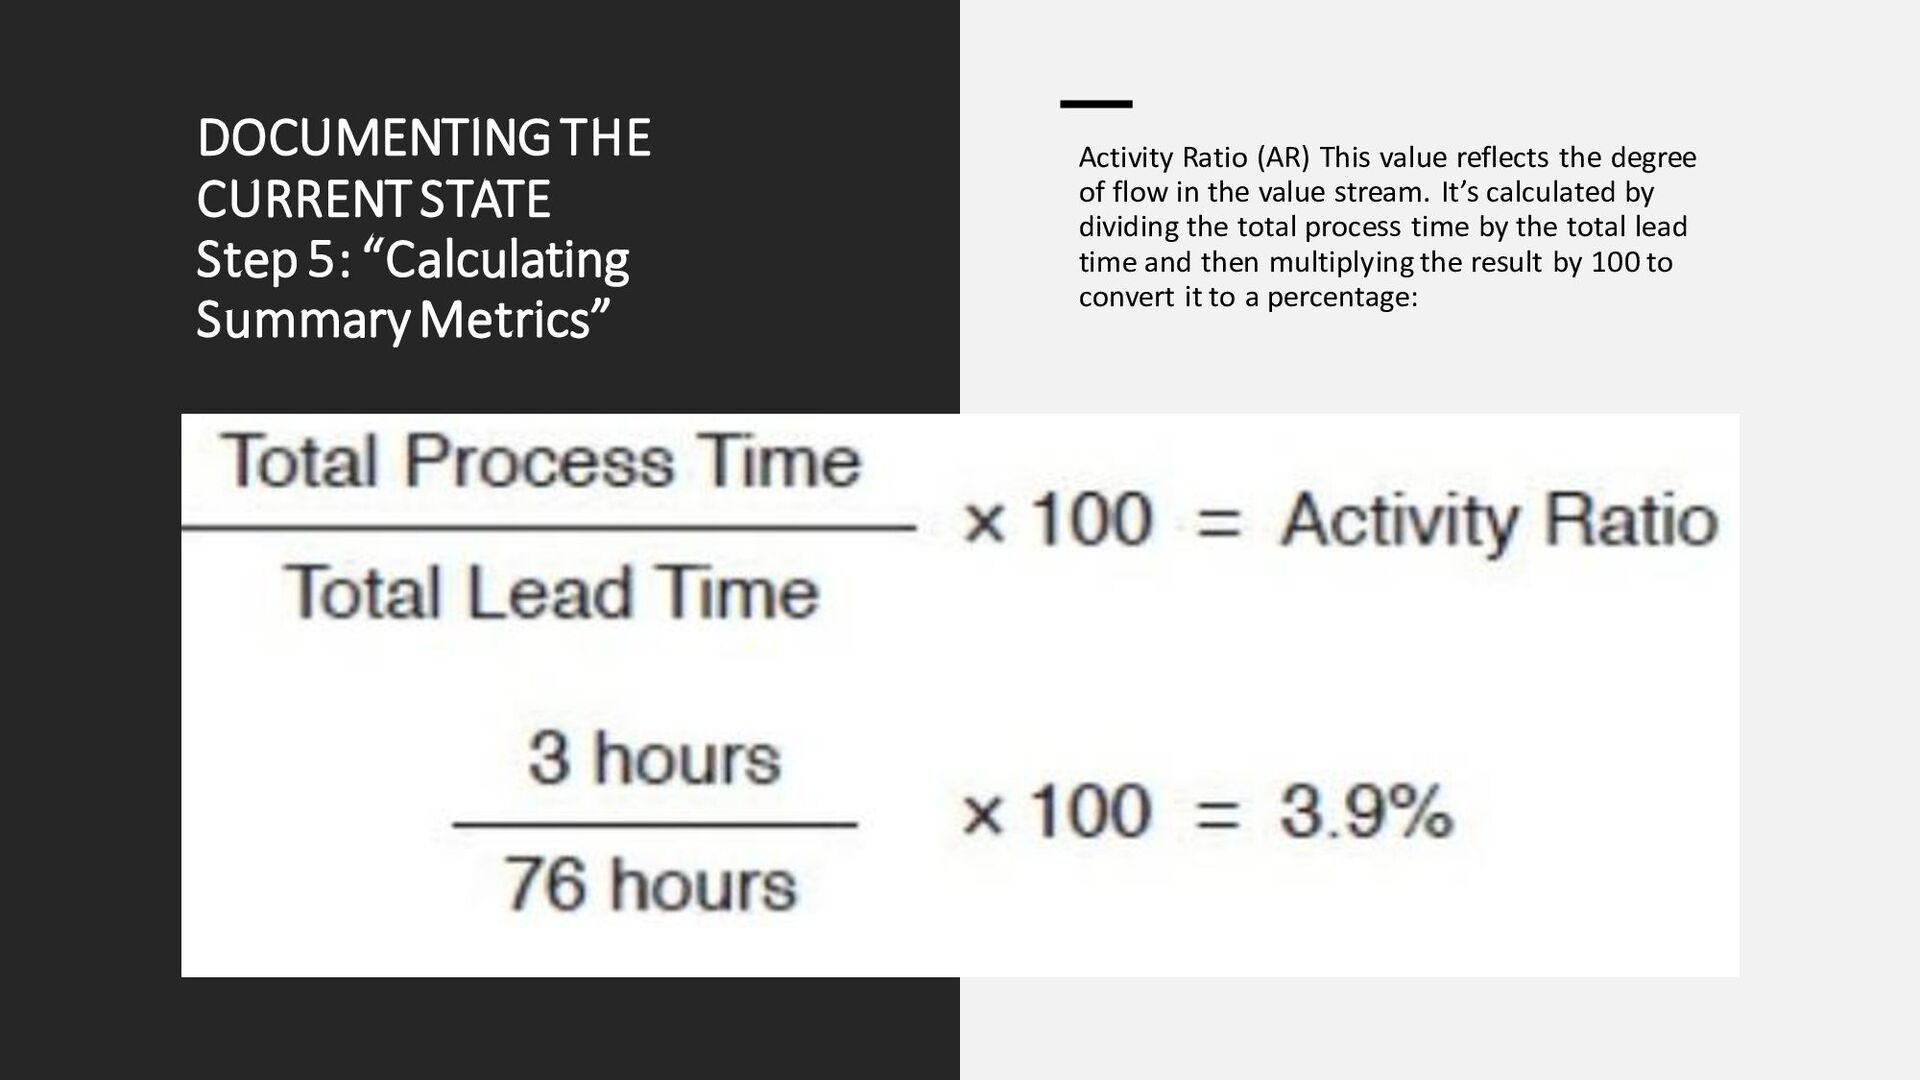
Ratio (AR) This value reflects the degree of flow in the value stream. It’s calculated by dividing the total process time by the total lead time and then multiplying the result by 100 to convert it to a percentage:
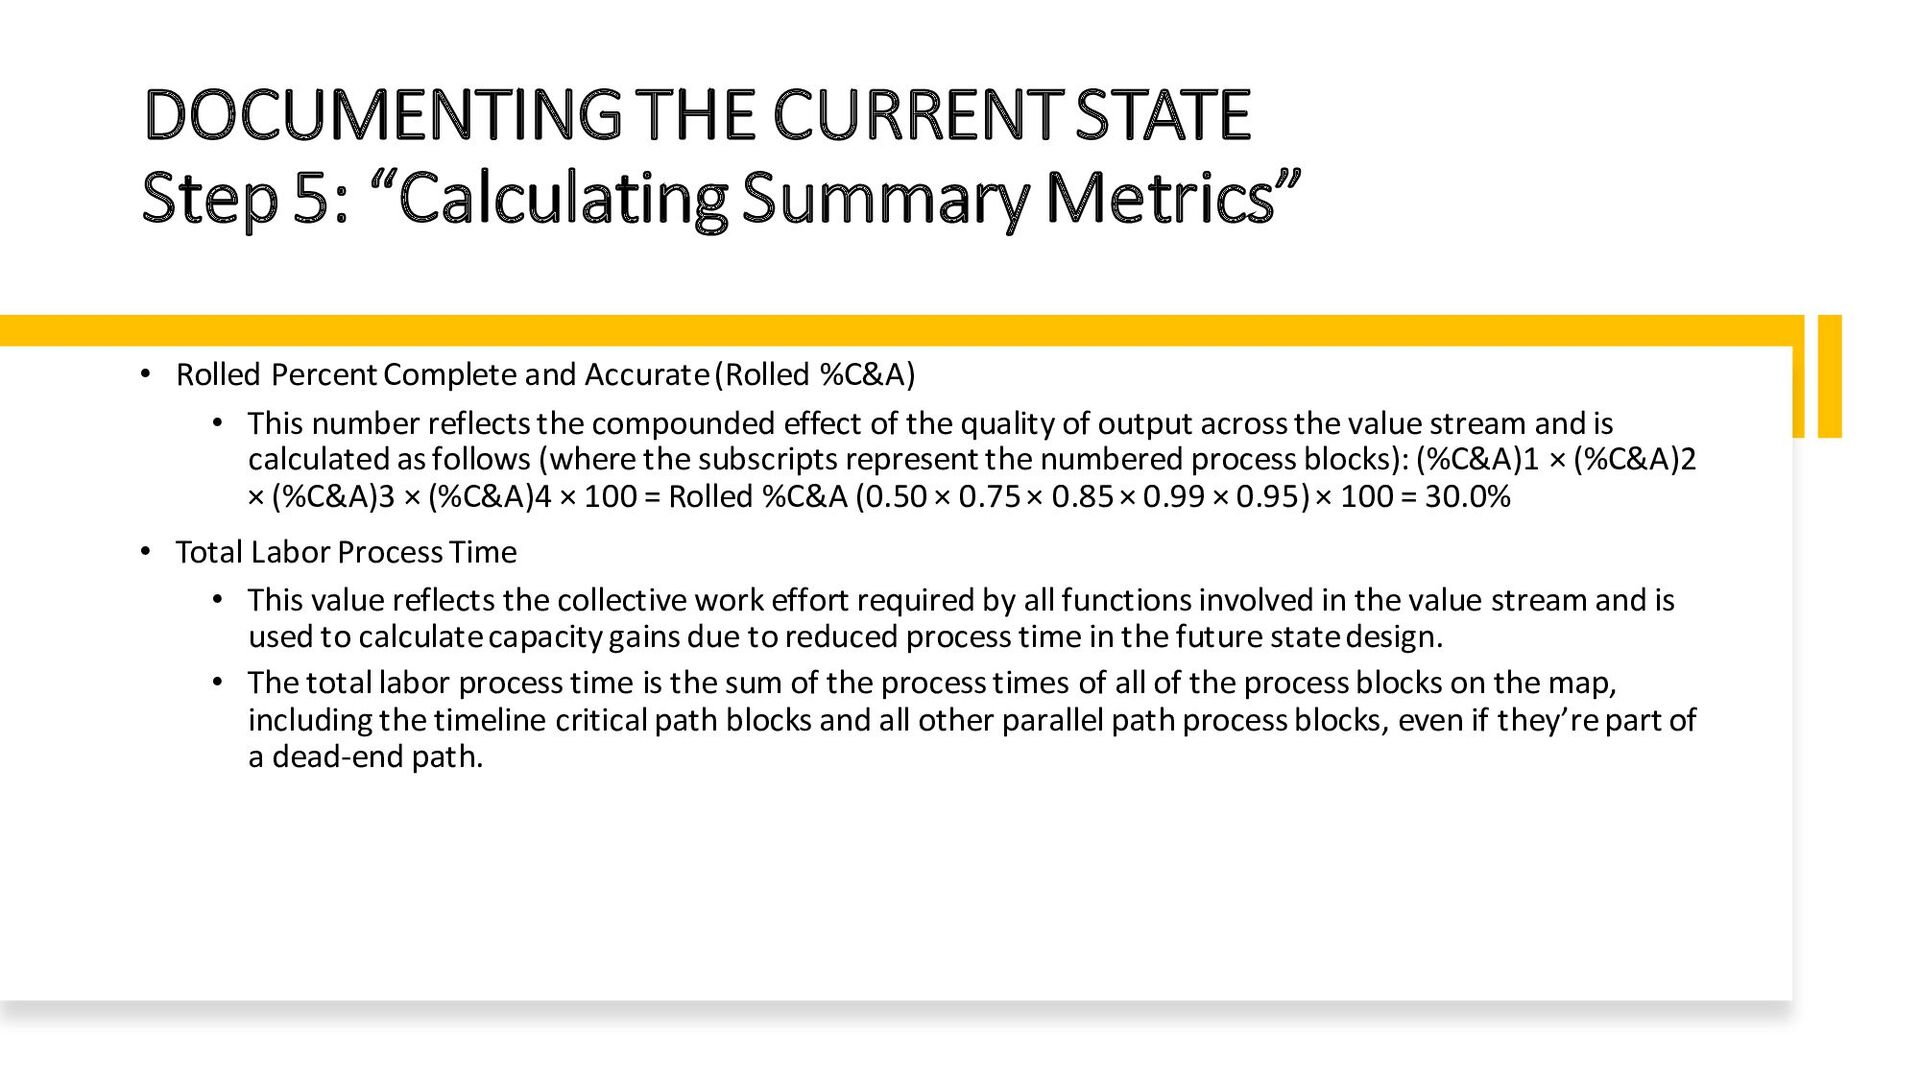
Rolled Percent Complete and Accurate (Rolled %C&A) • This number reflects the compounded effect of the quality of output across the value stream and is calculated as follows (where the subscripts represent the numbered process blocks): (%C&A)1 × (%C&A)2 × (%C&A)3 × (%C&A)4 × 100 = Rolled %C&A (0.50 × 0.75 × 0.85 × 0.99 × 0.95) × 100 = 30.0% • Total Labor Process Time • This value reflects the collective work effort required by all functions involved in the value stream and is used to calculate capacity gains due to reduced process time in the future state design. • The total labor process time is the sum of the process times of all of the process blocks on the map, including the timeline critical path blocks and all other parallel path process blocks, even if they’re part of a dead-end path.
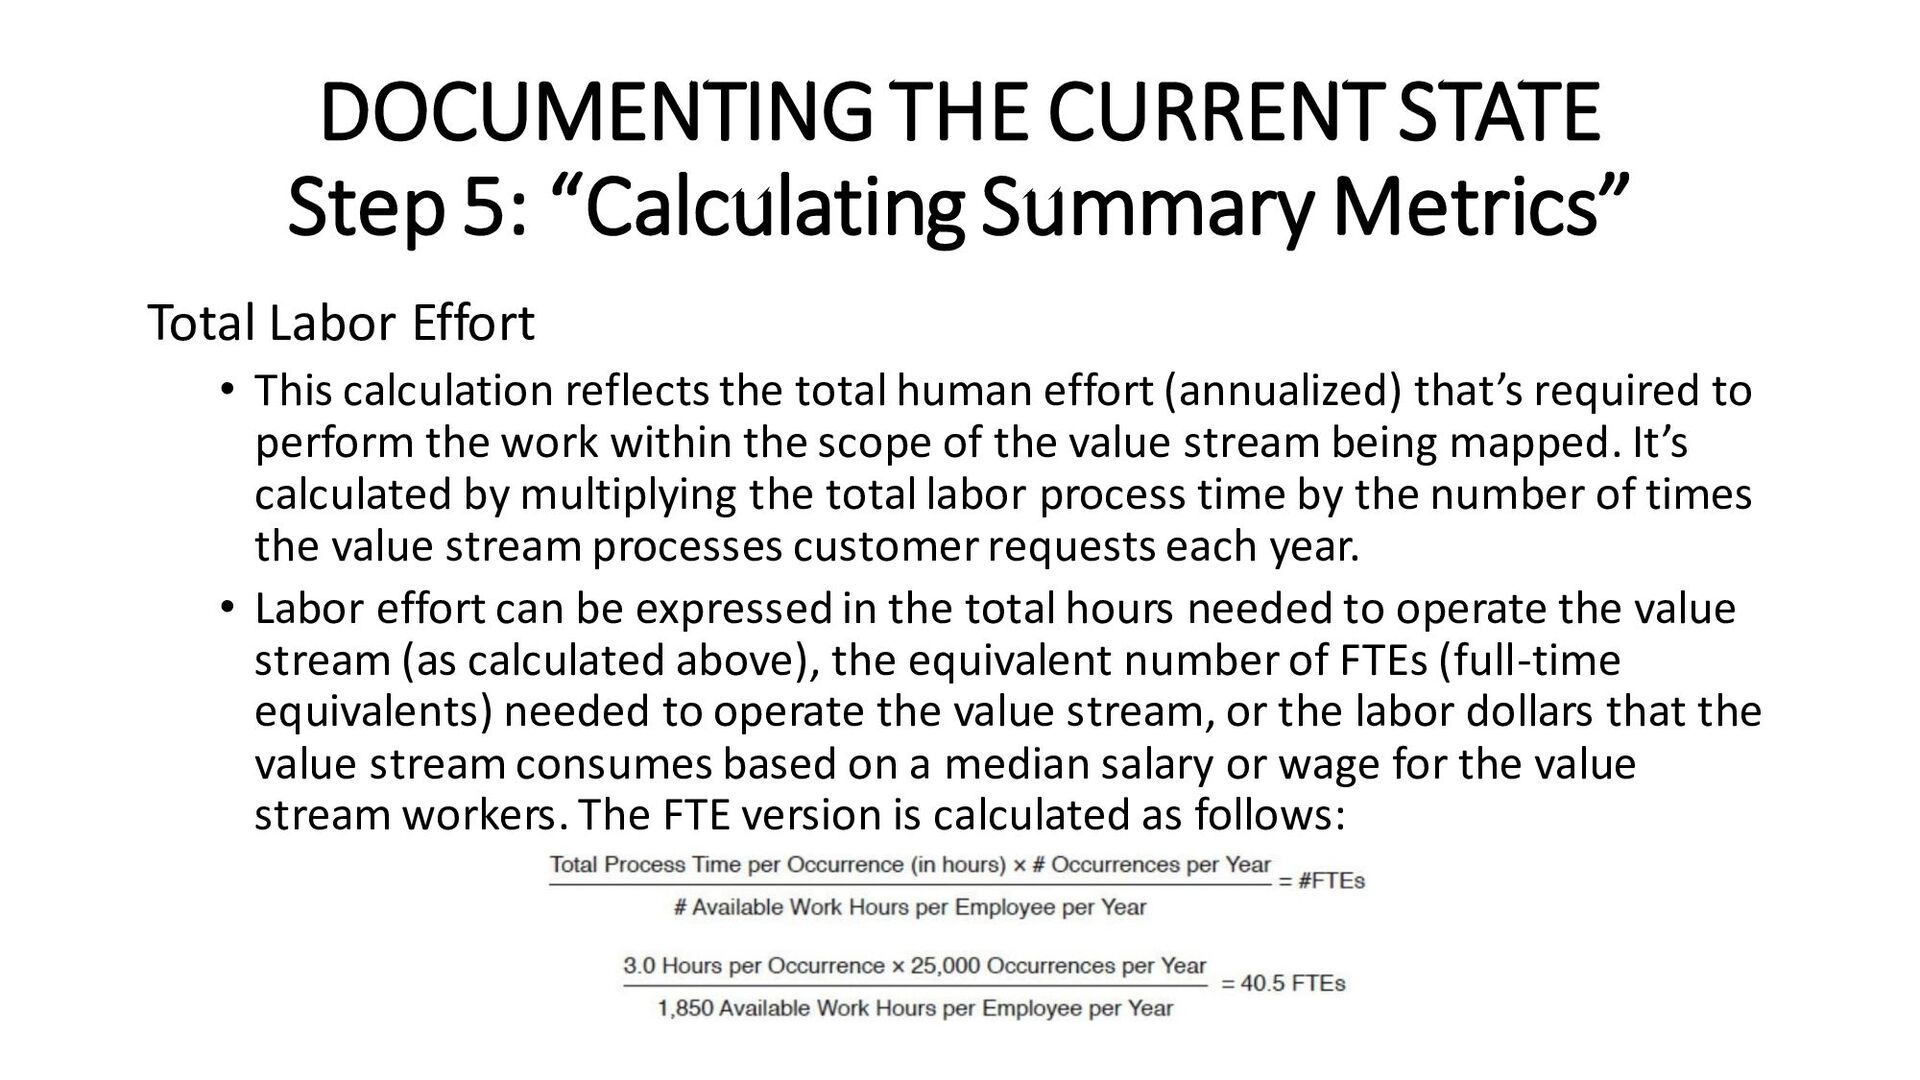
Labor Effort • This calculation reflects the total human effort (annualized) that’s required to perform the work within the scope of the value stream being mapped. It’s calculated by multiplying the total labor process time by the number of times the value stream processes customer requests each year. • Labor effort can be expressed in the total hours needed to operate the value stream (as calculated above), the equivalent number of FTEs (full-time equivalents) needed to operate the value stream, or the labor dollars that the value stream consumes based on a median salary or wage for the value stream workers. The FTE version is calculated as follows: