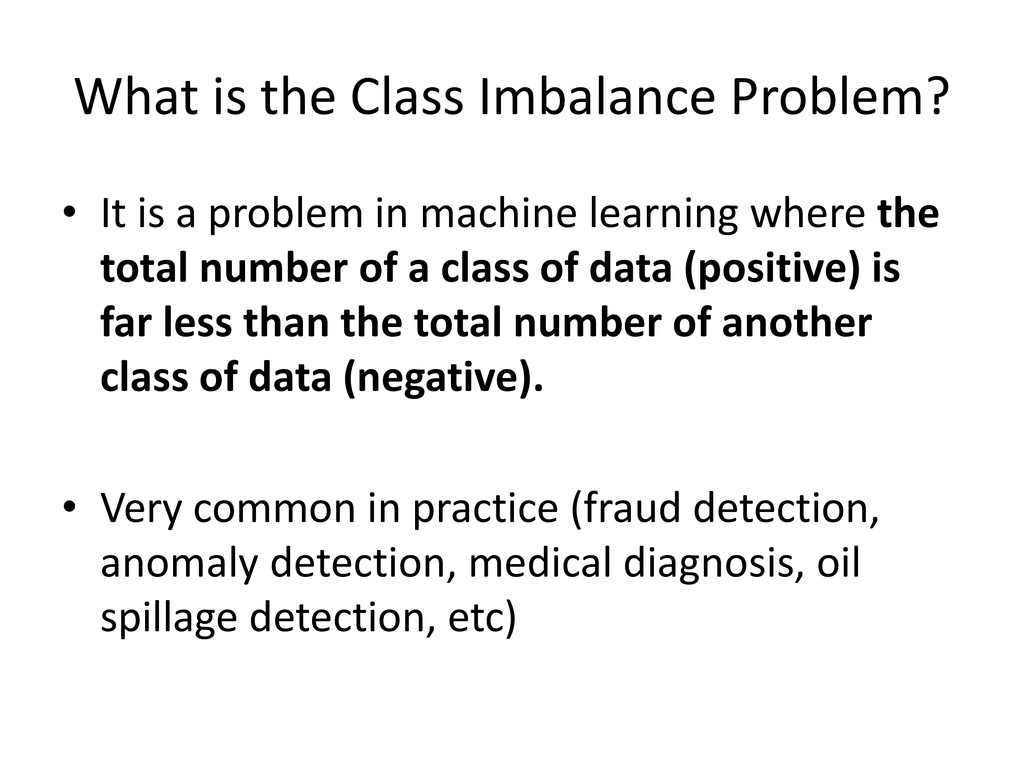
problem in machine learning where the total number of a class of data (positive) is far less than the total number of another class of data (negative). • Very common in practice (fraud detection, anomaly detection, medical diagnosis, oil spillage detection, etc)
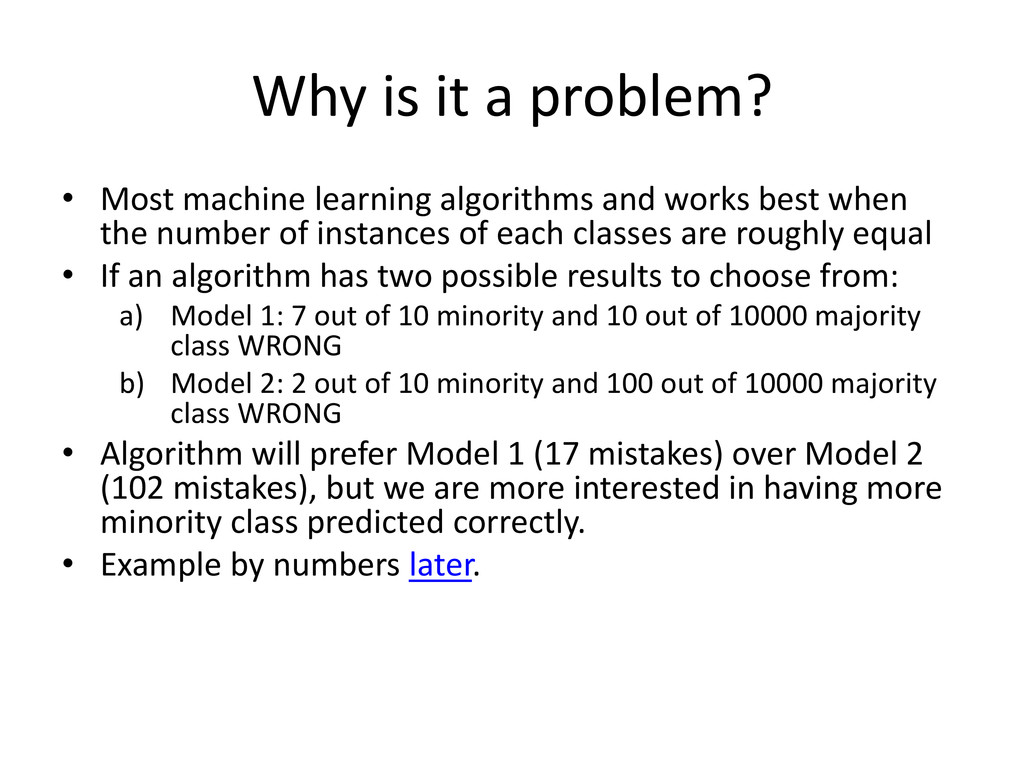
and works best when the number of instances of each classes are roughly equal • If an algorithm has two possible results to choose from: a) Model 1: 7 out of 10 minority and 10 out of 10000 majority class WRONG b) Model 2: 2 out of 10 minority and 100 out of 10000 majority class WRONG • Algorithm will prefer Model 1 (17 mistakes) over Model 2 (102 mistakes), but we are more interested in having more minority class predicted correctly. • Example by numbers later.
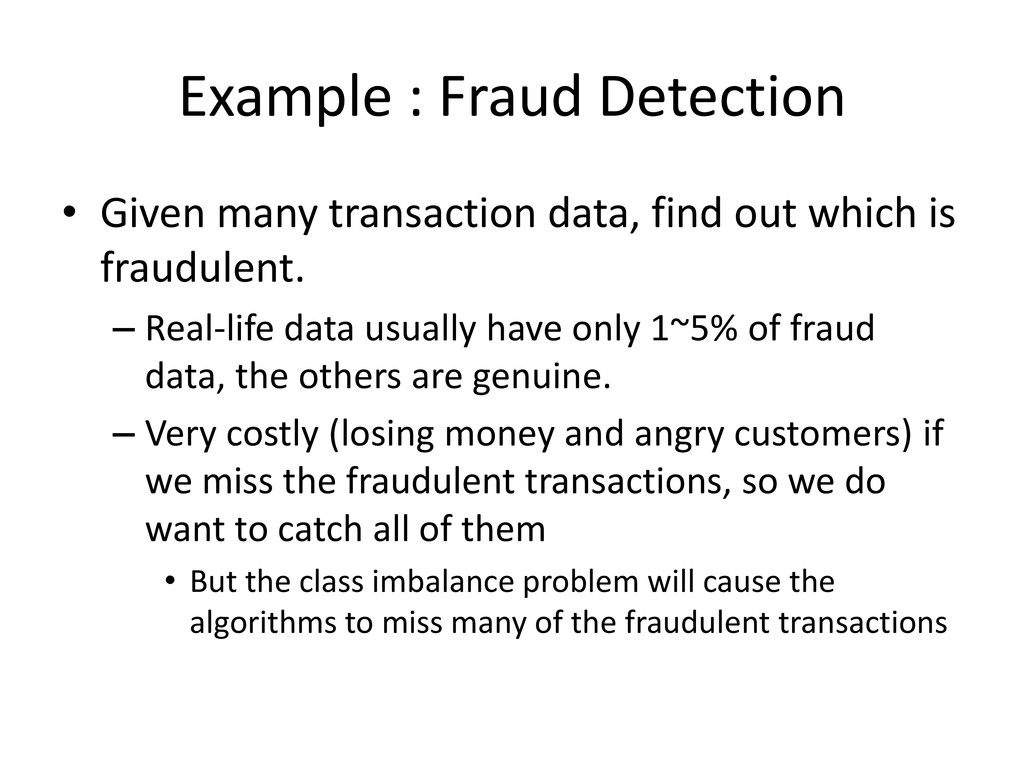
out which is fraudulent. – Real-life data usually have only 1~5% of fraud data, the others are genuine. – Very costly (losing money and angry customers) if we miss the fraudulent transactions, so we do want to catch all of them • But the class imbalance problem will cause the algorithms to miss many of the fraudulent transactions
we need to know how to compare two models. • From the numbers example earlier, we know that conventional error rate are not helpful here. • We need better metrics.
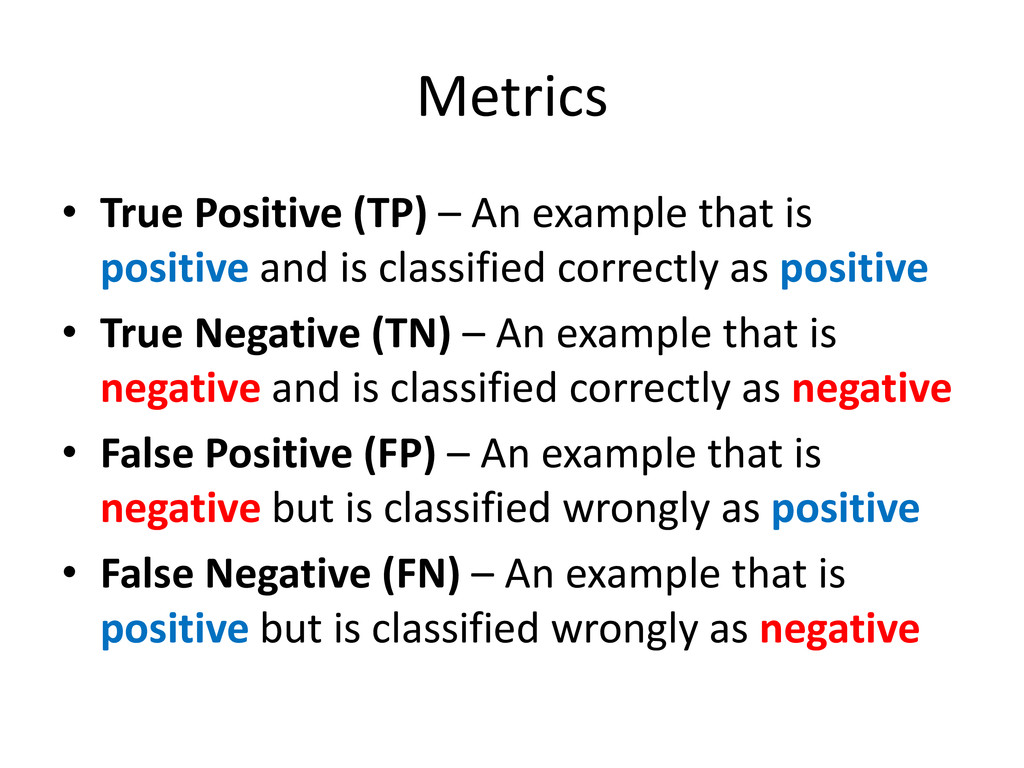
positive and is classified correctly as positive • True Negative (TN) – An example that is negative and is classified correctly as negative • False Positive (FP) – An example that is negative but is classified wrongly as positive • False Negative (FN) – An example that is positive but is classified wrongly as negative
Model 1 Predicted Class + - Actual Class + 3 (TP) 7 (FN) - 10 (FP) 9990 (TN) Error(Model 1) = (FN + FP) / total dataset size = (7 + 10) / 10010 = 0.0017 = (0.1% error) Model 2 Predicted Class + - Actual Class + 8 (TP) 2 (FN) - 100 (FP) 9900 (TN) Error(Model 2) = (FN + FP) / total dataset size = (2 + 100) / 10010 = 0.01 (= 1% error) Model 1 looks like a better model. But we actually want model 2, because we want to maximize TP as much as possible, and not maximize TN.
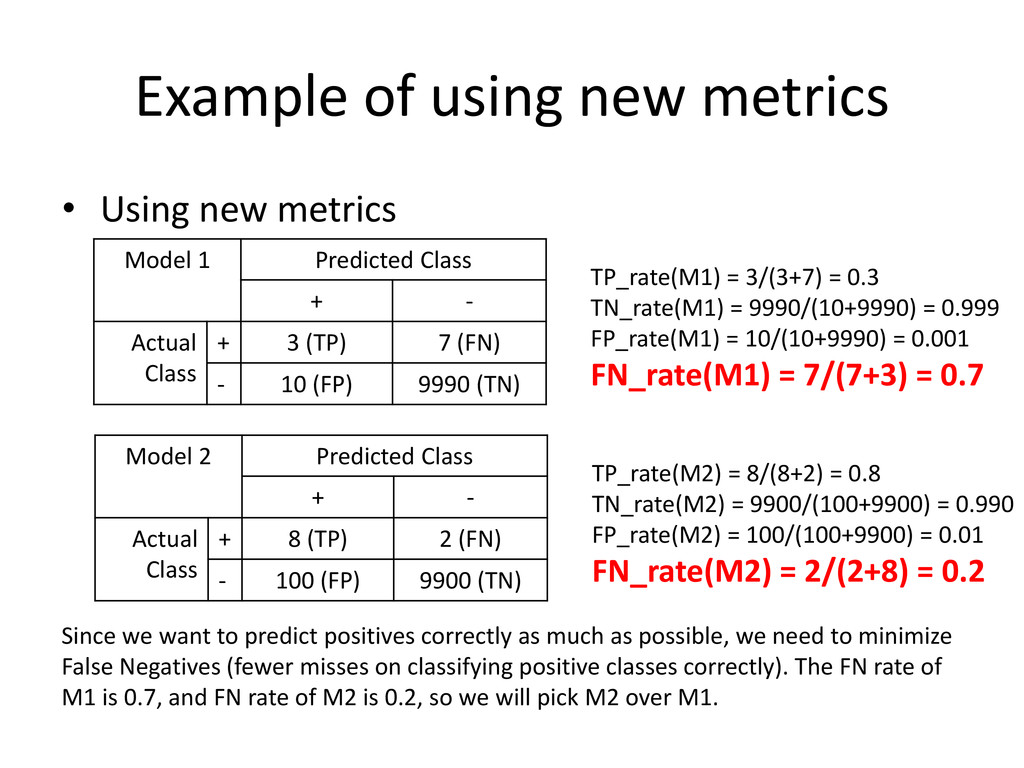
1 Predicted Class + - Actual Class + 3 (TP) 7 (FN) - 10 (FP) 9990 (TN) TP_rate(M1) = 3/(3+7) = 0.3 TN_rate(M1) = 9990/(10+9990) = 0.999 FP_rate(M1) = 10/(10+9990) = 0.001 FN_rate(M1) = 7/(7+3) = 0.7 Model 2 Predicted Class + - Actual Class + 8 (TP) 2 (FN) - 100 (FP) 9900 (TN) TP_rate(M2) = 8/(8+2) = 0.8 TN_rate(M2) = 9900/(100+9900) = 0.990 FP_rate(M2) = 100/(100+9900) = 0.01 FN_rate(M2) = 2/(2+8) = 0.2 Since we want to predict positives correctly as much as possible, we need to minimize False Negatives (fewer misses on classifying positive classes correctly). The FN rate of M1 is 0.7, and FN rate of M2 is 0.2, so we will pick M2 over M1.
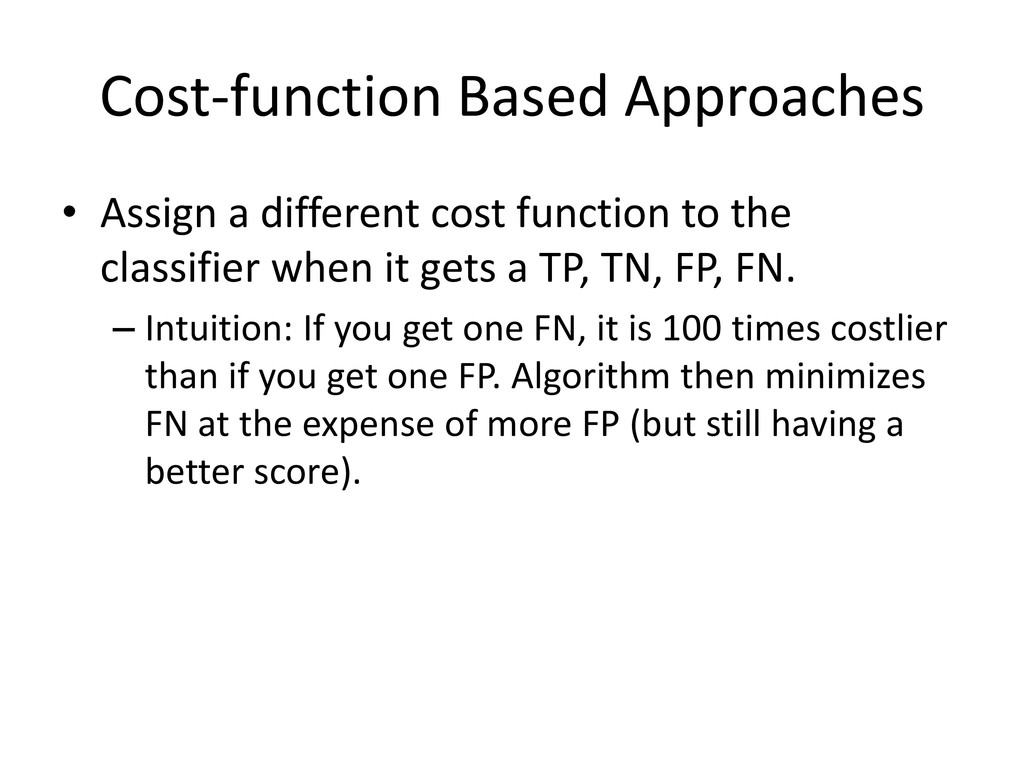
the classifier when it gets a TP, TN, FP, FN. – Intuition: If you get one FN, it is 100 times costlier than if you get one FP. Algorithm then minimizes FN at the expense of more FP (but still having a better score).
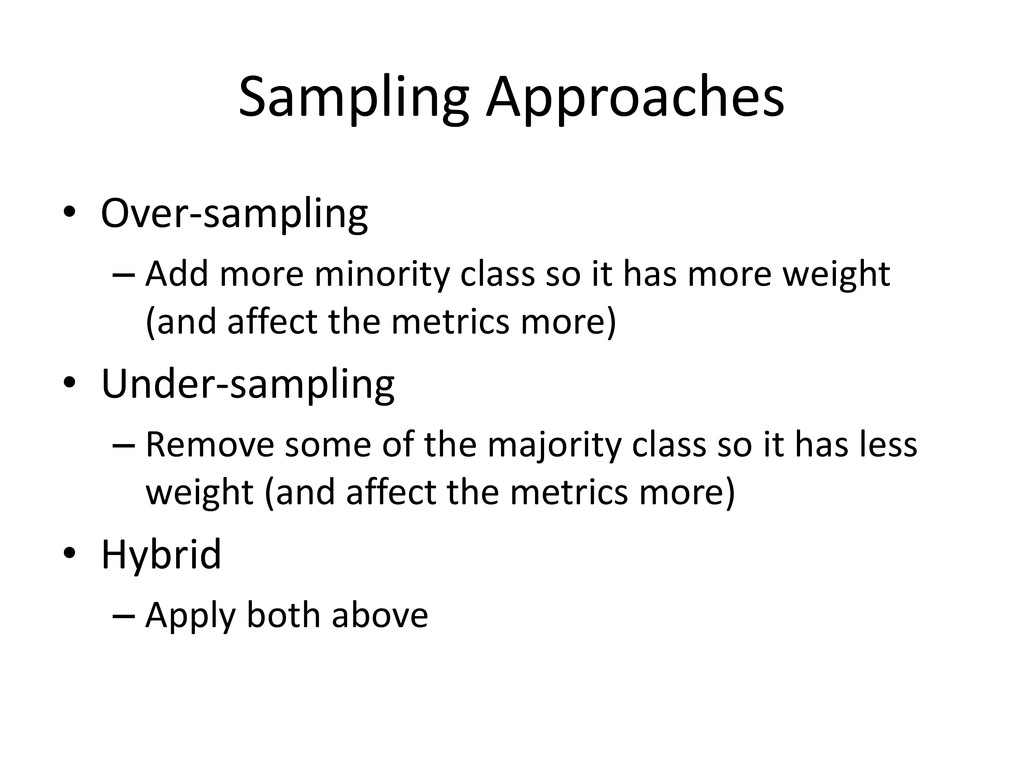
it has more weight (and affect the metrics more) • Under-sampling – Remove some of the majority class so it has less weight (and affect the metrics more) • Hybrid – Apply both above
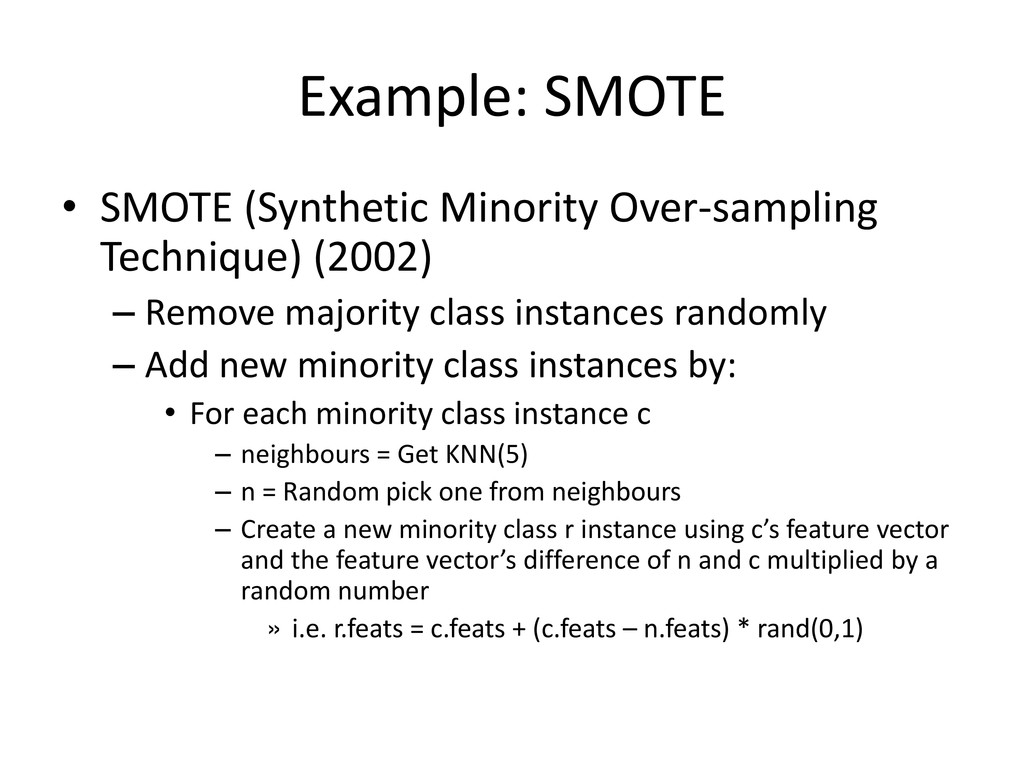
Simply removing majority classes randomly discards useful information • Just replicating randomly minority classes could cause overfit – The classifier becomes very specific about the minority classes • SMOTE tries to address the drawbacks
Remove majority class instances randomly – Add new minority class instances by: • For each minority class instance c – neighbours = Get KNN(5) – n = Random pick one from neighbours – Create a new minority class r instance using c’s feature vector and the feature vector’s difference of n and c multiplied by a random number »i.e. r.feats = c.feats + (c.feats – n.feats) * rand(0,1)
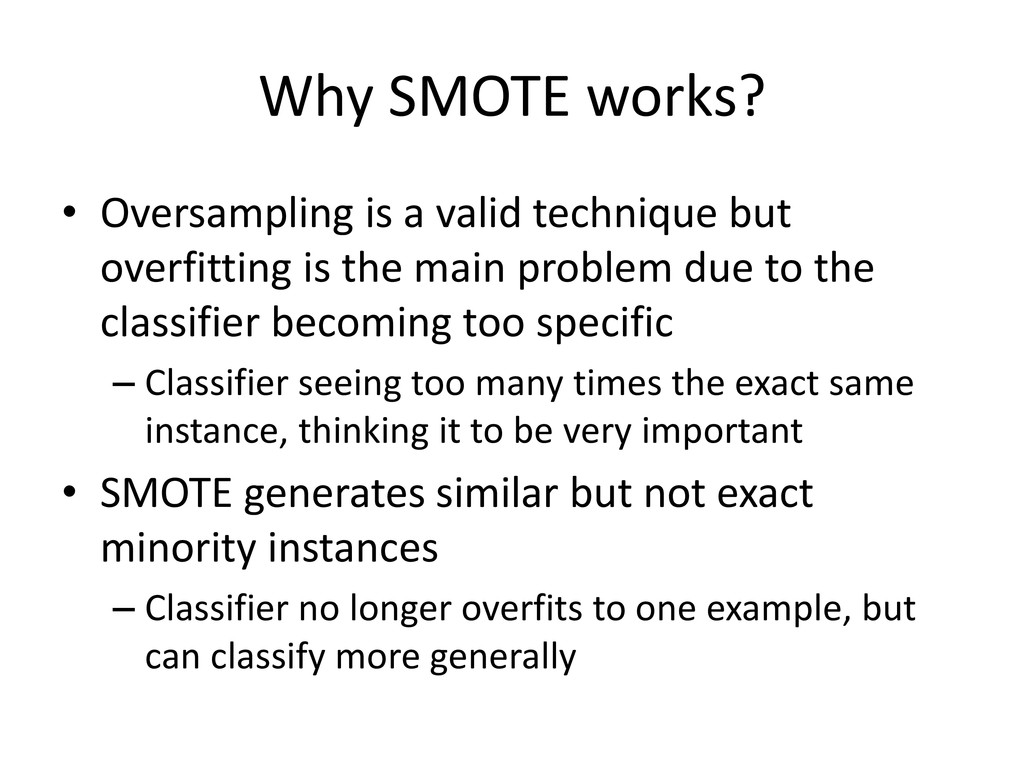
overfitting is the main problem due to the classifier becoming too specific – Classifier seeing too many times the exact same instance, thinking it to be very important • SMOTE generates similar but not exact minority instances – Classifier no longer overfits to one example, but can classify more generally
machine learning due to having disproportionate number of class instances • Traditional metrics do not work • Mitigations are based on two general approaches: Sampling-based and Cost- sensitive-based
The Class Imbalance Problem Significance and Strategies • A Review on Ensembles for the Class Imbalance Problem Bagging-, Boosting-, and Hybrid-Based Approaches