Upgrade to Pro — share decks privately, control downloads, hide ads and more …

When do you need it by? Business Agility Metrics

Martin Aziz
October 30, 2018
1k

When do you need it by? Business Agility Metrics

Martin Aziz

October 30, 2018
Tweet

Transcript

  1. @martinaziz Martin Aziz Business Change Consultant [email protected] When will it

    be done? When do you need it by? Business-Agility Metrics in an Agile World Toronto Agile Conference 2018
  2. Making Sense of a Metrics Dashboard Sprint Velocity by team

    Happiness Index Test Coverage Number of teams Doing Scrum How long it took Story Point Totals Level of Automation Feature Usage
  3. Your customers maybe cares about one or two of these.

    Sprint Velocity by team Happiness Index Test Coverage Number of teams Doing Scrum How long it took Story Point Totals Level of Automation Feature Usage
  4. 4 Types of Metrics 1. Fitness Criteria 2. Improvement Drivers

    3. General Health Indicators 4. Vanity Metrics Metrics aren’t all the same. Let’s consider a way to classify them.
  5. . Has thresholds Fit – positively affects choice Unfit –

    Negatively affects choice Overserving – No longer affects choice Fitness Criteria – The only thing that directly affect customer choices e.g. Fast Enough Sufficient Quality Sufficient Selection Taste Weight, etc…
  6. e.g. Dollar per Win Ratio Level of Automation Profit per

    customer visit Test Coverage Impact to fitness criteria needs to be understood. May have unintended consequences and diminishing returns. Improvement Drivers- Have a target to be achieved.
  7. e.g. Cholesterol levels Static Code Analysis Employee Engagement Scores Staff

    Turnover Test Coverage Can be within a defined healthy range without intervention “let’s keep an eye on that” General Health Indicators – A range of healthy variability. Is the business healthy enough to pursue its strategy?
  8. Vanity Metrics – Make you feel good, doesn’t affect customer

    choice. Mistaken for one of the other 3 metrics. In many cases driven from company culture. e.g. Consecutive Games Won Number of Agile Teams On-Time Departure
  9. 4 Types of Metrics 1. Fitness Criteria – Affect Selection

    2. Improvement Drivers – Have Targets 3. General Health Indicators – Have Safe Ranges 4. Vanity Metrics – Make you feel good fitterforpurpose.com
  10. Reexamining the dashboard Sprint Velocity by team Happiness Index Test

    Coverage Number of teams Doing Scrum How long it took Story Point Totals Level of Automation Feature Usage ? Fitness Criteria Improvement Drivers Health Indicators Vanity Metrics
  11. Focusing on how long the customer waits * * Lead

    Time The Organization Value Customer Customer “I promise” “Here it is”
  12. The Cumulative Flow Diagram (CFD) Compares the rate that work

    arrives to the rate it is being completed. 7 6 5 4 3 2 1 1 2 3 4 5 6 7 8 9 Average time customer waits Average work in the process Time (days) Work Items
  13. Lead Time Distribution Histogram 0 5 10 15 20 25

    1 4 7 10 13 16 19 22 25 28 31 34 37 40 43 46 49 52 55 58 Frequency Duration (days) AVG 5.7 90th 14.4 Average - not particularly useful Confidence Percentile – Useful in providing confidence intervals for prediction & planning. “90% probability we can delivery within 15 days” Length of tail. Gives us information about our delivery variability. i.e. size of the risk
  14. Service Control Chart Point in time where change was introduced.

    New upper boundary of variation. Control Charts We introduce a lot of changes to try to improve. How do we know they are working?
  15. “How Agile are We?” Weekly Daily Hourly Monthly Quarterly Yearly

    Replenishment Frequency Weekly Daily Hourly Monthly Quarterly Yearly Release Frequency How Fast How Predictable Frequency Frequency Speed Predictability Market Strategy www.leanatoz.com
  16. Why do we need to know about flow? Will adding

    more horsepower to these cars solve the problem?
  17. A look at Flow Efficiency Wait Wait Wait Wait Work

    Work Work Work Flow Efficiency = work work + wait x 100% < 2% common < 15% frequent < 40% good + rare Industry Range
  18. Have you ever seen the weather predicted this way? Week

    Complete! Mon. Tue. Wed. Thu. Fri. Sat. Sun.
  19. We’re more used to seeing this Percentage likelihood Range of

    possibilities ~ scientific for “ish” Range
  20. Contrasting the two approaches Week Complete! Mon. Tue. Wed. Thu.

    Fri. Sat. Sun. Deterministic Probabilistic More Useful But… how useful is a weather report for 80 days from now?
  21. Mediocristan What is the variation of height in this room?

    4.6 4.8 5 5.2 5.4 5.6 5.8 6 6.2 6.4 6.6 6.8 7 7.2 7.4 7.6 7.8 8 8.2 8.4 “Bell Curve” / “Gaussian Distribution” MEDIAN = 5.8 ft AVG=5.7 ft
  22. Mediocristan What is the variation of height in this room?

    4.6 4.8 5 5.2 5.4 5.6 5.8 6 6.2 6.4 6.6 6.8 7 7.2 7.4 7.6 7.8 8 8.2 8.4 “Bell Curve” / “Gaussian Distribution” Q: What happens if Andre the Giant walked into this room? 4.6 4.8 5 5.2 5.4 5.6 5.8 6 6.2 6.4 6.6 6.8 7 7.2 7.4 7.6 7.8 8 8.2 8.4 André René Roussimoff “Andre the Giant” 7 ft 4 in MEDIAN = 5.8 ft AVG=5.7 ft A: Very little
  23. Extremistan What is the variation of wealth in this room?

    Exponential / Pareto Distribution MEDIAN = $701K AVG = $844K Emergence of a tail
  24. Extremistan What is the variation of wealth in this room?

    Exponential / Pareto Distribution Q: What happens if Bill Gates walked into this room? MEDIAN = $701K AVG = $844K Emergence of a tail A: On average everyone in this room is a billionaire! MEDIAN = $701K AVG = $1B Bill Gates Net Worth $94.6B
  25. MEDIAN = $701K AVG = $844K Emergence of a tail

    Extremistan makes predictions of limited value. Ranges are too broad. Fat Tail
  26. How many features will be required? How long will each

    feature take to do? How many delays? Impact of each delay? Throughput Variability is embedded from multiple sources Work in Process Where is all this variation coming from in Knowledge Work? How can we possibly answer “when will I get it?”
  27. How many features will be required? How long will each

    feature take to do? How many delays? Impact of each delay? Throughput Demand Shaping Batch Size Feature Split Rates Policies Classes of Service Skill Liquidity Feature Split Rates Work in Process Batch Size Service Flow WIP Limit WIP Cut the tails. And you will be able to predict!
  28. Work in Process Lead Time Classes of Service Lead Time

    System Capacity Work Types The Kanban Method gives you control over variability
  29. Expedite “Security Breach” Fixed Date “Stadium on time for Olympics”

    Standard “Regular delivery from Amazon” Cost of Delay Profiles Time Impact of Delay Time Impact of Delay Impact of Delay Time Don’t treat all work the same
  30. Managed Tails. Allow for predictions. Deferred Commitment based on “When

    do you need it by?” Need it by Today New capability. Manages the tail. Allows prediction. Optimal Start Date Old capability. Tail not managed. Hard to predict. Tendency to come in late. Allows you to defer committing to start.
  31. “When do you need it by” in action! Ok, so

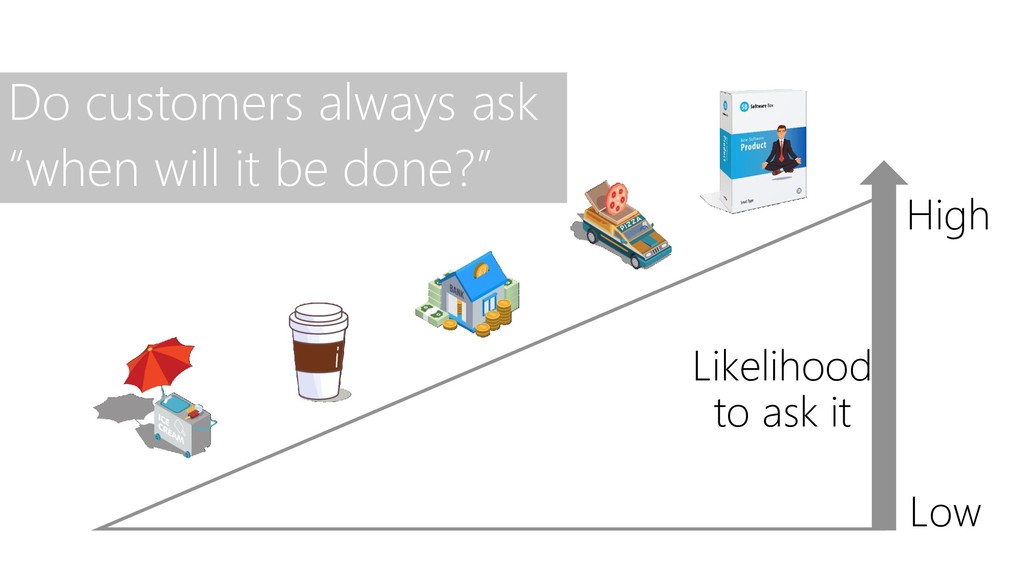
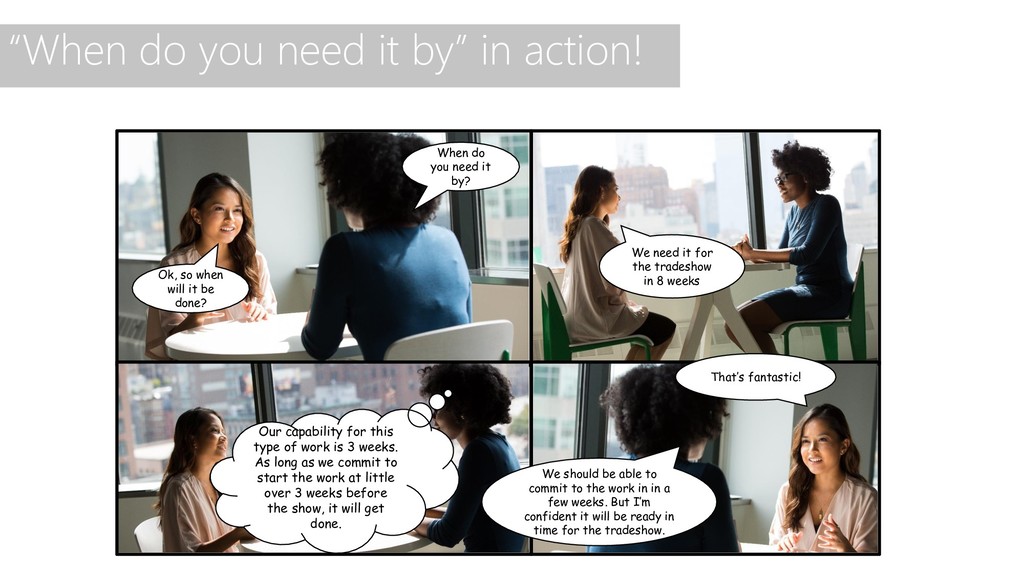
    when will it be done? When do you need it by? We need it for the tradeshow in 8 weeks Our capability for this type of work is 3 weeks. As long as we commit to start the work at little over 3 weeks before the show, it will get done. We should be able to commit to the work in in a few weeks. But I’m confident it will be ready in time for the tradeshow. That’s fantastic!
  32. Thank you Find out more Q&A Resources: o KMP I

    & II – Lean Kanban Institute o ESP – Lean Kanban Institute o Fit for Purpose – Zheglov & Anderson o Antifragile & Skin in the Game – Nassim Taleb o The Flaw of Averages – Sam Savage o Focused Objective Tools - Troy Magennis o Swift Kanban – Digité Software KanbanTO Meetup Schedule a Consult @martinaziz Martin Aziz Business Change Consultant [email protected]