at Etsy. I left earlier this year to start a new company with some other folks from Etsy. But I still think Etsy is awesome. I had a great time there and learned an awful lot. So I have a few talks left to do about this I guess.
not be familiar with Etsy, so I’ll give you a little background. Etsy’s a marketplace for handmade and vintage goods. It gets about 4 million uniques a day, and it sold well over a billion dollars in goods in 2013. What I’m trying to do with this slide is convince you that Etsy is pretty freaking big, even if you haven’t heard of it. It’s certainly within the top 100 websites in the US.
the company line. We should be data driven. Someone heard that Google was data driven, and we wanted to be like Google. So we should be data driven. There was one problem with this.
get a project approved, you’d dress it up in data. You’d sprinkle some numbers on it and wave a dead chicken at it to show you were being data driven. It was display behavior.
this out. I started to figure out what it would mean to be data driven while you’re picking priorities. And I also realized that it’s not that complicated. That’s what this talk is about.
would not want anyone to get the wrong impression here and think I’m talking smack about Etsy in the early days. It was awesome. I miss 2007 all the time.
grew geometrically because it was a thing that was out there waiting to be discovered. It didn’t grow that way because of carefully planned product and marketing efforts. Sure, there was agency in the creation of the site. And people worked hard. But the massive growth that happened wasn’t strongly connected to the actions of employees. This is utterly obvious to those of us that were there.
see things that way. Instead we all tend to think that if your work takes off, it means you’re smart and your actions are good. We assume that the methods that precede success caused it.
insane, it looks like it’s working. You can release things and as long as they don’t completely destroy everything it will look like you’re a genius. All the graphs will go up and to the right. And that’s awesome for as long as you don’t think about it too hard.
only person to notice this) was that we had been consistently deleting features after a while because nobody wound up using them. We’d release a feature, and a year or two later it would need maintenance or become a support headache. At that point we’d look to see if anyone was using it, and pretty often the answer would be “no.” So we’d just kill the thing.
This was a feature that let you describe an item you wanted, and then have Etsy shop owners bid on making it for you. That’s a neat idea, and it was in the New York times a few times and was generally considered awesome when it came out back in 2008.
I looked into it at the time, and I think the statistic was that in three years Alchemy sold about as many items as the rest of the site sells in less than a day. It was a giant bust.
some way I could avoid participating in projects like alchemy. Because there’s this weird thing about me: I prefer not to work on things that aren’t going to be used and are just destined to be taken down after a year or two.
earnest. And I latched onto that as a possible solution. Instead of pushing things out to everyone all at once we’d do a split test and try to get a quantitative measure of how we were doing.
crap! We’ve been delusional about our abilities up to this point. A huge percentage of products that we tested either had no effect, or made things worse. Usually only slightly worse, but still. And we certainly weren’t having the positive impact we imagined.
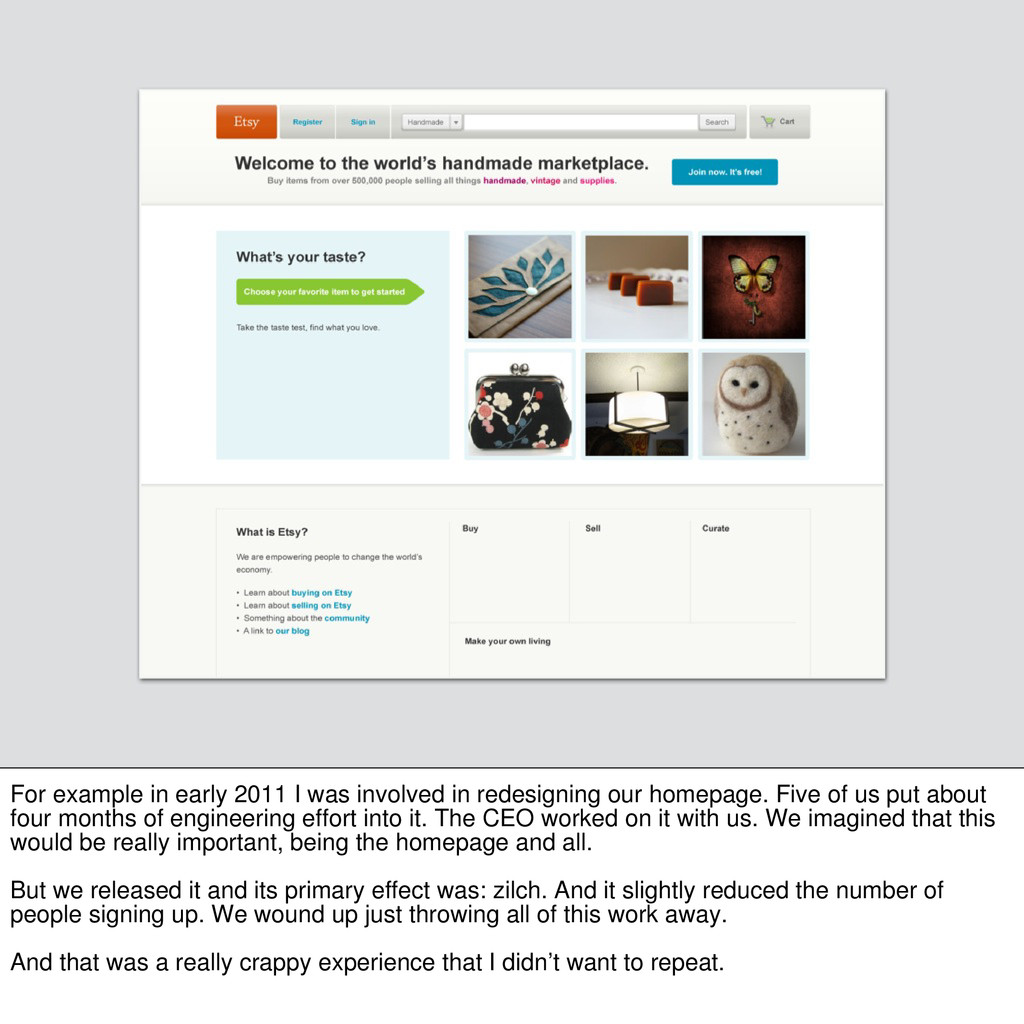
our homepage. Five of us put about four months of engineering effort into it. The CEO worked on it with us. We imagined that this would be really important, being the homepage and all. But we released it and its primary effect was: zilch. And it slightly reduced the number of people signing up. We wound up just throwing all of this work away. And that was a really crappy experience that I didn’t want to repeat.
when we were releasing products, we’d opened Pandora’s box. It would be pretty disingenuous for us to just ignore this problem and go back to not A/B testing. But we weren’t happy releasing products that had a minor, neutral, or even negative impact.
more like this. It’s a little more complicated, but it worked a lot better. The premise of this is basically, “hey, maybe we should incorporate data earlier on in the process.”
this is a screenshot of one of my prototypes that was notoriously ugly, even when it wasn’t trying to sell you rhinoceros beetle taxidermy. I would come into work every day while this experiment was running and have a discussion with a designer or a support person about how crappy it looked in some edge cases. I’d smile and nod and say we’d fix the rough edges after we were sure it was going to last. And eventually we did that.
me at least two relatively inexpensive places where I can decide to give up on a project that isn’t working. Of course I still have the option of scrapping it at the very end, but I’m less likely have to exercise that.
to have a lot of downtime while you’re waiting for A/B tests to finish running. So I started pipelining other projects. I’d get the process going on something else while I was waiting for experimental results. It wasn’t uncommon for me to have two or three or five running experiments at once.
analysis isn’t work, at least not in the same way that coding features is work. Time spent doing analysis can be a lot more valuable than time spent coding. But that’s contrary to all of our instincts as engineers.
came up at some point. I think they both sound like pretty good ideas when you first hear them. And early on that would have been enough for someone to work on them.
pages for all of its categories. And furniture is pretty hard to buy on the internet, because shipping it is difficult. Maybe we could improve the experience by making the pages show items that are geographically close to the visitor.
views that are on the page we’d be talking about changing. And in this case, these pages have quite a bit of traffic. It’s not the most important page, but it’s something.
things that they first encountered on these pages. And If you do that the project looks a little less attractive, because these pages really don’t sell many items. That doesn’t necessarily mean that the browse pages are bad. It’s probably just that the traffic on those pages tends to be pretty removed from the purchasing decision. Compare that to the search page, which has a ton of traffic but also sells a ton of items. Once you’ve gone to the trouble of typing a search, you’re a lot more likely to be in buying mode.
worth digging into. Sure, we won’t sell many more items total, but the ones we do sell will cost more. If the average order on Etsy is $40—which by the way it’s not, I am making up financial details in this talk—let’s guess that the average order we’ll create will be ten times that. Let’s guess $400.
number of visitors to the site, some percentage of them convert into purchases, and each purchase is worth some average amount. And then we multiply that by how much we’re going to improve matters.
like this. I’ve picked a half percent through a two percent increase in sales, which based on our past experience might be even a little nuts. A 2% increase in conversions on a page like this would be relatively unheard of. But let’s say we really hit it out of the park and managed a 2% increase. That would mean Etsy would sell $1000 more per day.
doesn’t keep all of the money when an item sells. Etsy only takes 3.5% of the purchase price as a fee. So if we include that it adds some additional context. The net benefit to Etsy for this feature starts to look pretty bad. If two engineers work on this for a month and they have a designer for half that time, then this feature would take a long time to earn back their salaries. Not to mention HR overhead, managerial overhead, the incremental electricity required to run the feature, etc.
have to run this experiment to expect to get a statistically significant result. In this example the experiment would have to run for the rest of the decade. That is not ideal.
spend time on something else. And the work I did to determine this only took me about an afternoon. I didn’t waste a month of my life on it, so I count that as a victory.
couple of steps. You add something to your cart, you fill out your credit card and shipping address, and so on. People can quit at any step along the way. The idea here would be to wait five days and then send people an email asking if they really meant to buy that thing they started buying.
email every day, and their average purchase is $40, our model looks like this. I plugged in some guesses for how many people would complete the purchase, starting at 1% on the lower end. I think 1% is a reasonable guess because these people are already pretty far down the checkout funnel. On the low end of things, we’d sell $8,000 more per day.
It wound up being between a half and one percent of total sales. That might not sound like a lot, but remember that huge percentage gains are really hard to come by. This was a really big deal, as far as these things go.
think about this kind of project validation is Archimedes with his lever. (Not to be grandiose or anything.) Archimedes said that given a place to stand, he could move the Earth. Picking products based on data is "finding your place to stand” before you apply your effort.
volume and the audience. This is the relationship you're really trying to reason about. By volume I mean how many people there are, and by audience I mean the characteristics of those people. How often they buy. How much they spend. etc. In the furniture landing page example I gave you there was a lot of volume, but the audience was made up of people that didn’t buy very much. That made it an unattractive project.
helps to be able to recall your core business metrics without digging them up. Obviously these are the ones you care about for an e-commerce site like Etsy. You would care about different metrics for other kinds of sites.
mind is to make it impossible for people not to see them. At Etsy we had this toolbar that employees could see. I wrote some code to stick page-specific business metrics into it. So people would go about their business on the site every day, and they’d just be involuntarily exposed to relevant numbers. There was no escape.
data, so you can’t do this. Everything you do will probably be some kind of crap shoot. More mature companies should have tons of data, and could theoretically do this for every project. But even then that’s probably still not what you should do.
feature that isn’t going to move the needle. What I think is a tragedy is to work on something thinking it will have a big impact, when you should have known better.
that people are doing this work for them. That was certainly my implicit assumption when I started my career. And most of the engineers I’ve worked with have had the same notion. But people might not be doing anything like this when they’re assigning you projects. You should make sure that they are. Or you should do it yourself.
that engineers and product managers should realize that not only are they capable of doing the work, they might be the people MOST capable of doing the work. If your data tooling isn’t sophisticated, engineers might be the only people who can get some of these numbers.