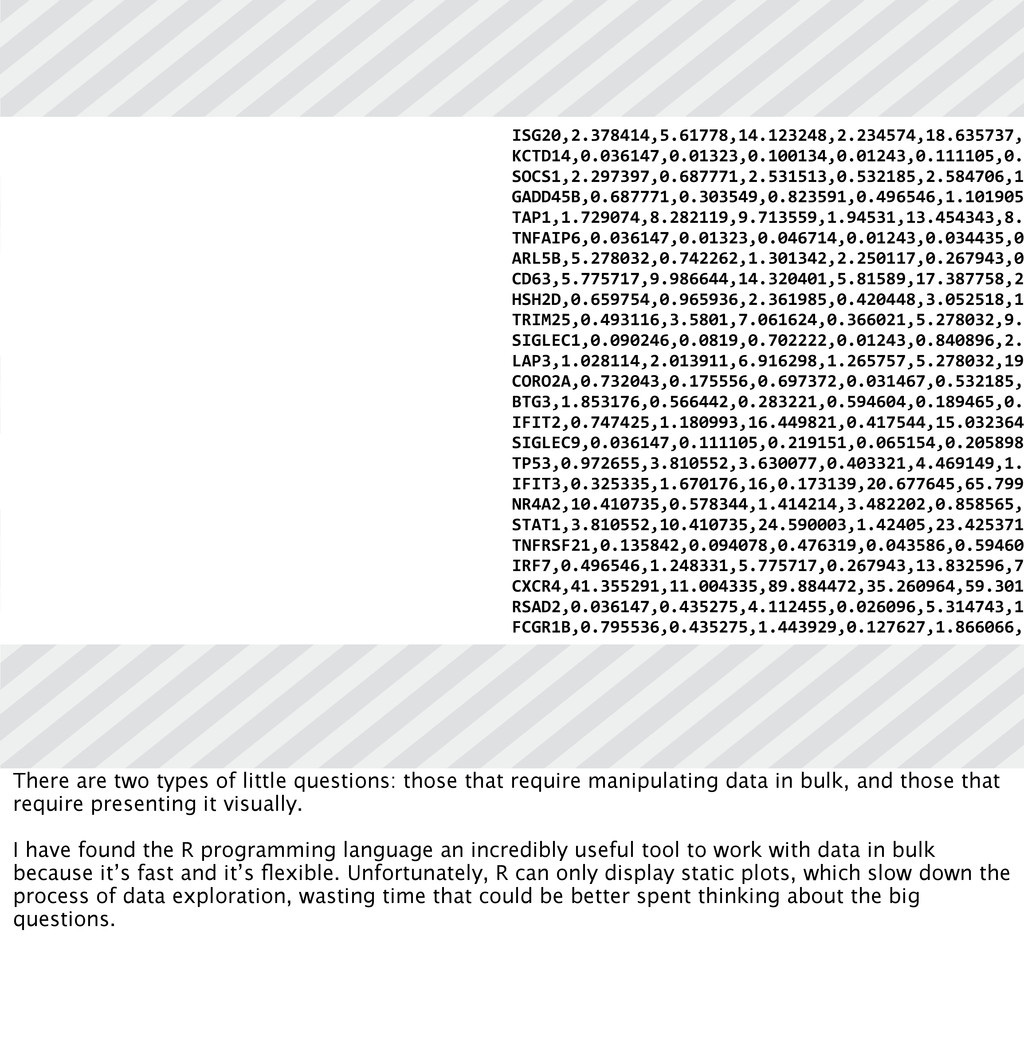
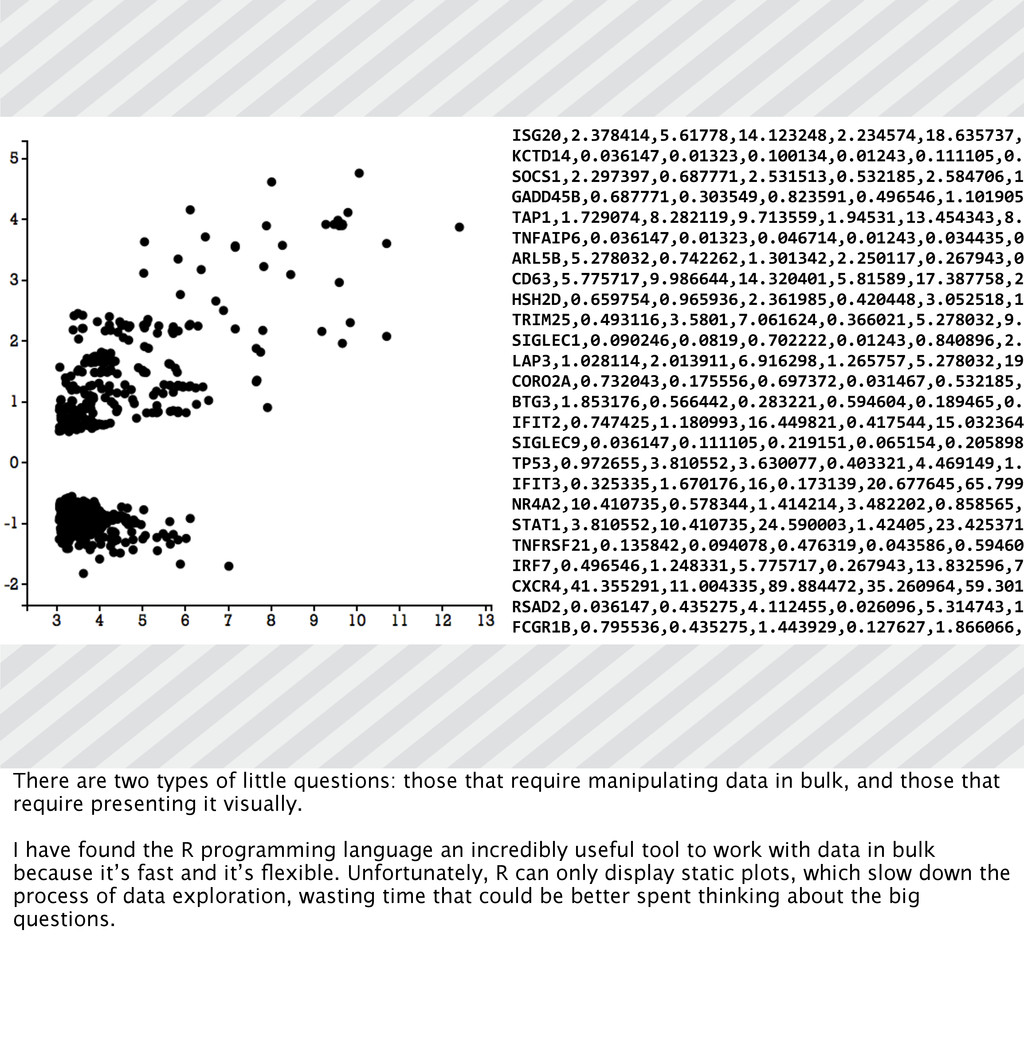
SIGLEC1,0.090246,0.0819,0.702222,0.01243,0.840896,2. LAP3,1.028114,2.013911,6.916298,1.265757,5.278032,19 CORO2A,0.732043,0.175556,0.697372,0.031467,0.532185, BTG3,1.853176,0.566442,0.283221,0.594604,0.189465,0. IFIT2,0.747425,1.180993,16.449821,0.417544,15.032364 SIGLEC9,0.036147,0.111105,0.219151,0.065154,0.205898 TP53,0.972655,3.810552,3.630077,0.403321,4.469149,1. IFIT3,0.325335,1.670176,16,0.173139,20.677645,65.799 NR4A2,10.410735,0.578344,1.414214,3.482202,0.858565, STAT1,3.810552,10.410735,24.590003,1.42405,23.425371 TNFRSF21,0.135842,0.094078,0.476319,0.043586,0.59460 IRF7,0.496546,1.248331,5.775717,0.267943,13.832596,7 CXCR4,41.355291,11.004335,89.884472,35.260964,59.301 RSAD2,0.036147,0.435275,4.112455,0.026096,5.314743,1 FCGR1B,0.795536,0.435275,1.443929,0.127627,1.866066, There are two types of little questions: those that require manipulating data in bulk, and those that require presenting it visually. I have found the R programming language an incredibly useful tool to work with data in bulk because it’s fast and it’s flexible. Unfortunately, R can only display static plots, which slow down the process of data exploration, wasting time that could be better spent thinking about the big questions.