Upgrade to Pro
— share decks privately, control downloads, hide ads and more …
Speaker Deck
Features
Speaker Deck
PRO
Sign in
Sign up for free
Search
Search
Barry Kronenfeld Cartograms
Search
NACIS
October 15, 2015
210
0
Share
Embed
Copy iframe code
Copy JS code
Copy link
Start on current slide
Barry Kronenfeld Cartograms
NACIS
October 15, 2015
More Decks by NACIS
See All by NACIS
Elaine Guidero
nacis
1
320
Nat Case Trust the surveyor as far as you can throw him
nacis
0
150
Dennis Street Names
nacis
0
180
Leo Dillon Toponyms
nacis
0
170
Barbara Iran Art Aesthetics Maps
nacis
0
150
Marcy Bidney American Geographic Society Library
nacis
0
200
Jonathan Schroeder NGIS Time Series Tables
nacis
0
200
Paul Hunt Census Mapping Mashups
nacis
0
150
Featured
See All Featured
A brief & incomplete history of UX Design for the World Wide Web: 1989–2019
jct
2
420
VelocityConf: Rendering Performance Case Studies
addyosmani
333
25k
Primal Persuasion: How to Engage the Brain for Learning That Lasts
tmiket
0
390
XXLCSS - How to scale CSS and keep your sanity
sugarenia
249
1.3M
Let's Do A Bunch of Simple Stuff to Make Websites Faster
chriscoyier
508
140k
[Rails World 2023 - Day 1 Closing Keynote] - The Magic of Rails
eileencodes
38
2.9k
WCS-LA-2024
lcolladotor
0
700
Organizational Design Perspectives: An Ontology of Organizational Design Elements
kimpetersen
PRO
1
760
Odyssey Design
rkendrick25
PRO
2
730
Mozcon NYC 2025: Stop Losing SEO Traffic
samtorres
1
350
A Soul's Torment
seathinner
6
3.1k
Bootstrapping a Software Product
garrettdimon
PRO
307
120k
Transcript
Where the People Are Barry J Kronenfeld Eastern Illinois University
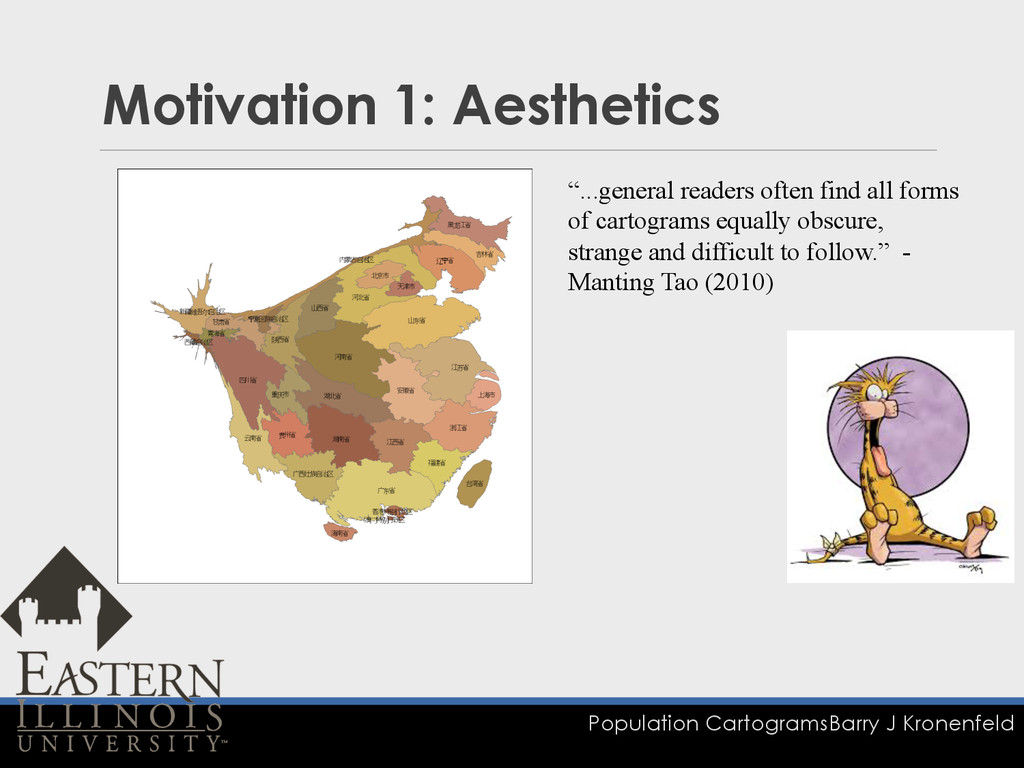
Population Cartograms Barry J Kronenfeld Motivation 1: Aesthetics “...general readers
often find all forms of cartograms equally obscure, strange and difficult to follow.” - Manting Tao (2010)
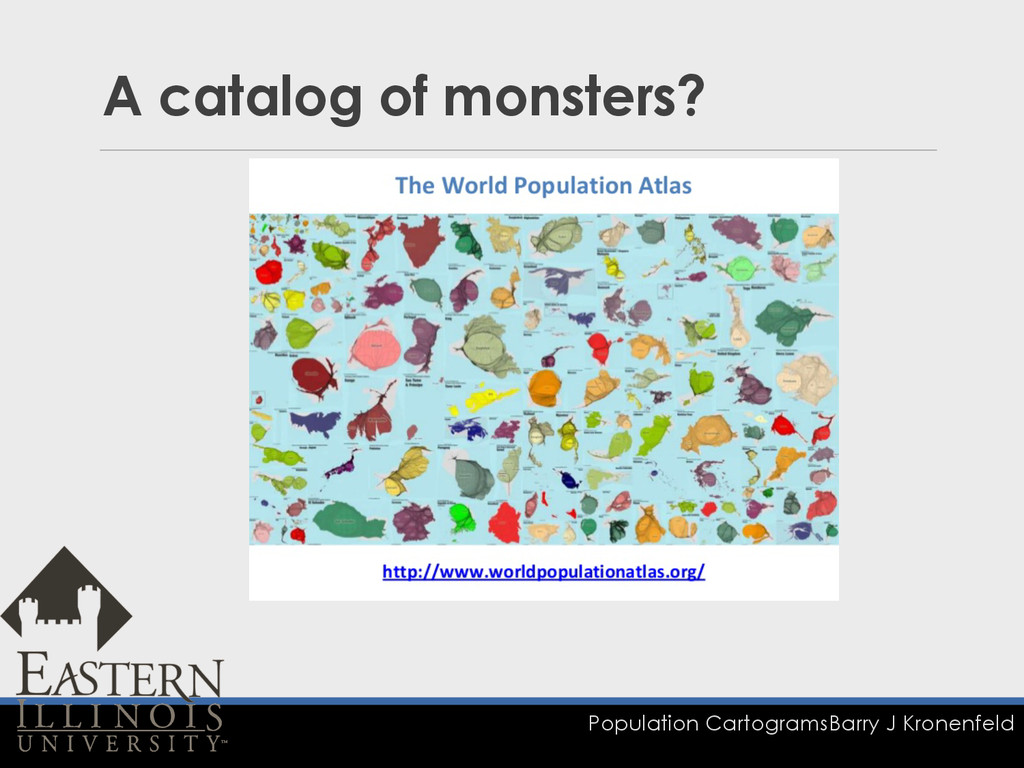
Population Cartograms Barry J Kronenfeld A catalog of monsters?
Population Cartograms Barry J Kronenfeld Cartograms of a different era
Population Cartograms Barry J Kronenfeld
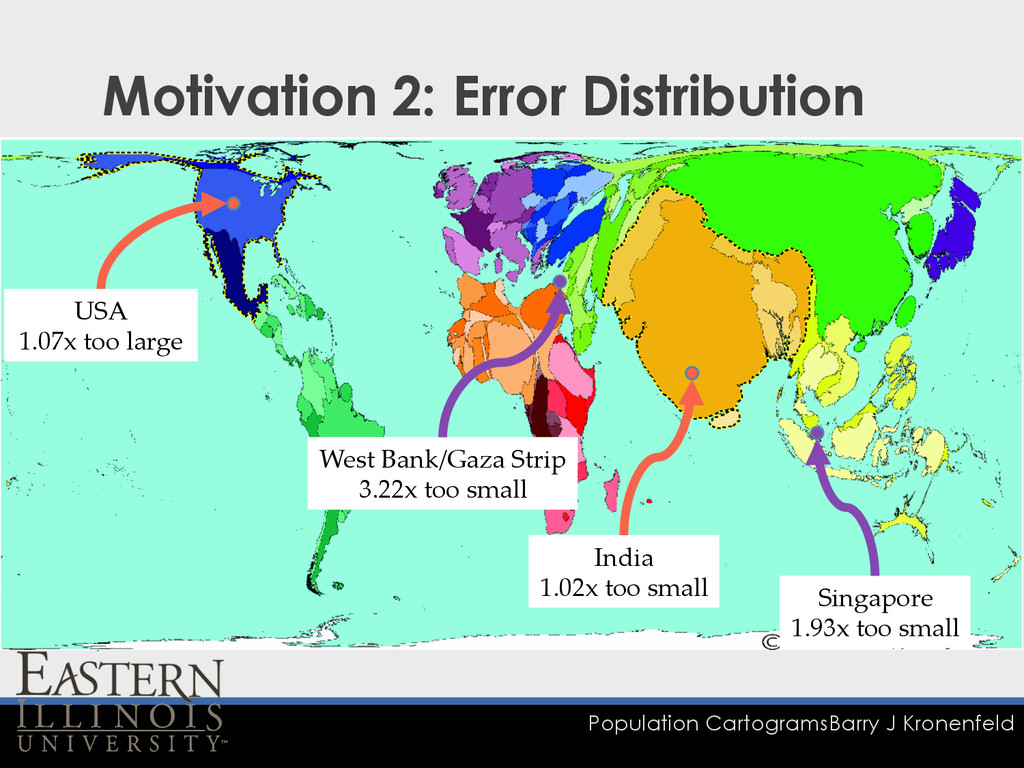
Population Cartograms Barry J Kronenfeld Motivation 2: Error Distribution USA
1.07x too large West Bank/Gaza Strip 3.22x too small Singapore 1.93x too small India 1.02x too small
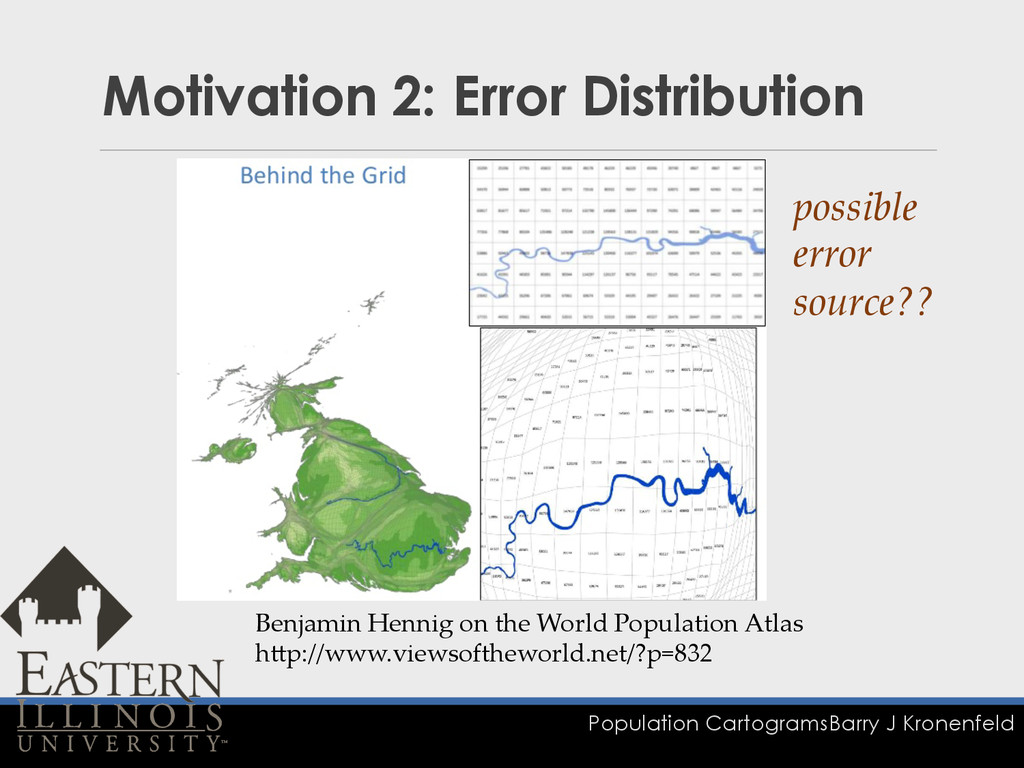
Population Cartograms Barry J Kronenfeld Motivation 2: Error Distribution Benjamin
Hennig on the World Population Atlas hGp://www.viewsoftheworld.net/?p=832 possible error source??
Population Cartograms Barry J Kronenfeld Objectives 1. Create software for
manual cartogram construction 2. Manually construct USA states cartogram 3. Assess: r accuracy r aesthetics r feasibility
1. Software Environment for Manual Cartogram Construction
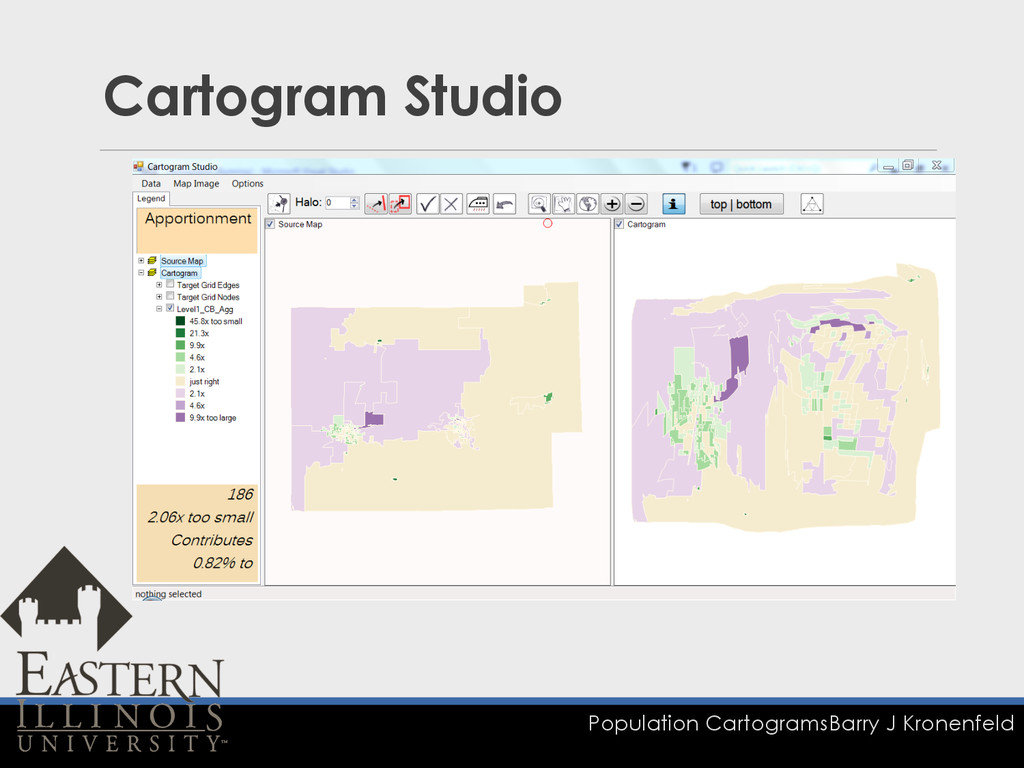
Population Cartograms Barry J Kronenfeld Cartogram Studio
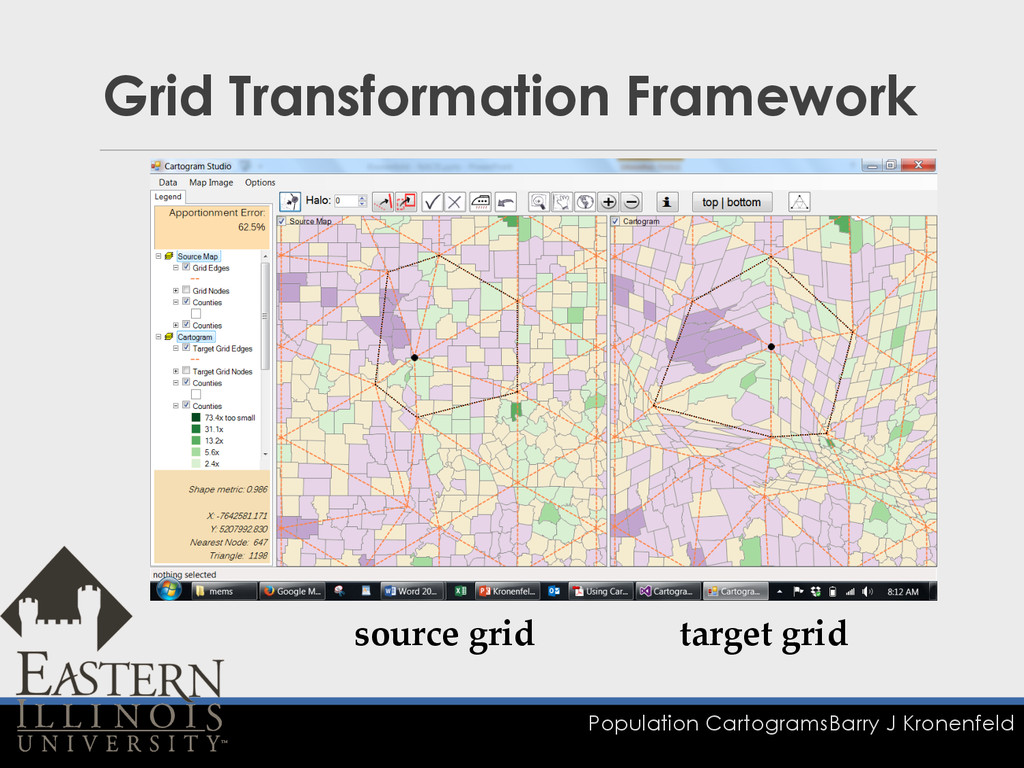
Population Cartograms Barry J Kronenfeld Grid Transformation Framework source grid
target grid
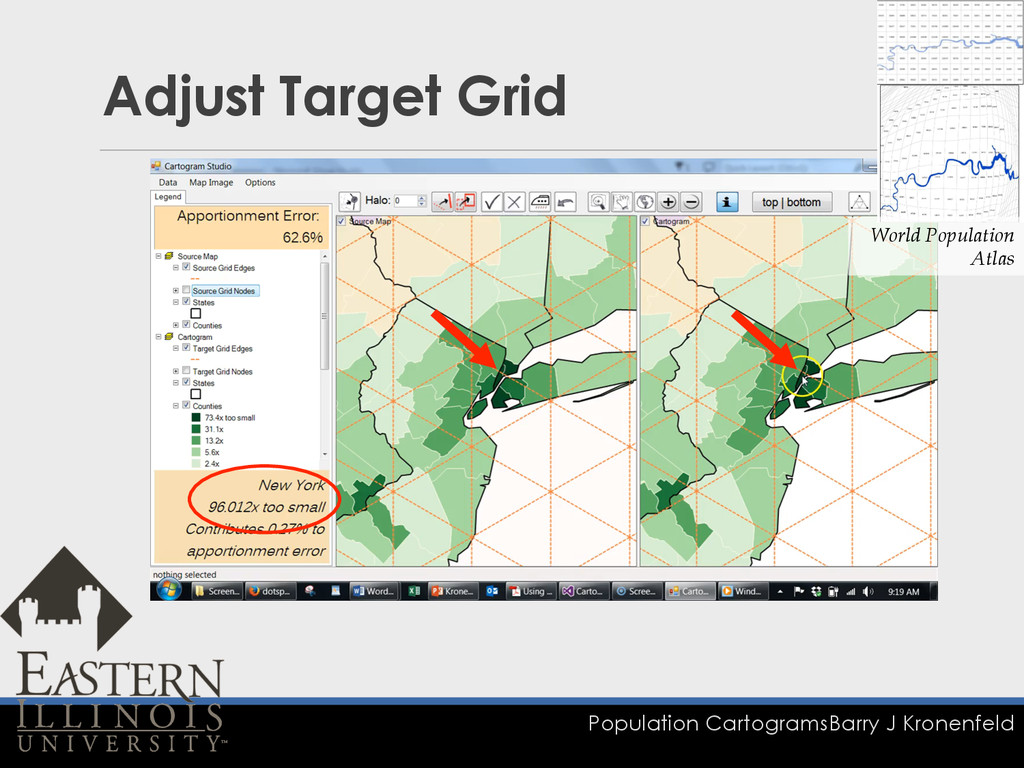
Population Cartograms Barry J Kronenfeld Adjust Target Grid World Population
Atlas
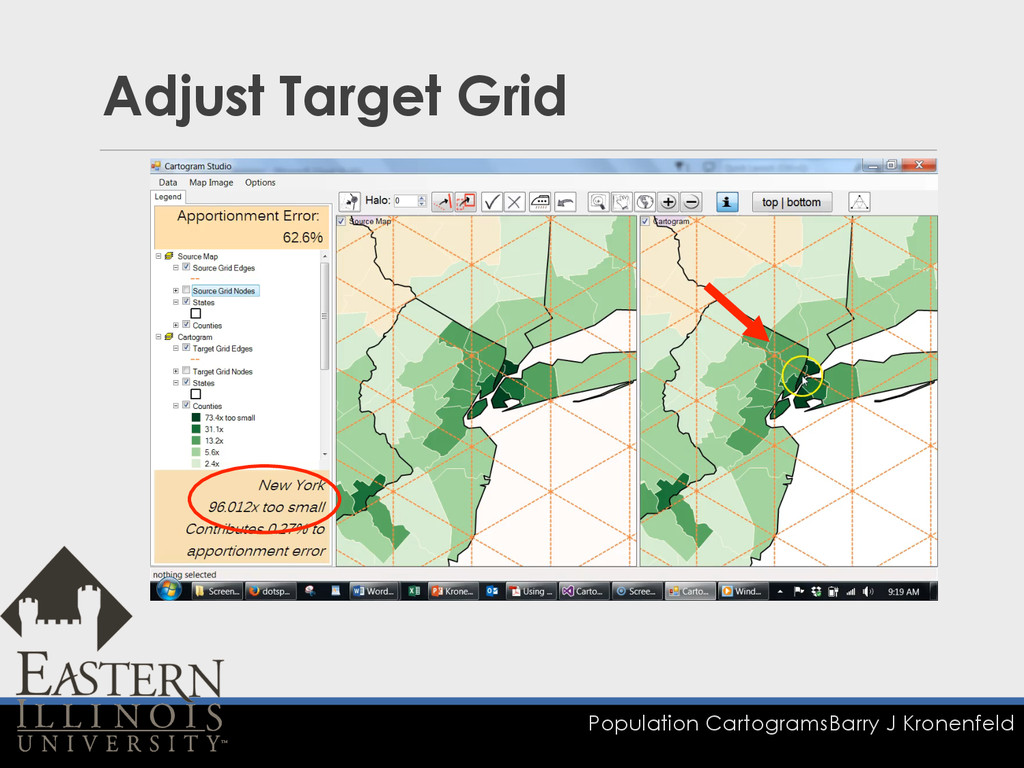
Population Cartograms Barry J Kronenfeld Adjust Target Grid
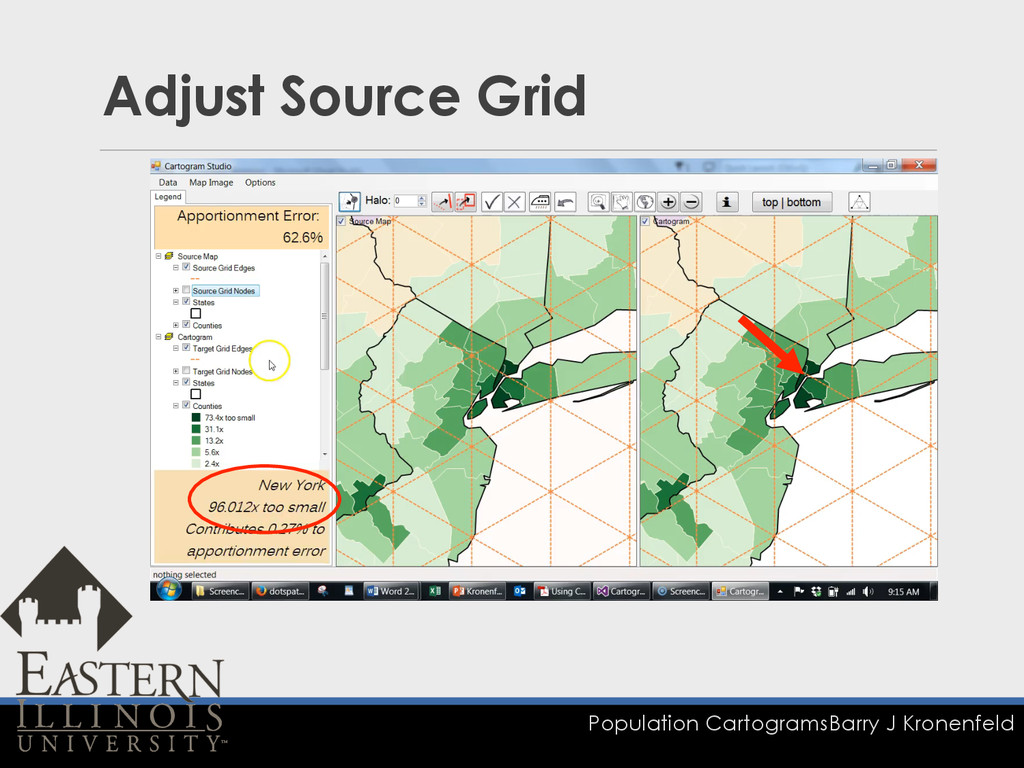
Population Cartograms Barry J Kronenfeld Adjust Source Grid
Population Cartograms Barry J Kronenfeld Adjust Source Grid
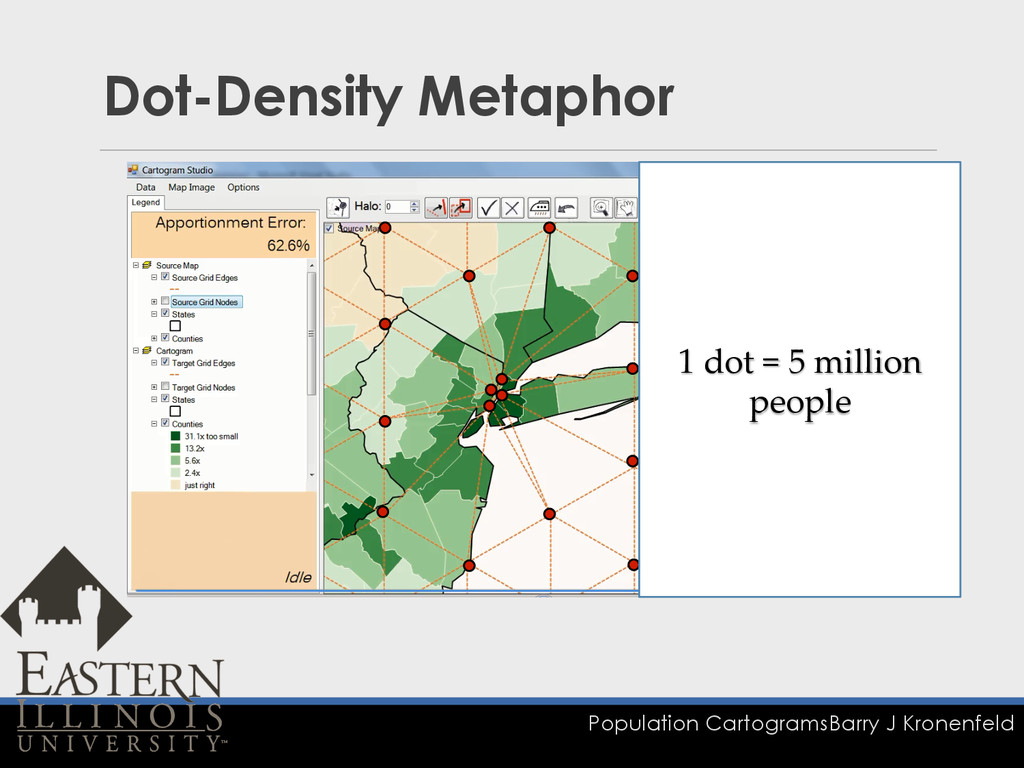
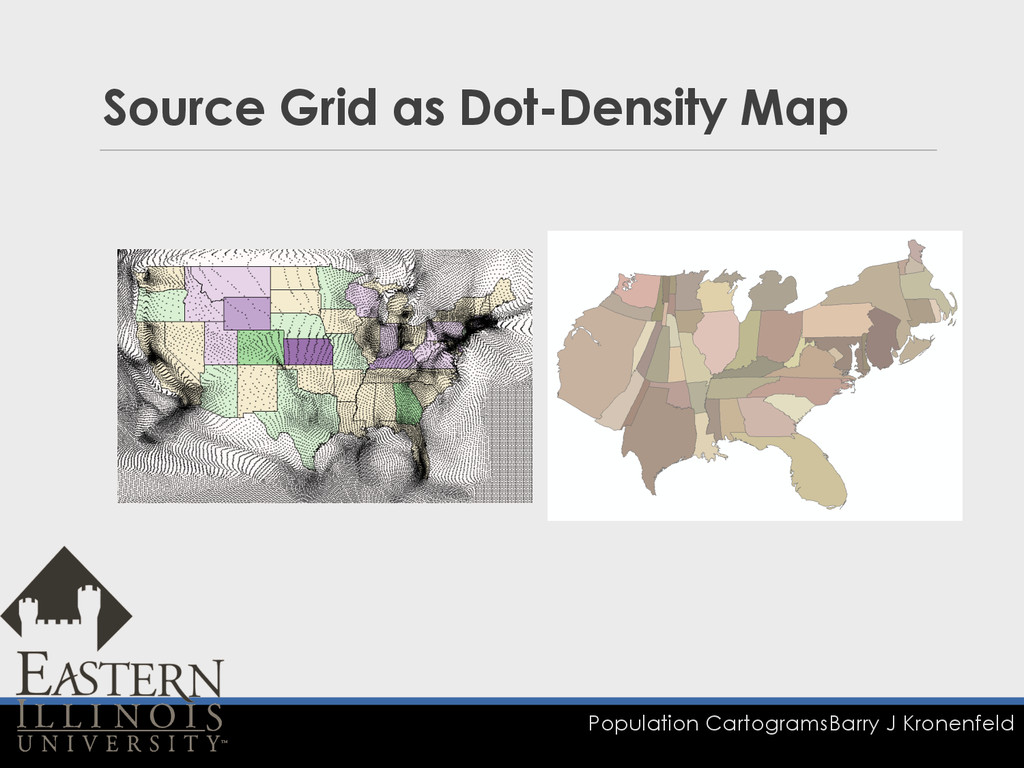
Population Cartograms Barry J Kronenfeld Dot-Density Metaphor 1 dot =
5 million people
Population Cartograms Barry J Kronenfeld Adjustment Tools q Rectangle Transform
Tool q Line Transform Tool q Smudge Tool
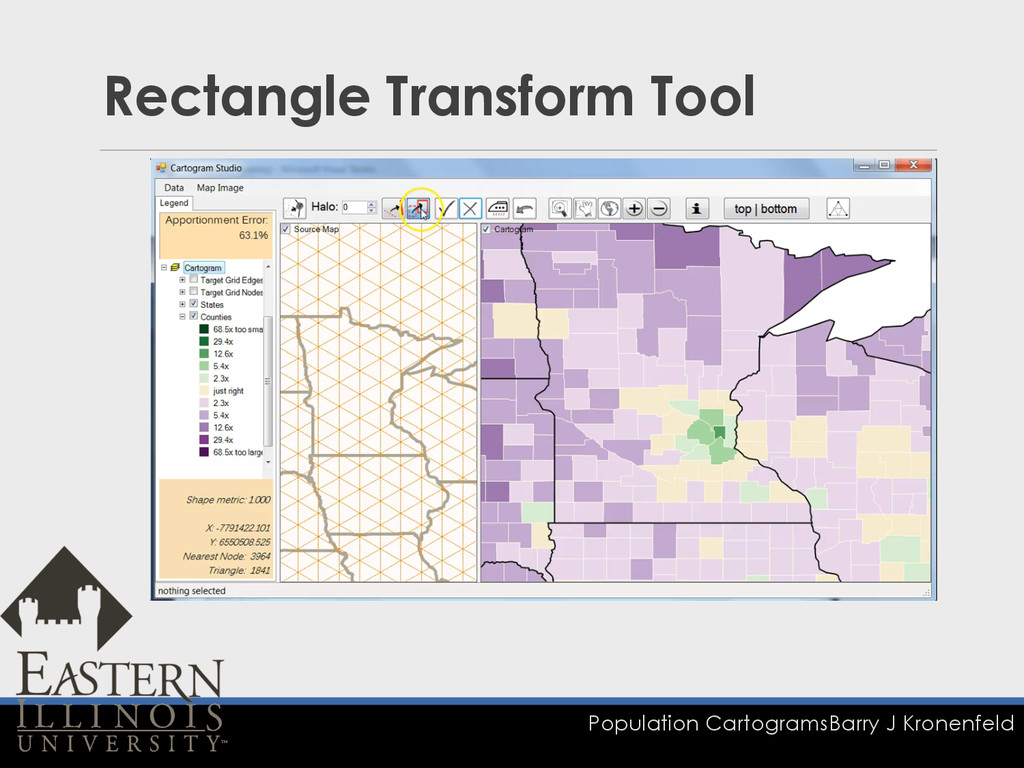
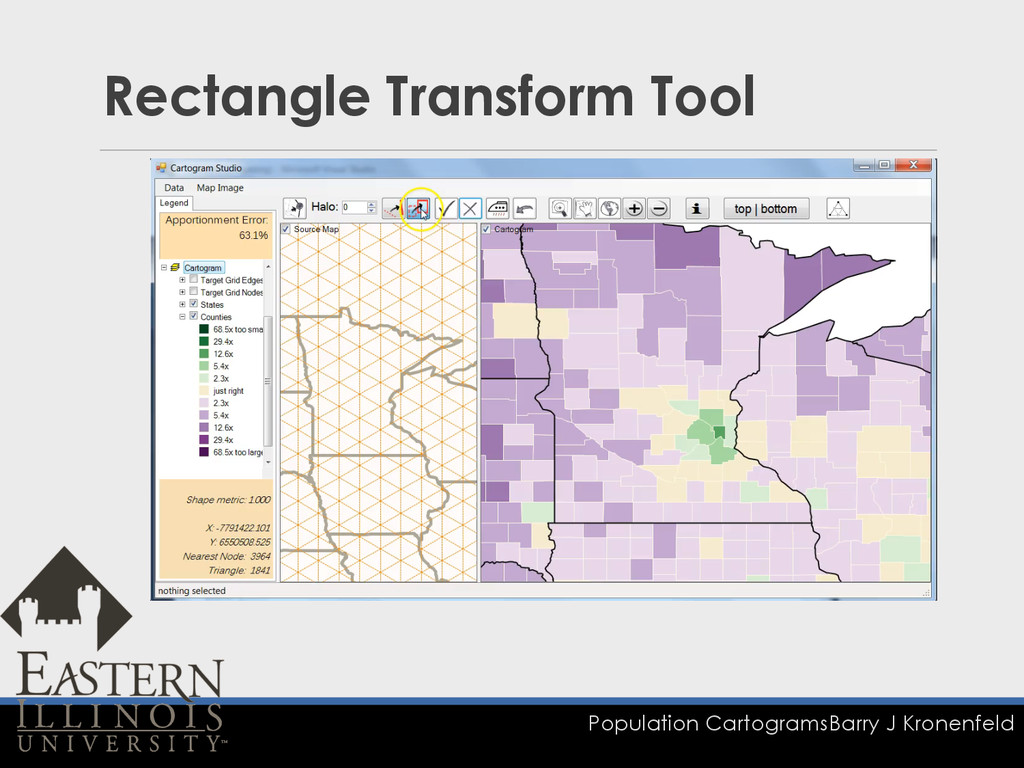
Population Cartograms Barry J Kronenfeld Rectangle Transform Tool
Population Cartograms Barry J Kronenfeld Rectangle Transform Tool
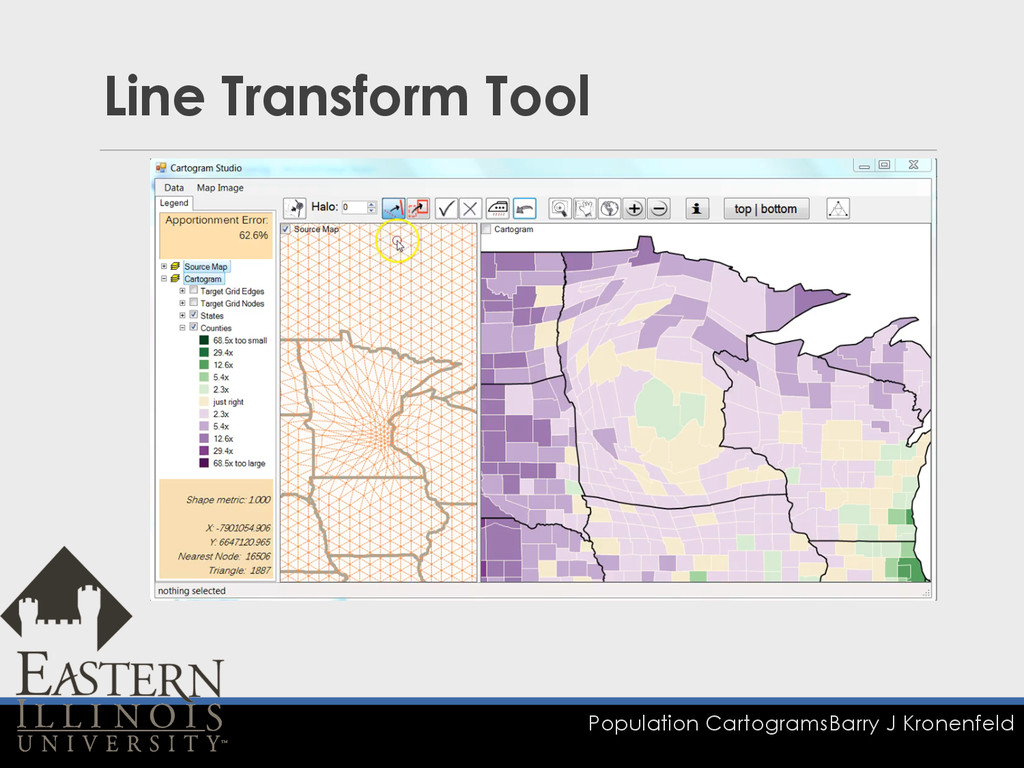
Population Cartograms Barry J Kronenfeld Line Transform Tool
Population Cartograms Barry J Kronenfeld Line Transform Tool
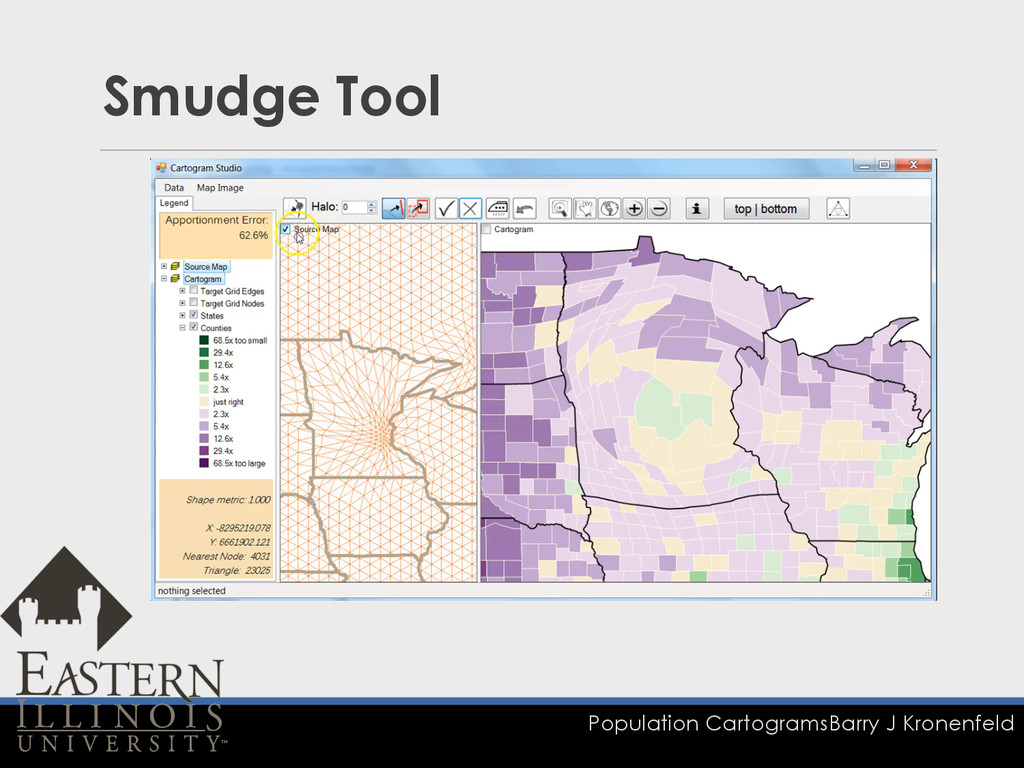
Population Cartograms Barry J Kronenfeld Smudge Tool
Population Cartograms Barry J Kronenfeld Smudge Tool
2. USA States Population Cartogram
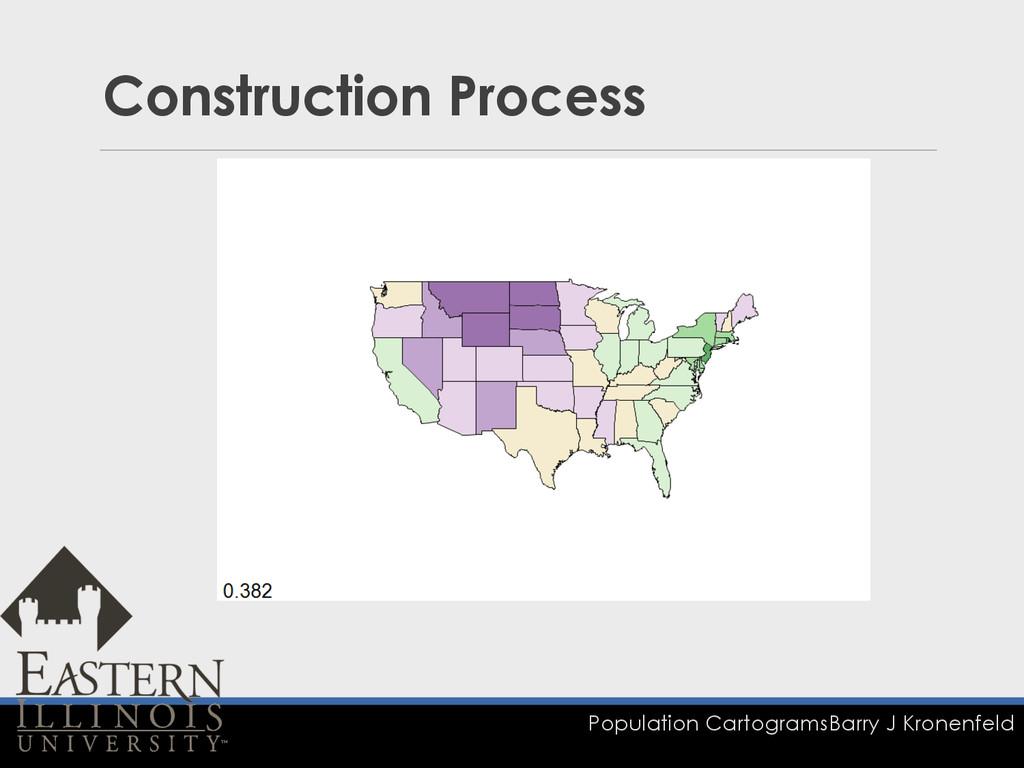
Population Cartograms Barry J Kronenfeld Construction Process
Population Cartograms Barry J Kronenfeld Construction Process
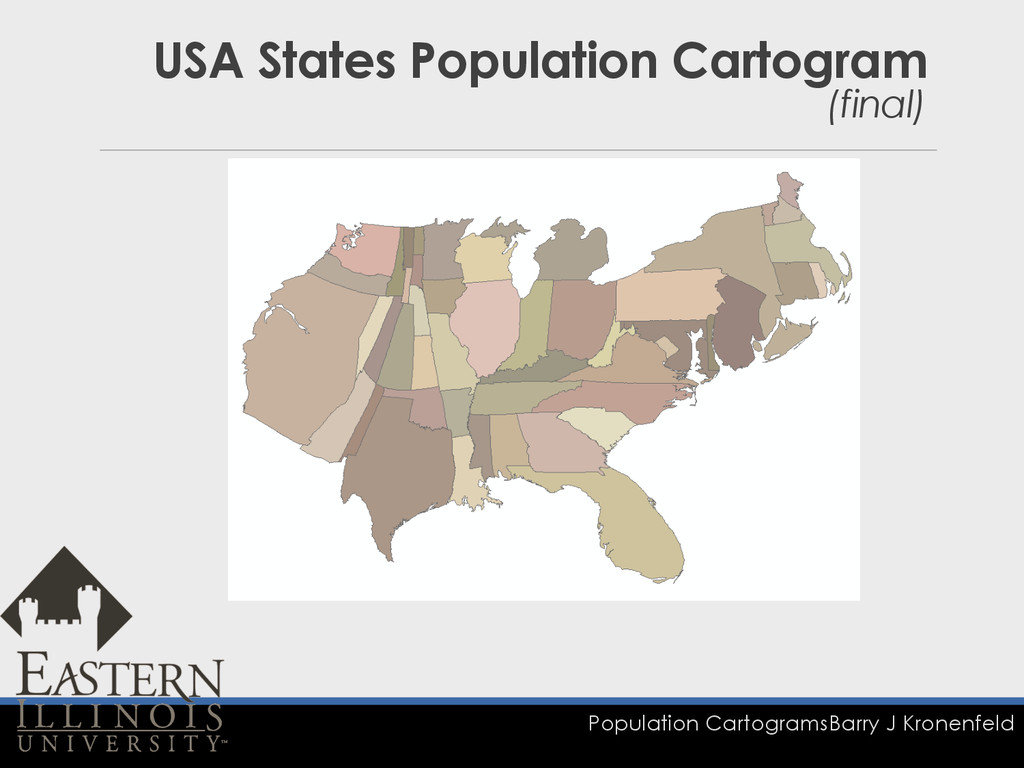
Population Cartograms Barry J Kronenfeld USA States Population Cartogram (final)
Population Cartograms Barry J Kronenfeld Source Grid as Dot-Density Map
3. Assessment
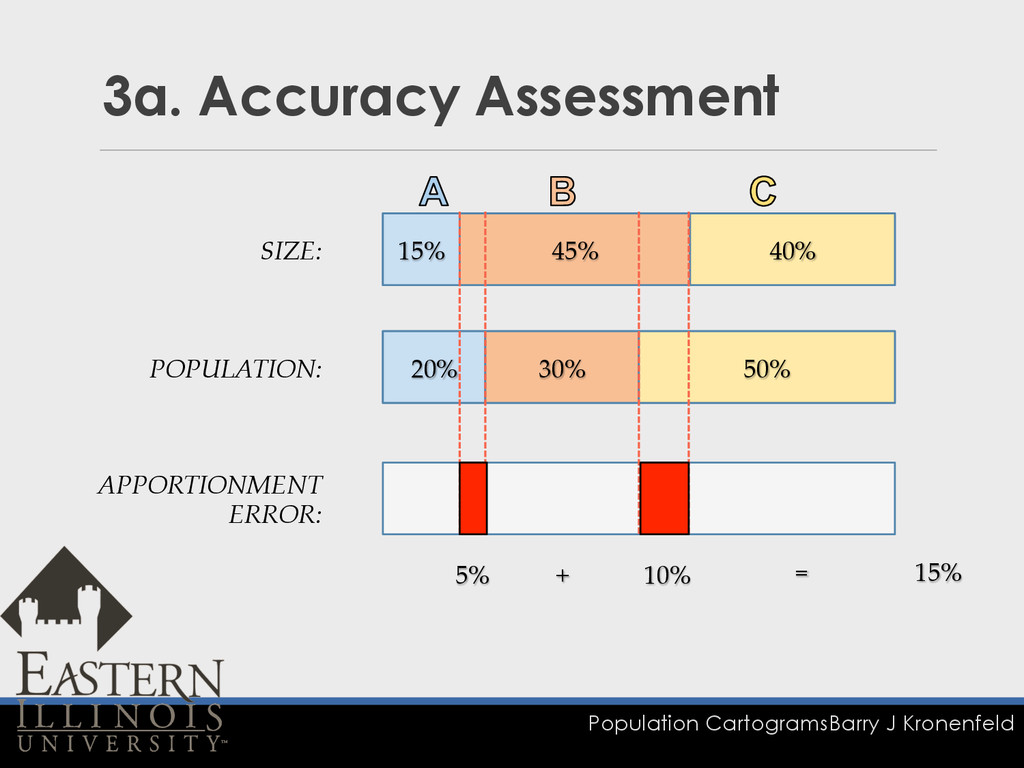
Population Cartograms Barry J Kronenfeld 3a. Accuracy Assessment 20% 30%
50% 15% 45% 40% POPULATION: SIZE: APPORTIONMENT ERROR: 5% 10% + = 15%
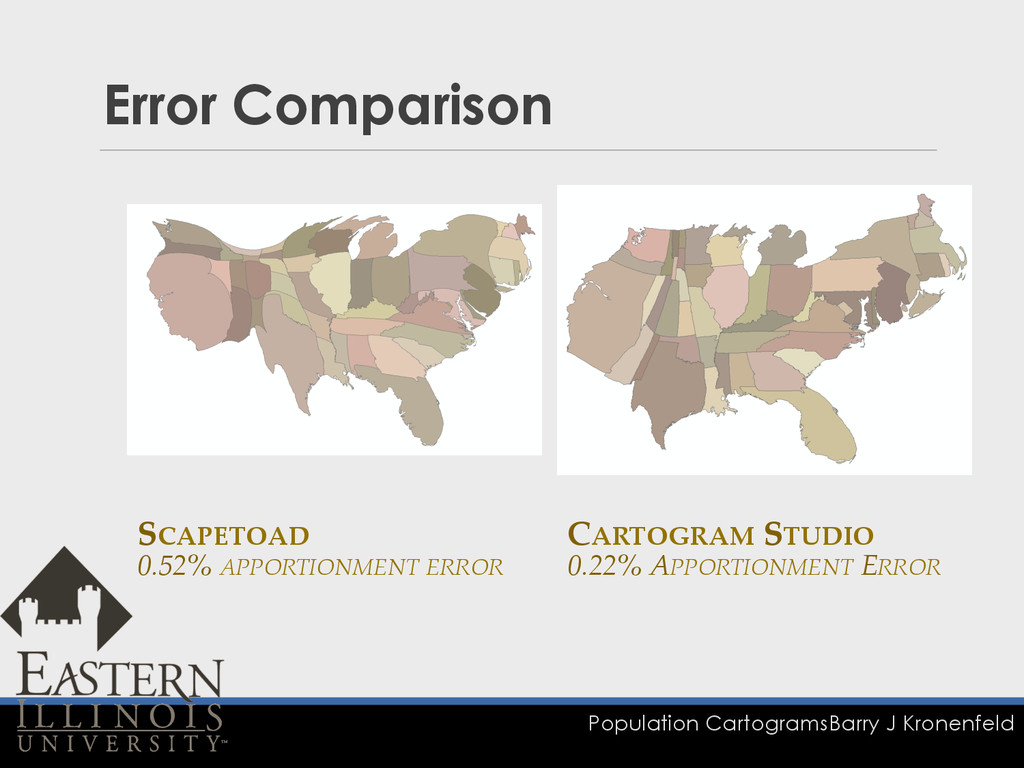
Population Cartograms Barry J Kronenfeld Error Comparison SCAPETOAD 0.52%
APPORTIONMENT ERROR CARTOGRAM STUDIO 0.22% APPORTIONMENT ERROR
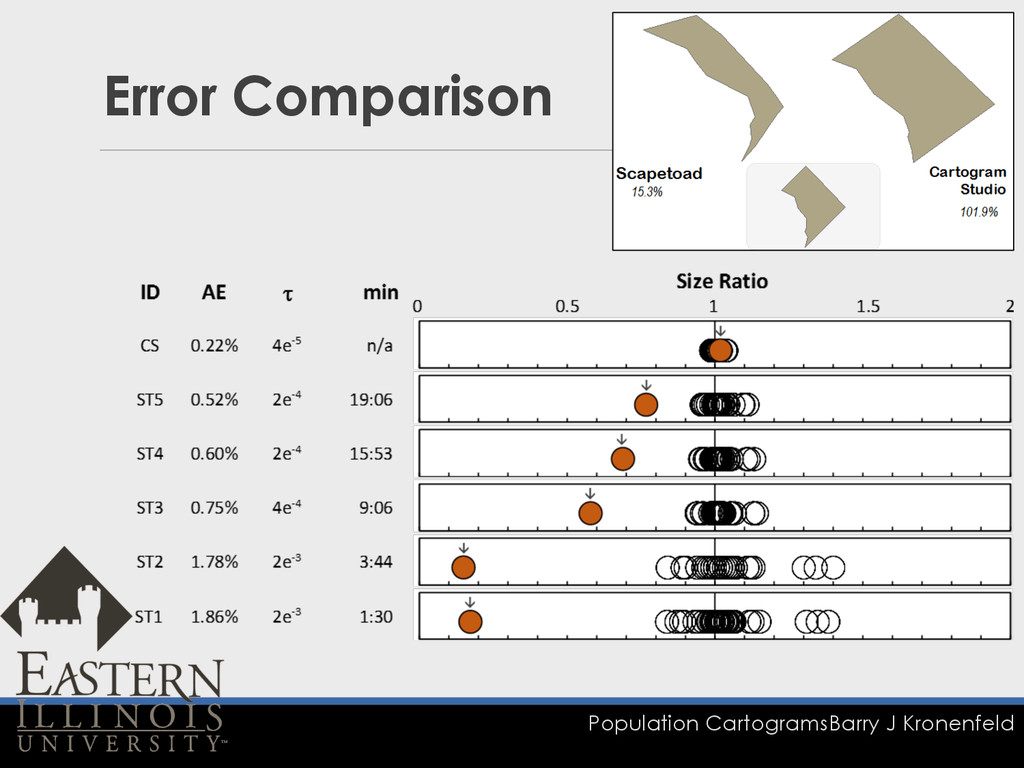
Population Cartograms Barry J Kronenfeld Error Comparison
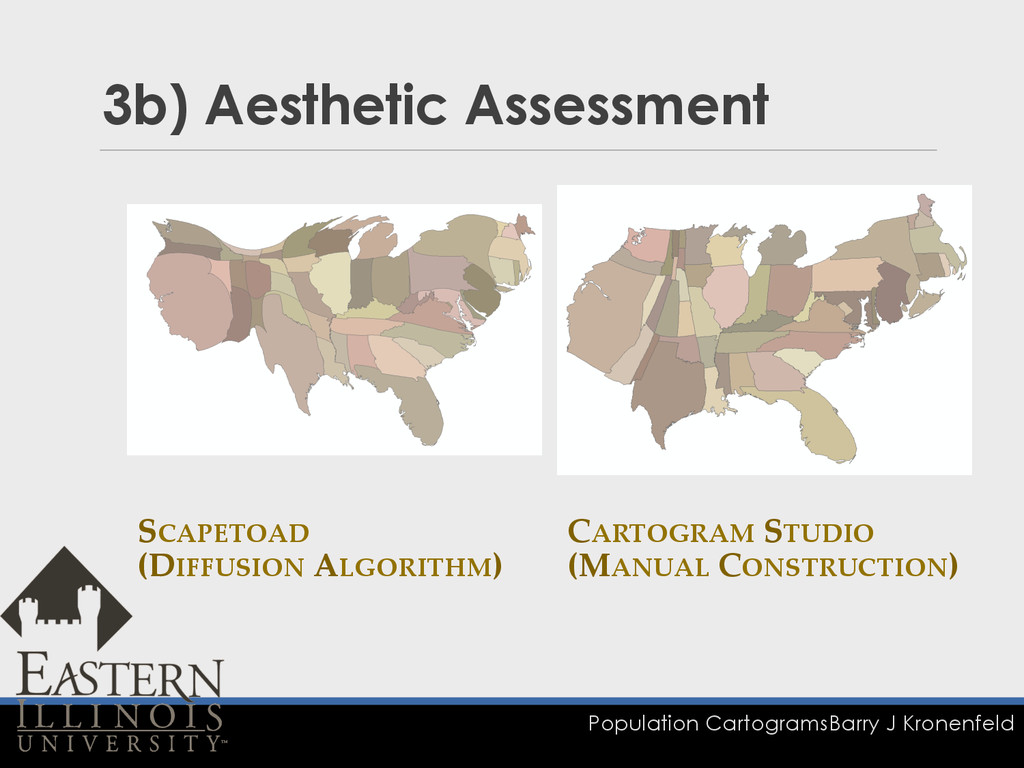
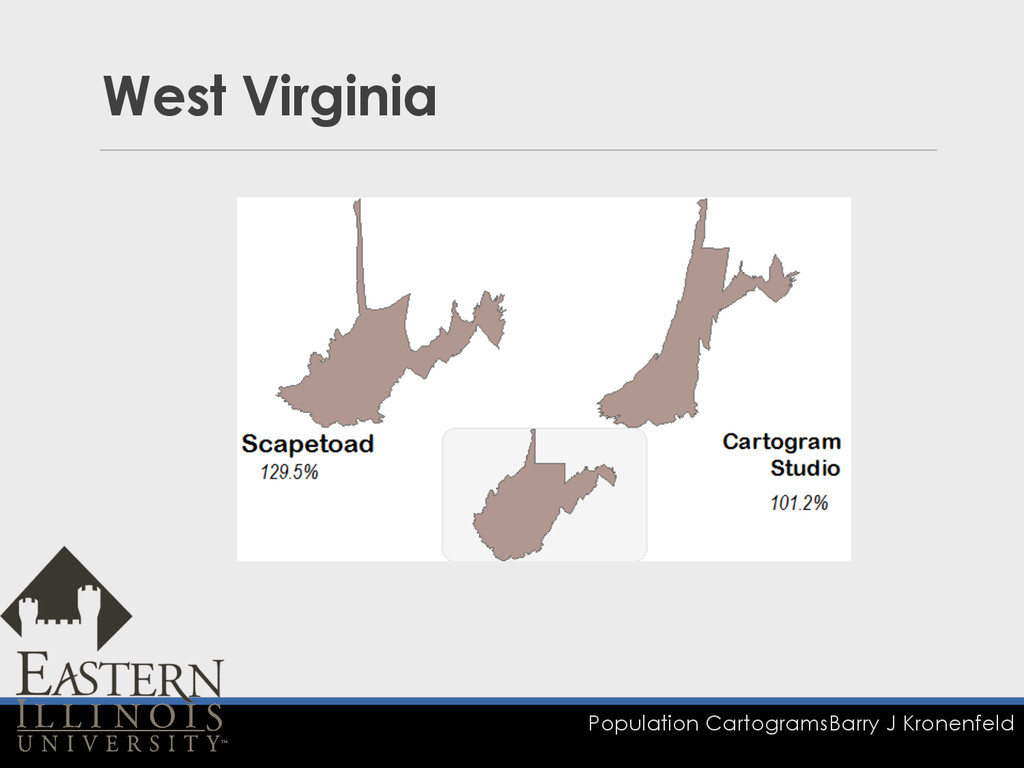
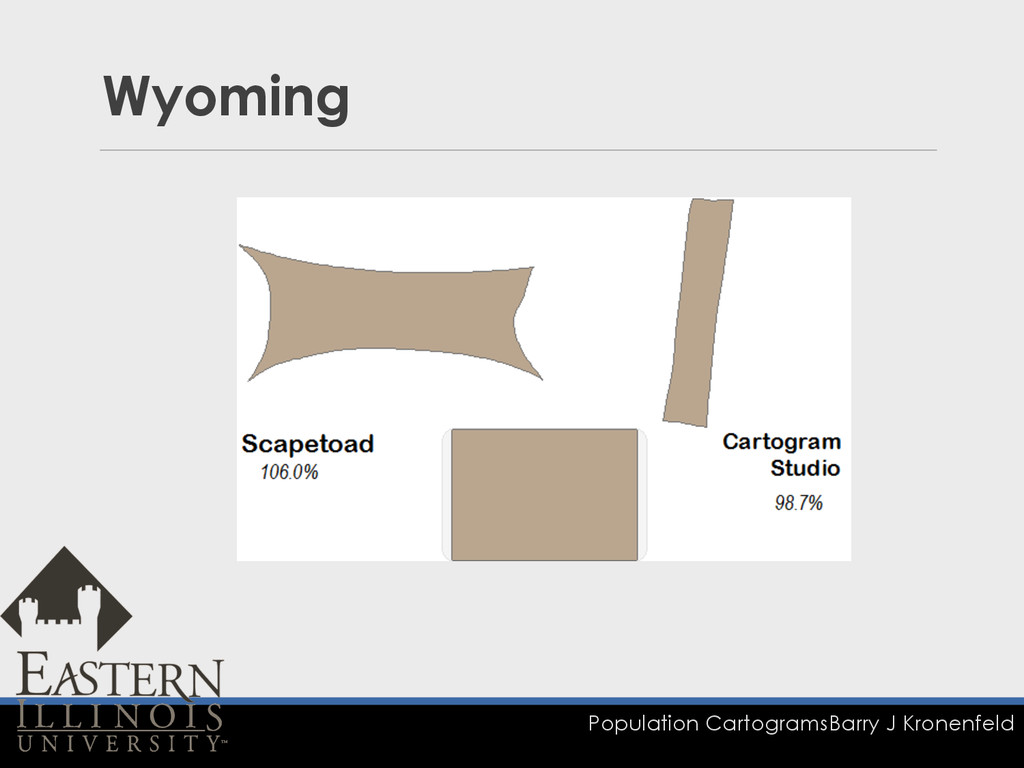
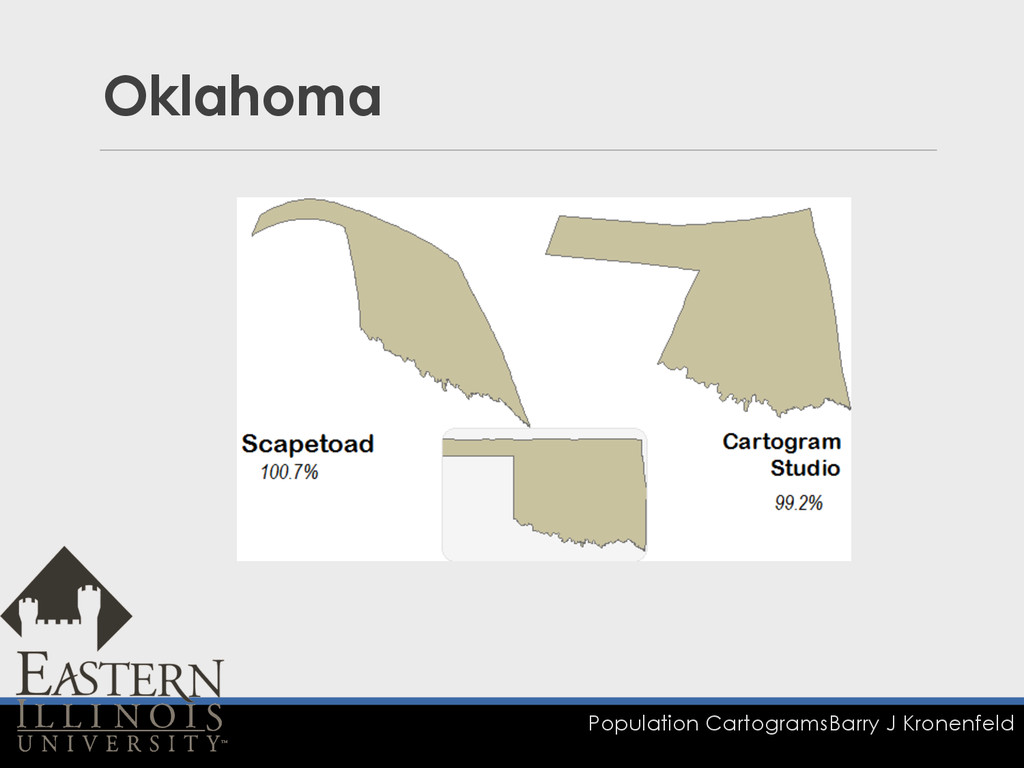
Population Cartograms Barry J Kronenfeld 3b) Aesthetic Assessment SCAPETOAD
(DIFFUSION ALGORITHM) CARTOGRAM STUDIO (MANUAL CONSTRUCTION)
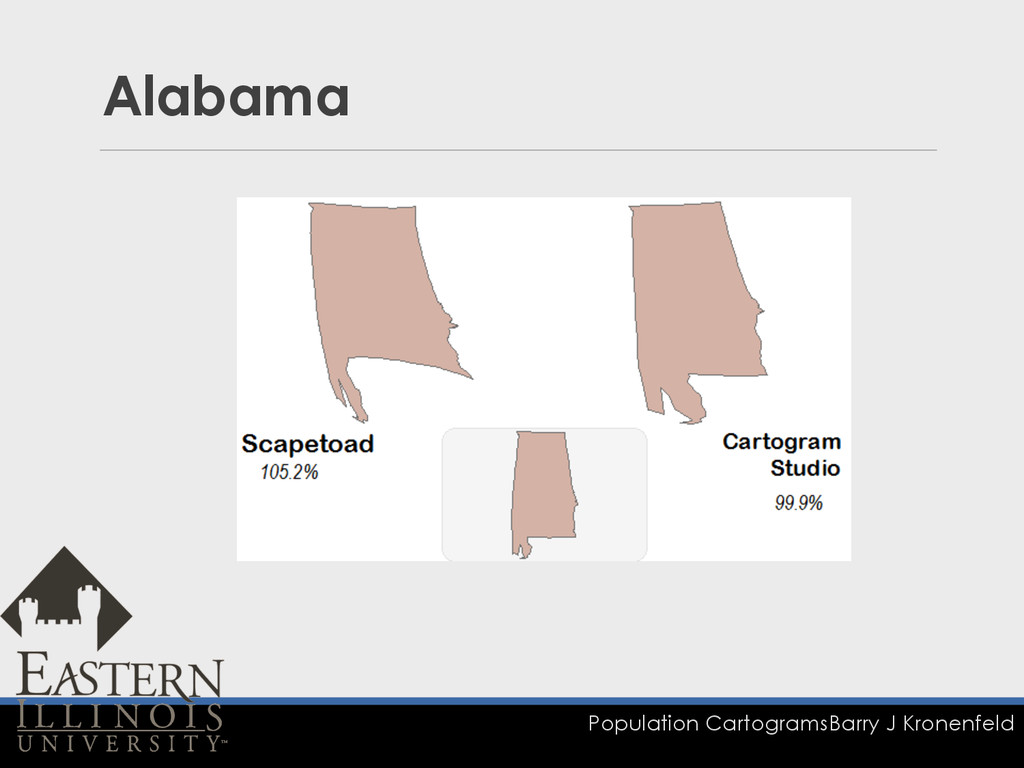
Population Cartograms Barry J Kronenfeld Alabama
Population Cartograms Barry J Kronenfeld West Virginia
Population Cartograms Barry J Kronenfeld Wyoming
Population Cartograms Barry J Kronenfeld Oklahoma
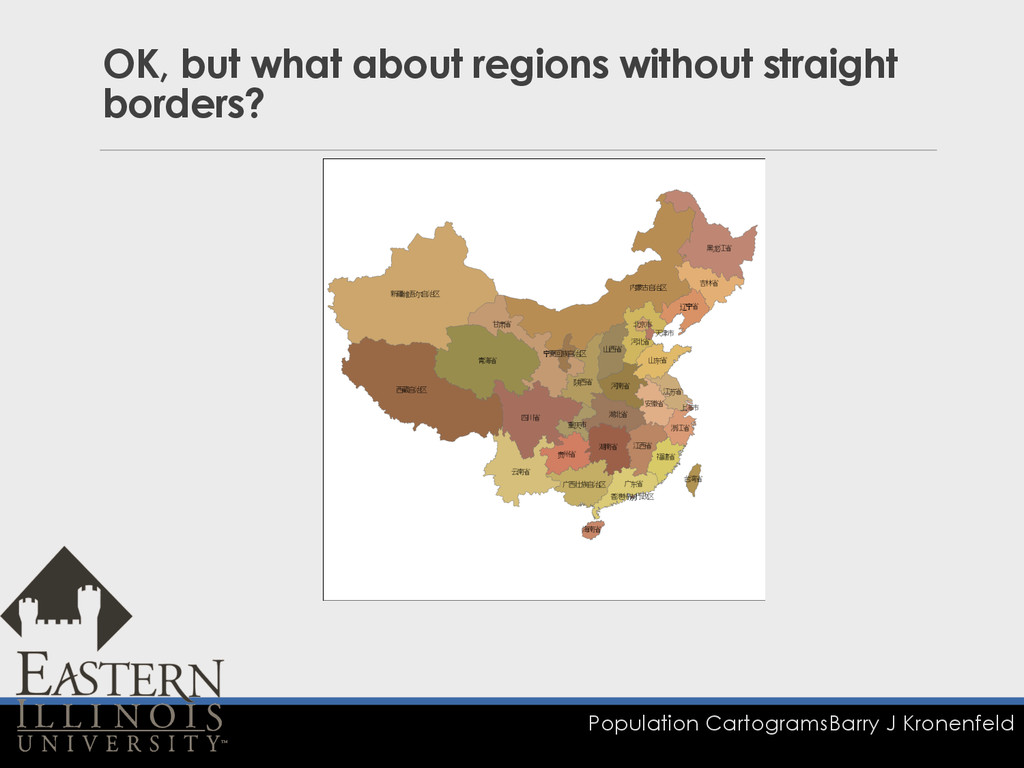
Population Cartograms Barry J Kronenfeld OK, but what about regions
without straight borders?
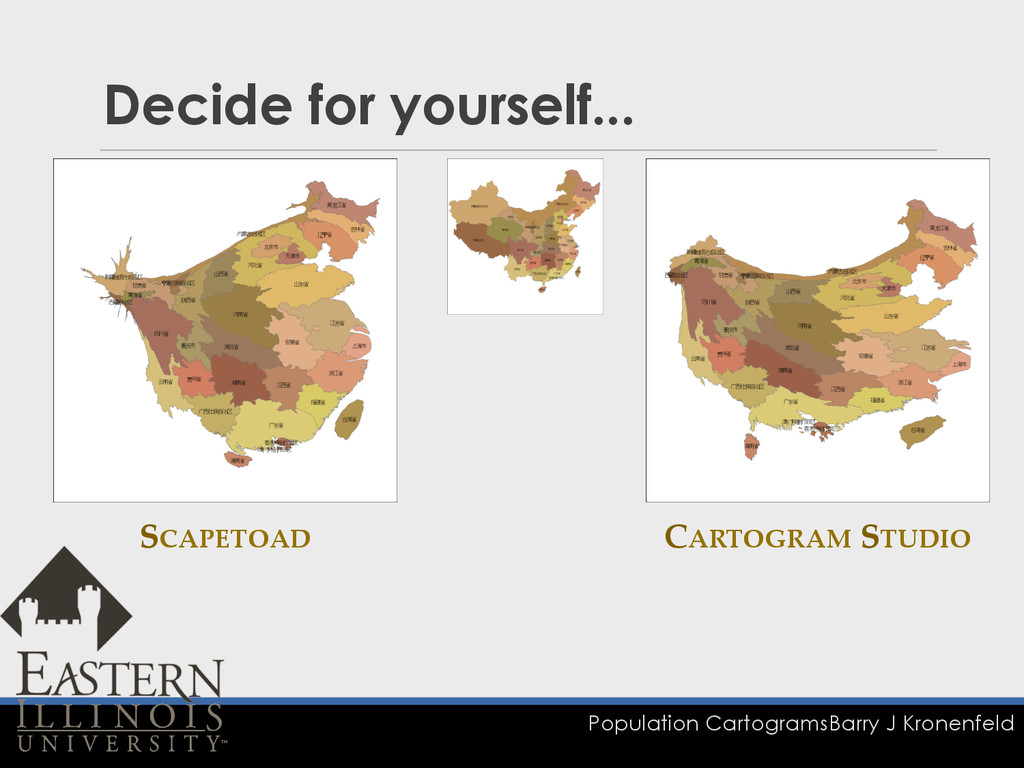
Population Cartograms Barry J Kronenfeld Decide for yourself... SCAPETOAD CARTOGRAM
STUDIO
Population Cartograms Barry J Kronenfeld 3c. Feasibility q Work in
Progress r personal results r classroom experience
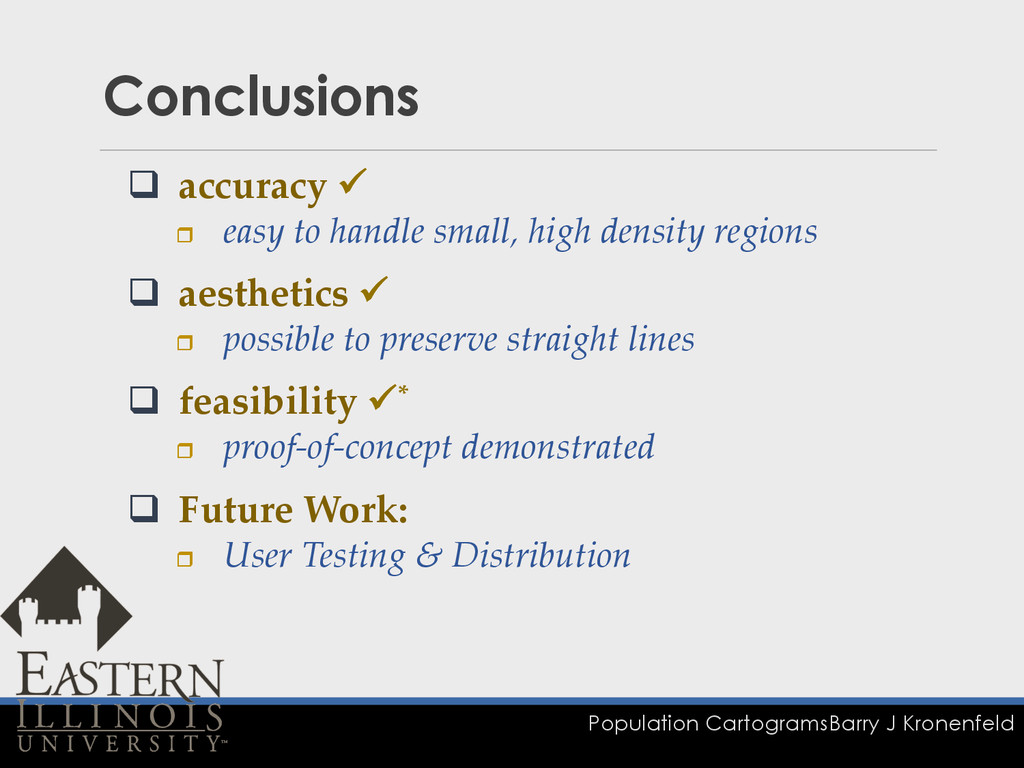
Population Cartograms Barry J Kronenfeld Conclusions q accuracy ! r
easy to handle small, high density regions q aesthetics ! r possible to preserve straight lines q feasibility !* r proof-‐‑of-‐‑concept demonstrated q Future Work: r User Testing & Distribution
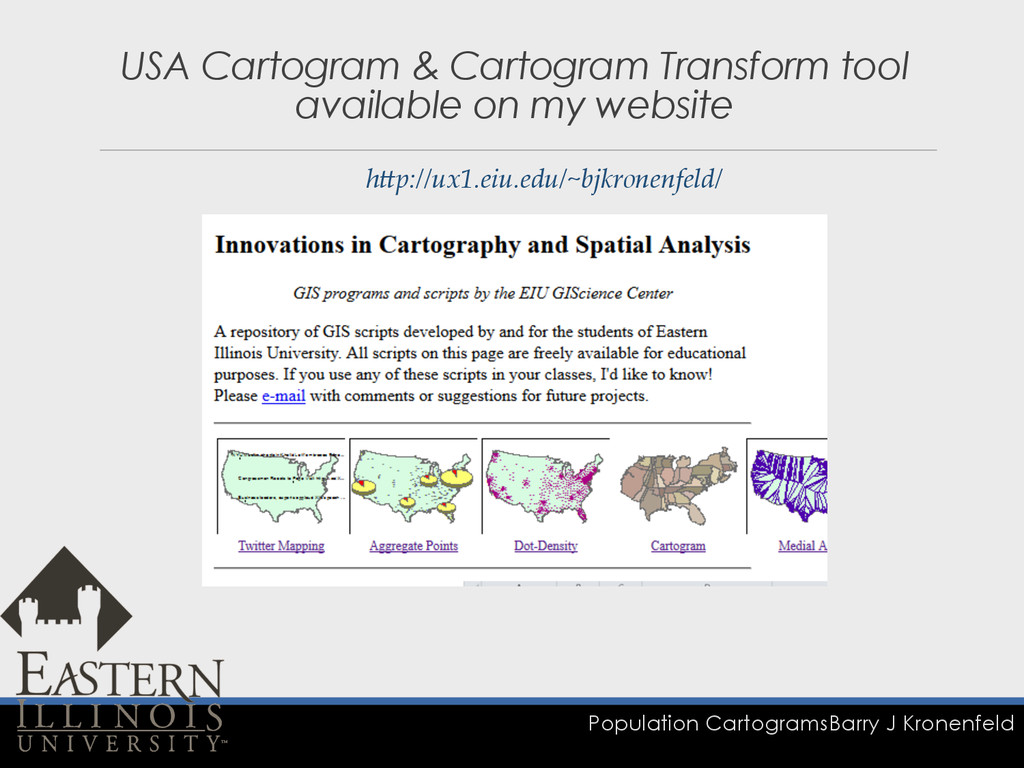
Population Cartograms Barry J Kronenfeld USA Cartogram & Cartogram Transform
tool available on my website hQp://ux1.eiu.edu/~bjkronenfeld/
Population Cartograms Barry J Kronenfeld Cartogram Transform (ArcGIS Tool) Cartogram
as Projection
Population Cartograms Barry J Kronenfeld Mississippi & Columbia Rivers
Population Cartograms Barry J Kronenfeld Acknowledgements q EIU Council on
Faculty Research (CFR) Grant q Software built on Dot Spatial
Population Cartograms Barry J Kronenfeld Questions?