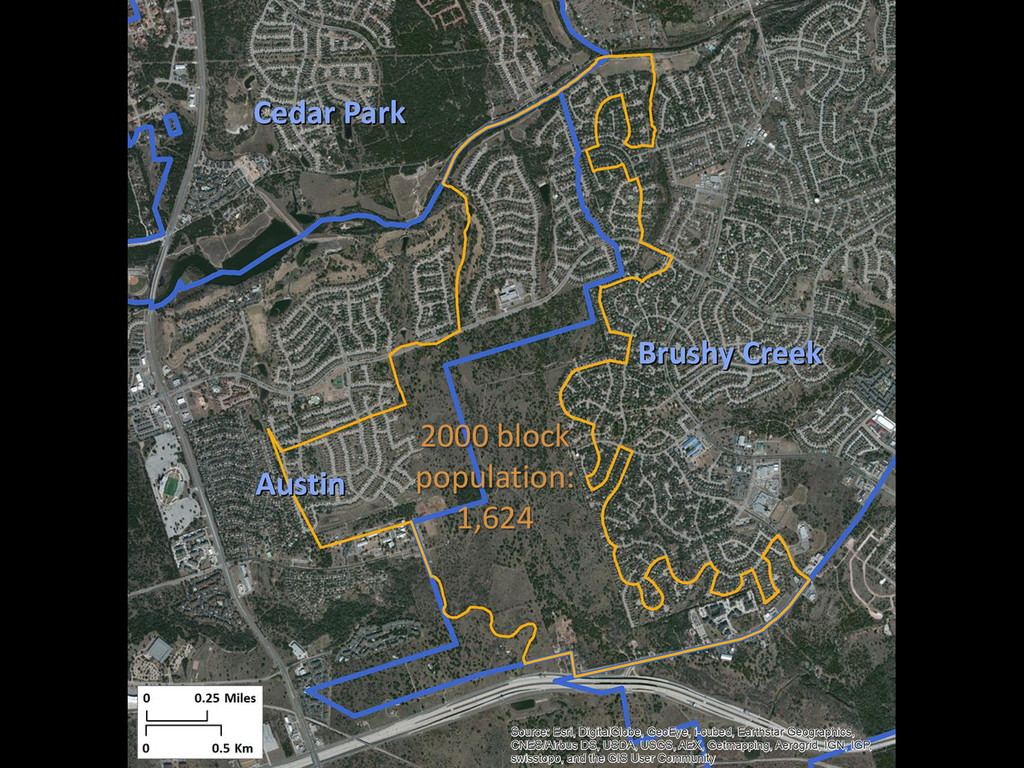
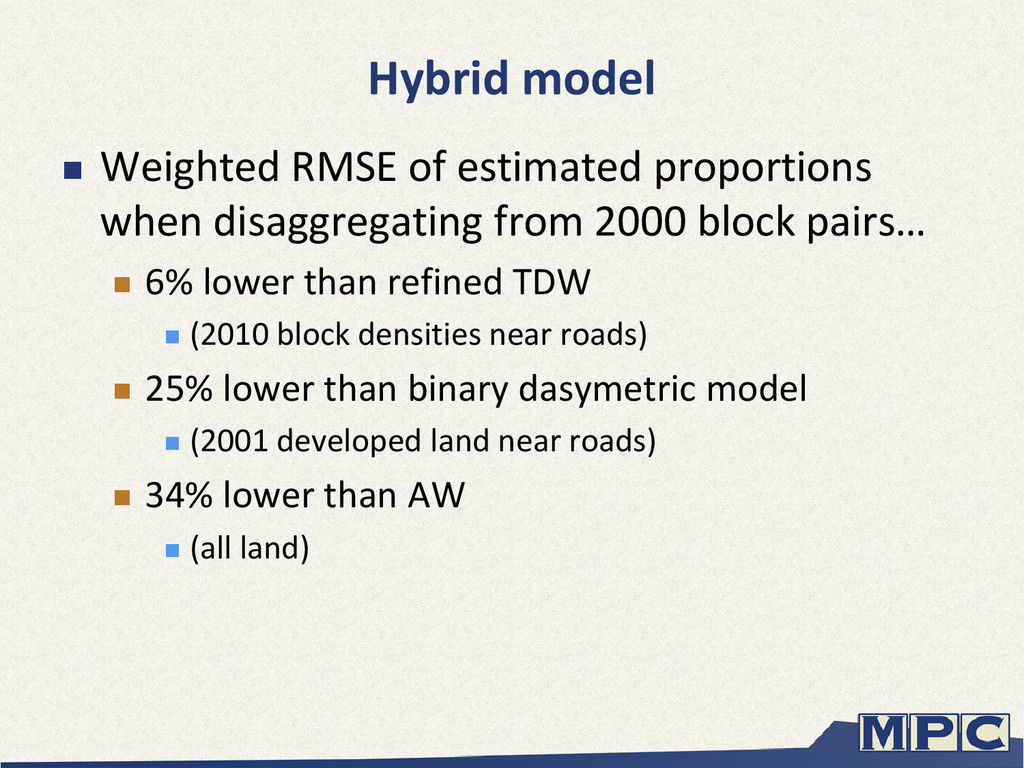
from 2000 block pairs… 6% lower than refined TDW (2010 block densities near roads) 25% lower than binary dasymetric model (2001 developed land near roads) 34% lower than AW (all land)
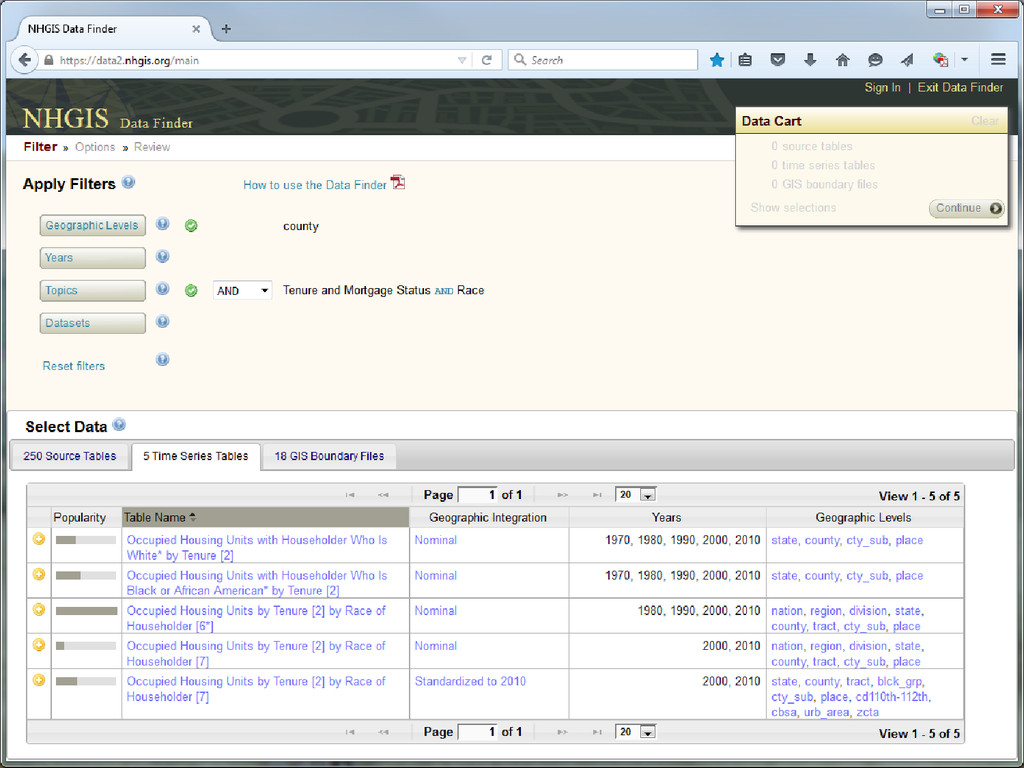
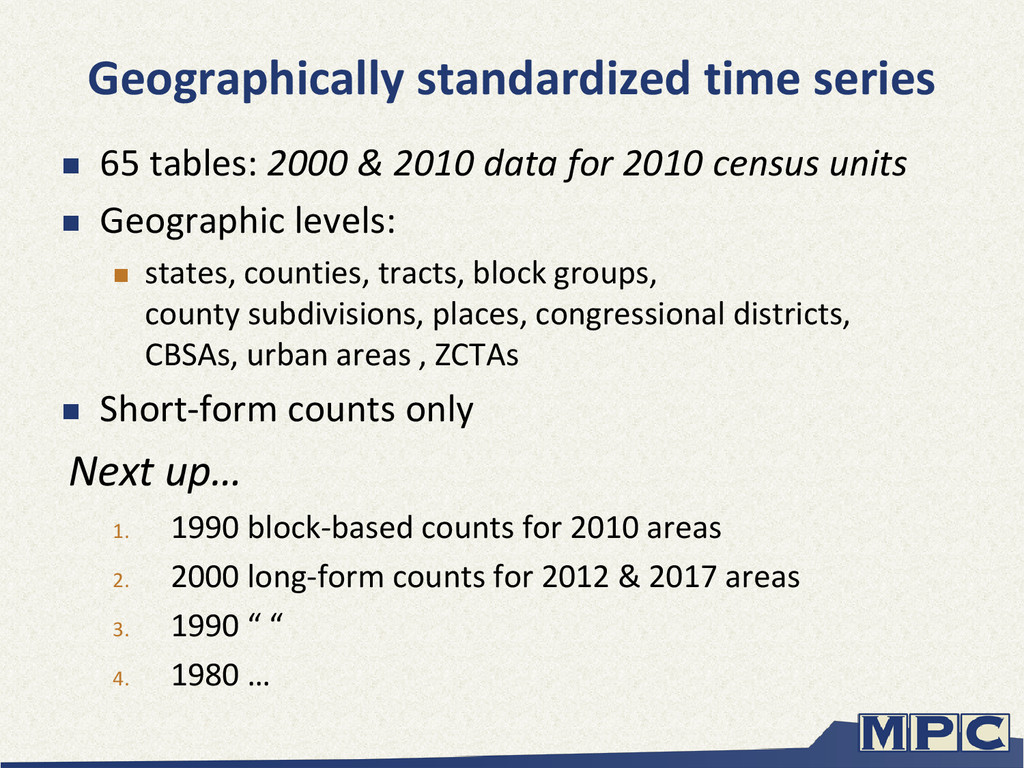
data for 2010 census units Geographic levels: states, counties, tracts, block groups, county subdivisions, places, congressional districts, CBSAs, urban areas , ZCTAs Short-form counts only Next up… 1. 1990 block-based counts for 2010 areas 2. 2000 long-form counts for 2012 & 2017 areas 3. 1990 “ “ 4. 1980 …
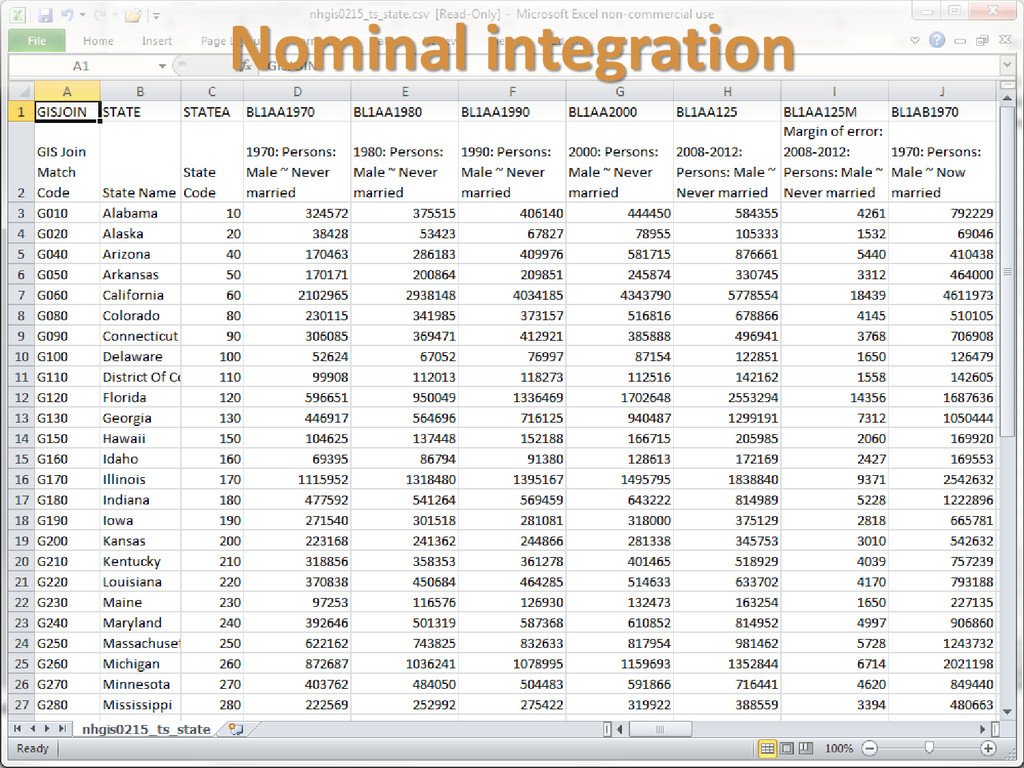
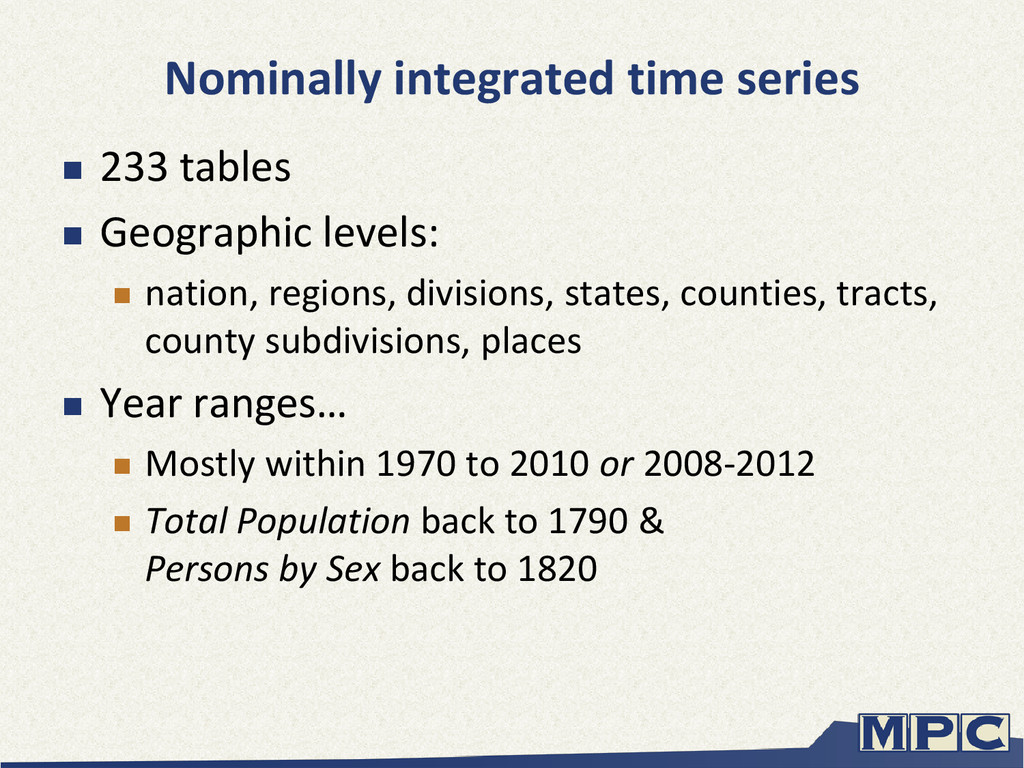
nation, regions, divisions, states, counties, tracts, county subdivisions, places Year ranges… Mostly within 1970 to 2010 or 2008-2012 Total Population back to 1790 & Persons by Sex back to 1820
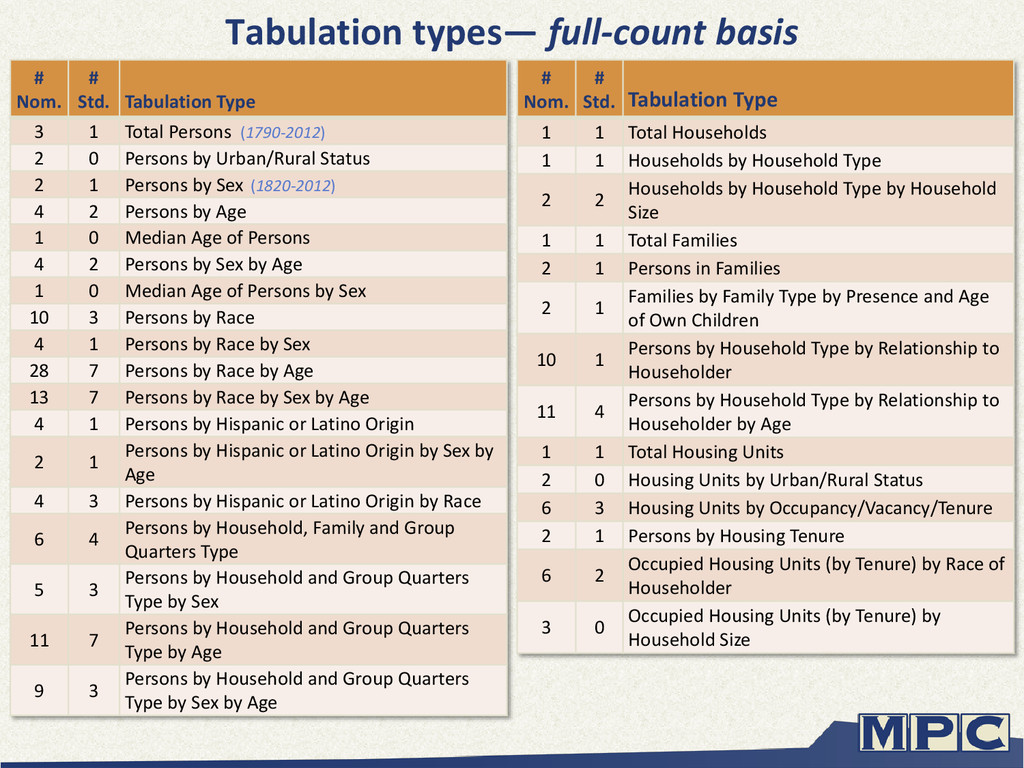
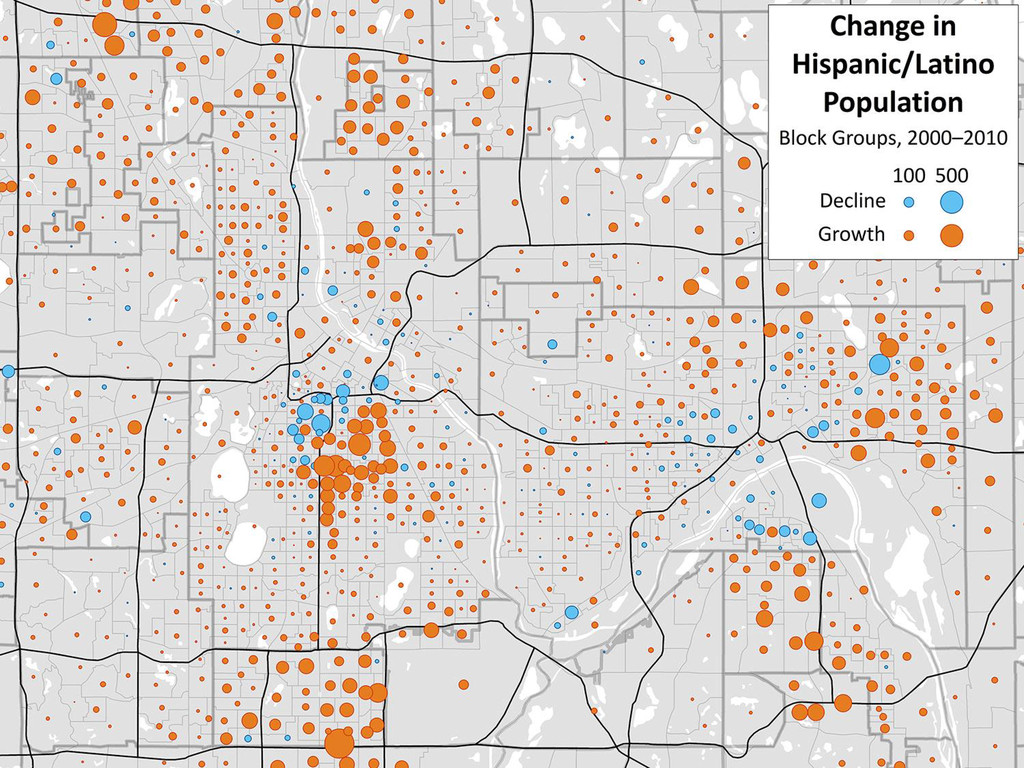
1 1 Households by Household Type 2 2 Households by Household Type by Household Size 1 1 Total Families 2 1 Persons in Families 2 1 Families by Family Type by Presence and Age of Own Children 10 1 Persons by Household Type by Relationship to Householder 11 4 Persons by Household Type by Relationship to Householder by Age 1 1 Total Housing Units 2 0 Housing Units by Urban/Rural Status 6 3 Housing Units by Occupancy/Vacancy/Tenure 2 1 Persons by Housing Tenure 6 2 Occupied Housing Units (by Tenure) by Race of Householder 3 0 Occupied Housing Units (by Tenure) by Household Size # Nom. # Std. Tabulation Type 3 1 Total Persons (1790-2012) 2 0 Persons by Urban/Rural Status 2 1 Persons by Sex (1820-2012) 4 2 Persons by Age 1 0 Median Age of Persons 4 2 Persons by Sex by Age 1 0 Median Age of Persons by Sex 10 3 Persons by Race 4 1 Persons by Race by Sex 28 7 Persons by Race by Age 13 7 Persons by Race by Sex by Age 4 1 Persons by Hispanic or Latino Origin 2 1 Persons by Hispanic or Latino Origin by Sex by Age 4 3 Persons by Hispanic or Latino Origin by Race 6 4 Persons by Household, Family and Group Quarters Type 5 3 Persons by Household and Group Quarters Type by Sex 11 7 Persons by Household and Group Quarters Type by Age 9 3 Persons by Household and Group Quarters Type by Sex by Age Tabulation types— full-count basis
Year 1 Median Household Income in Previous Year 4 Families by Income in Previous Year 1 Median Family Income in Previous Year 1 Per Capita Income in Previous Year 1 Persons for Whom Poverty Status is Determined 2 Persons by Poverty Status in Previous Year 3 Persons by Ratio of Income to Poverty Level in Previous Year 6 Persons by Poverty Status in Previous Year by Age # Tables Tabulation Type 7 Persons by Marital Status by Sex (by Age) 1 Persons by Nativity 13 Persons by Nativity by Place of Birth 5 Persons by Educational Attainment 7 Persons by Educational Attainment by Sex (by Age) 5 Persons by Labor Force, Employment and Armed Forces Status (by Age) 6 Persons by Labor Force, Employment and Armed Forces Status by Sex (by Age) 3 Workers by Means of Transportation to Work Tabulation tables — sample basis 298 tables 49 tabulation types ~3,800 time series ~29,000 links to source variables
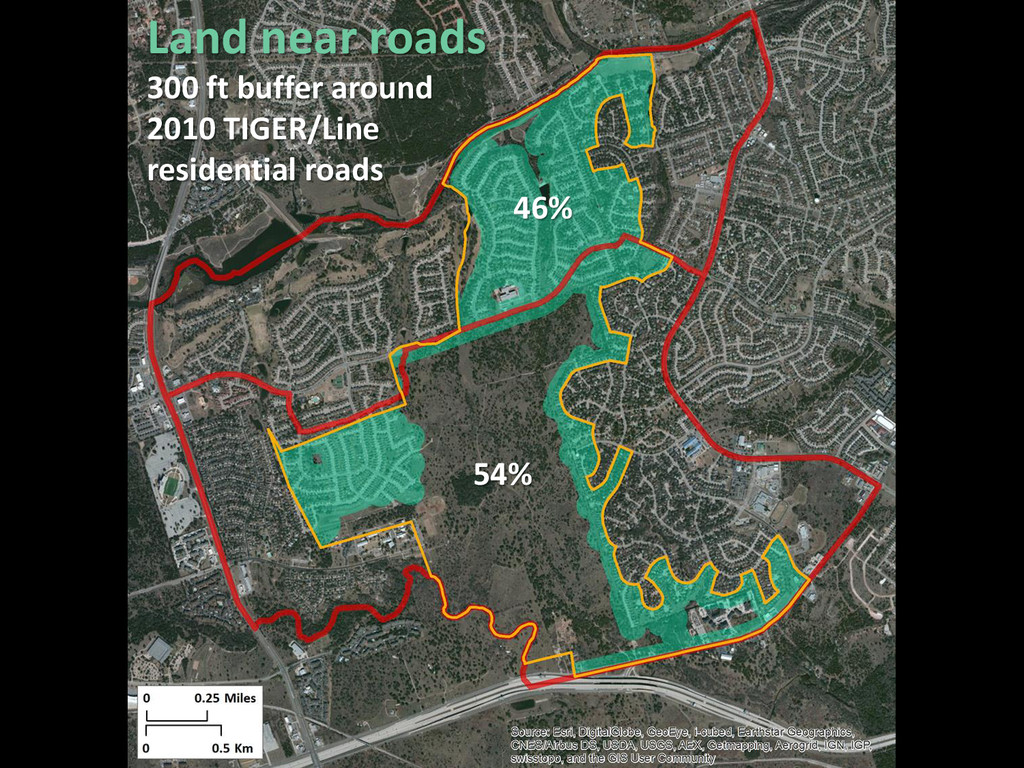
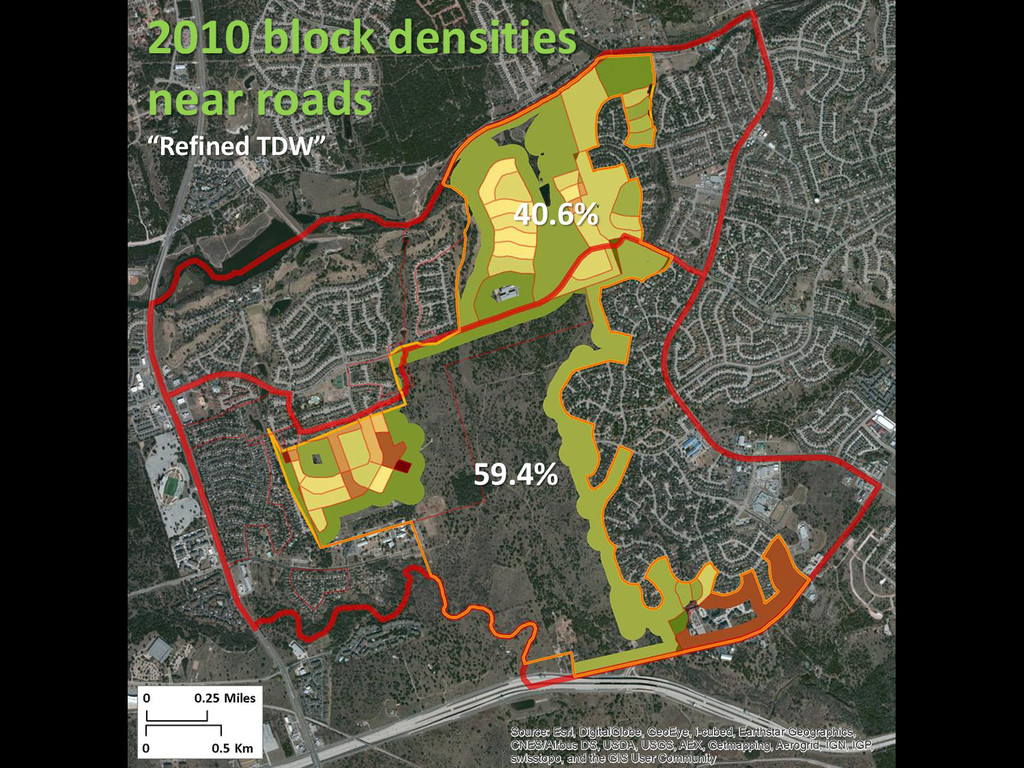
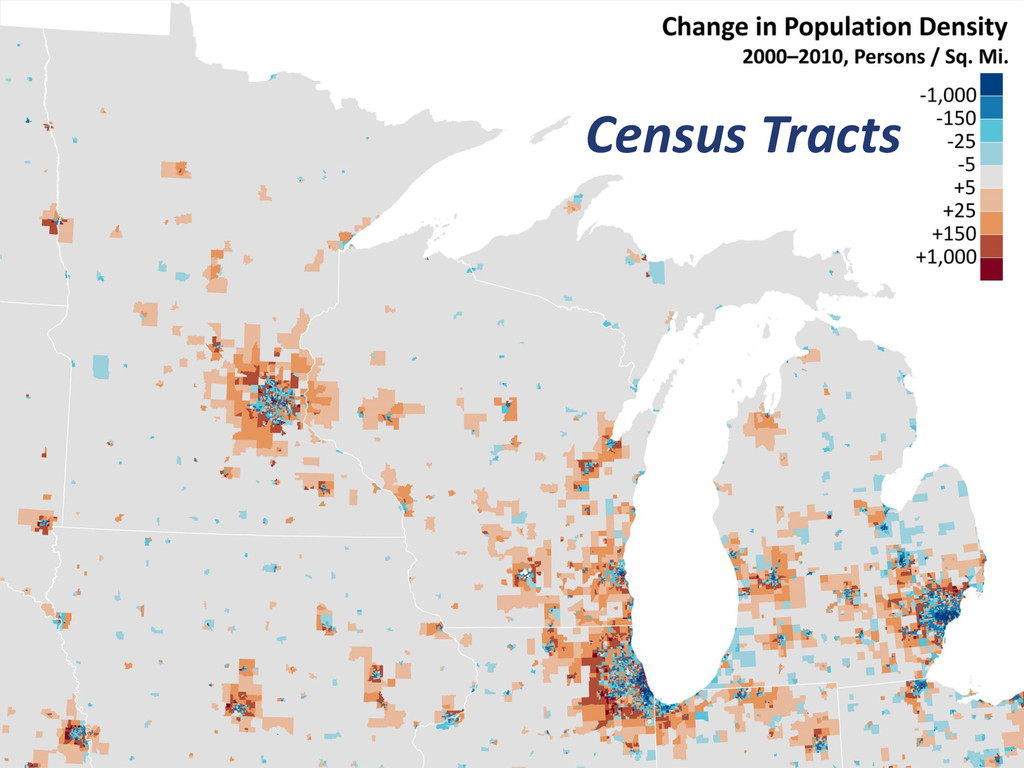
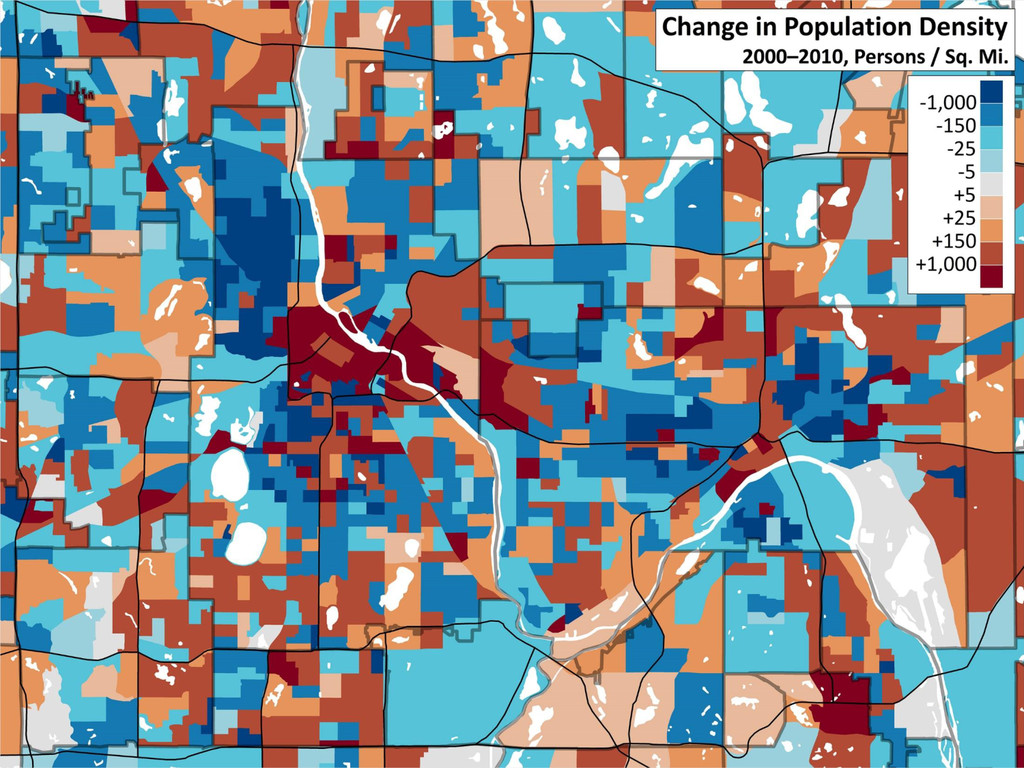
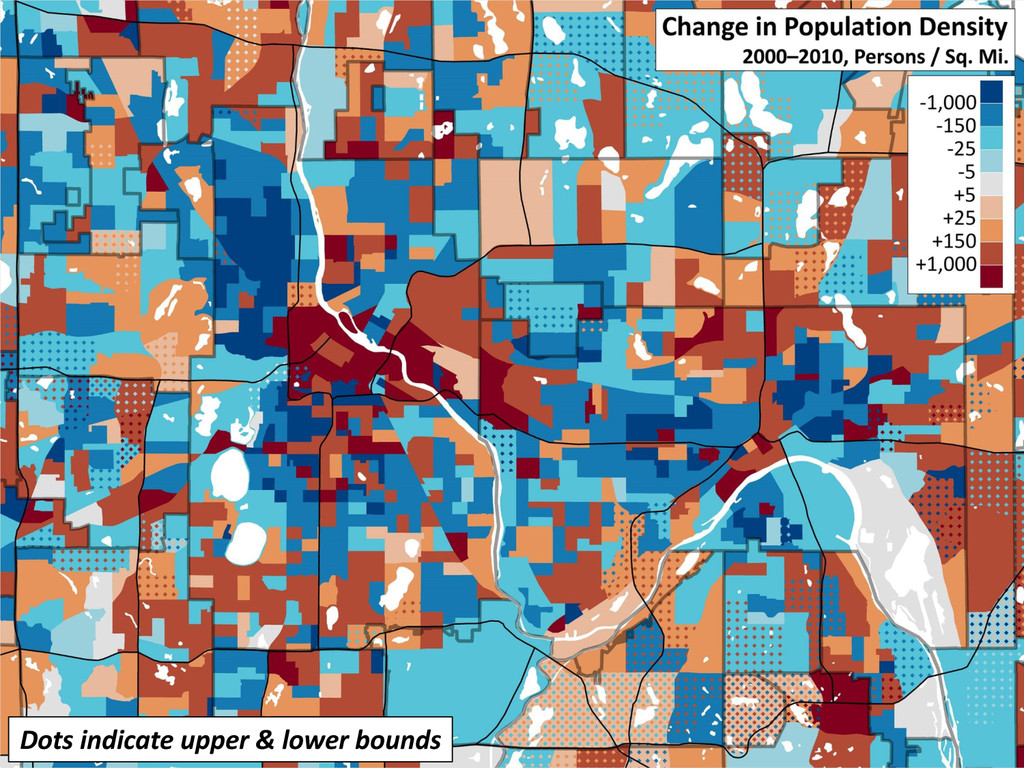
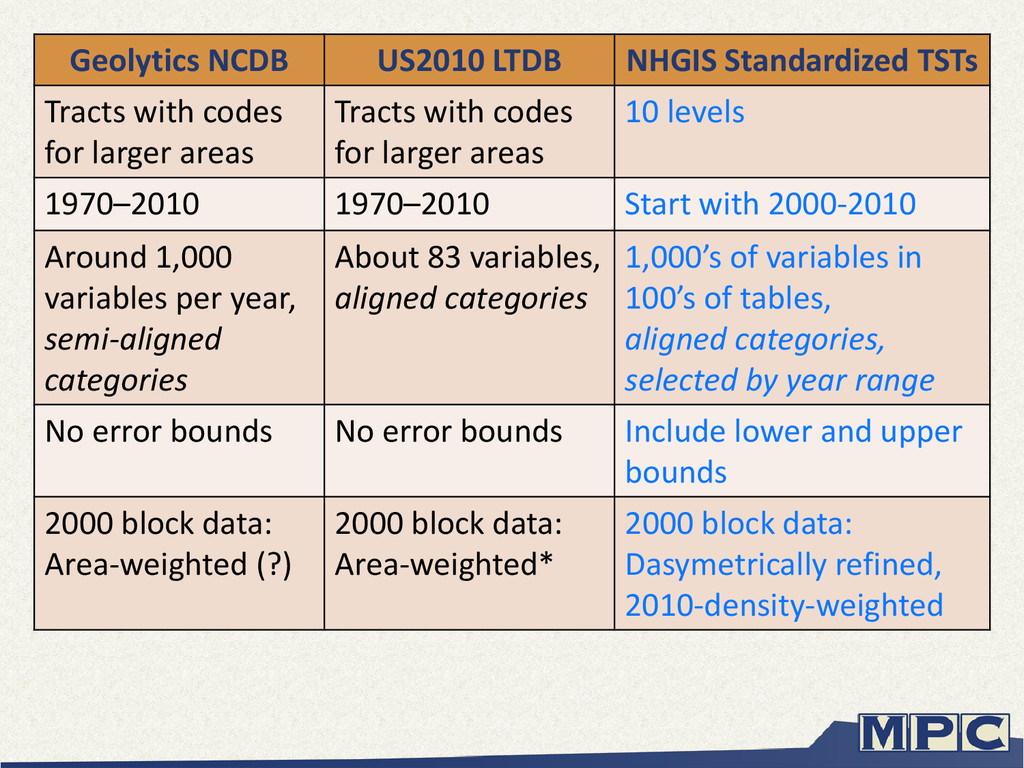
for larger areas Tracts with codes for larger areas 10 levels 1970–2010 1970–2010 Start with 2000-2010 Around 1,000 variables per year, semi-aligned categories About 83 variables, aligned categories 1,000’s of variables in 100’s of tables, aligned categories, selected by year range No error bounds No error bounds Include lower and upper bounds 2000 block data: Area-weighted (?) 2000 block data: Area-weighted* 2000 block data: Dasymetrically refined, 2010-density-weighted