Upgrade to Pro — share decks privately, control downloads, hide ads and more …

Data Mining in Mining Data: Statistical Approaches in Occupational Health Surveillance for a Mining Site

Data Mining in Mining Data: Statistical Approaches in Occupational Health Surveillance for a Mining Site

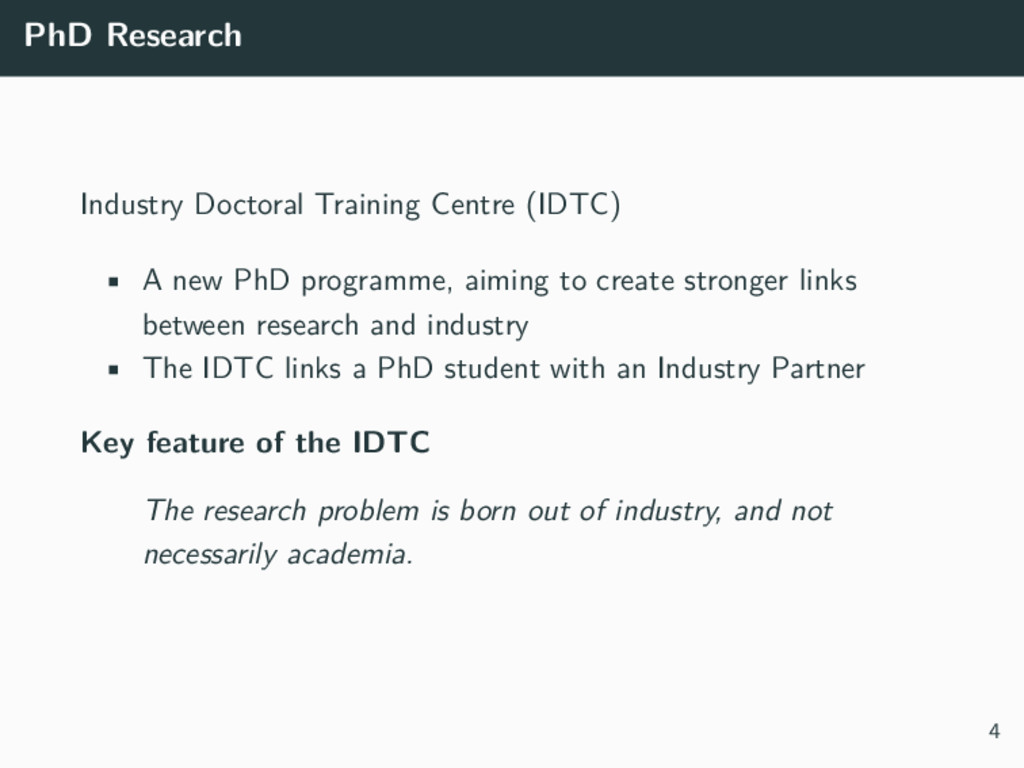
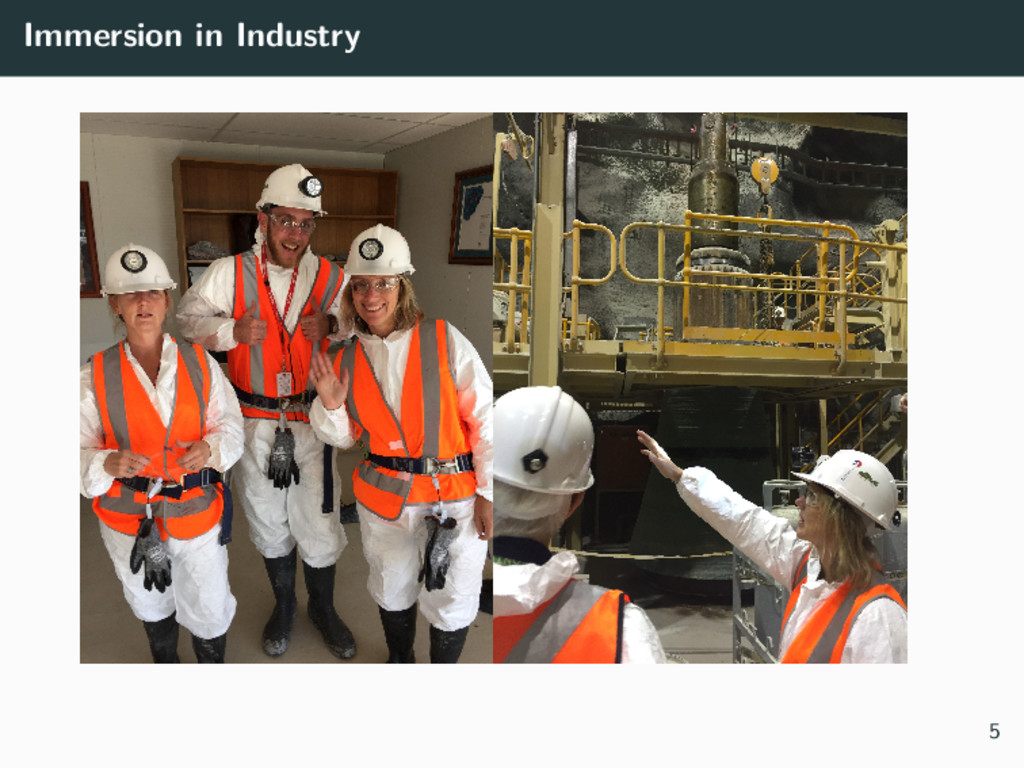
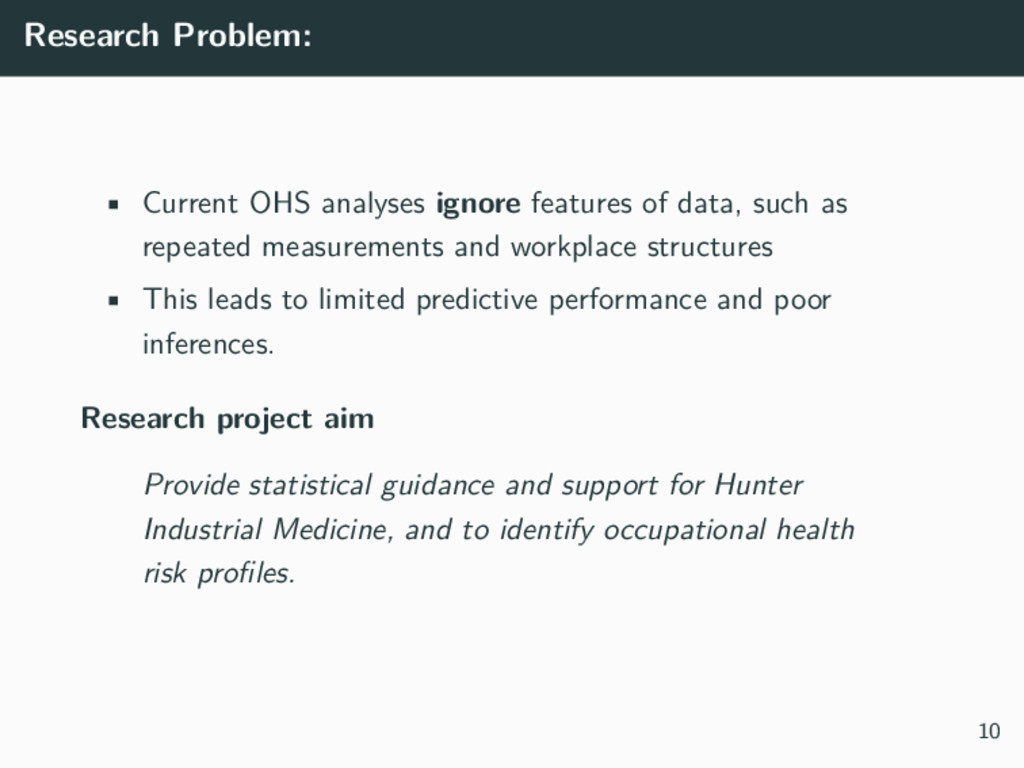
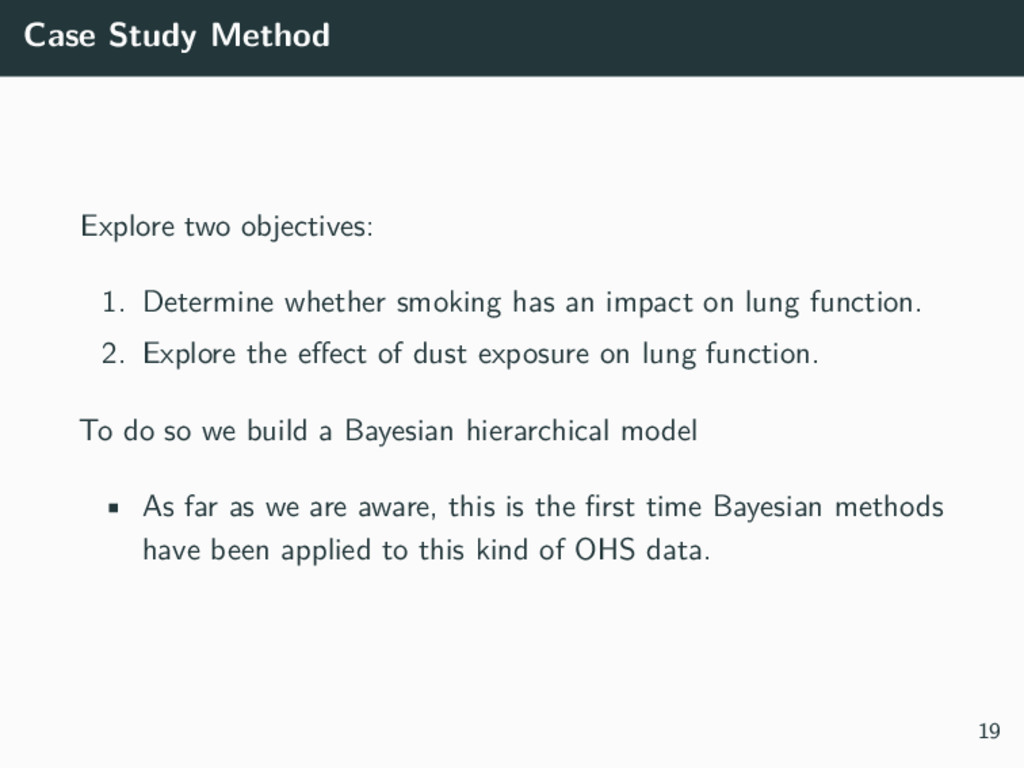
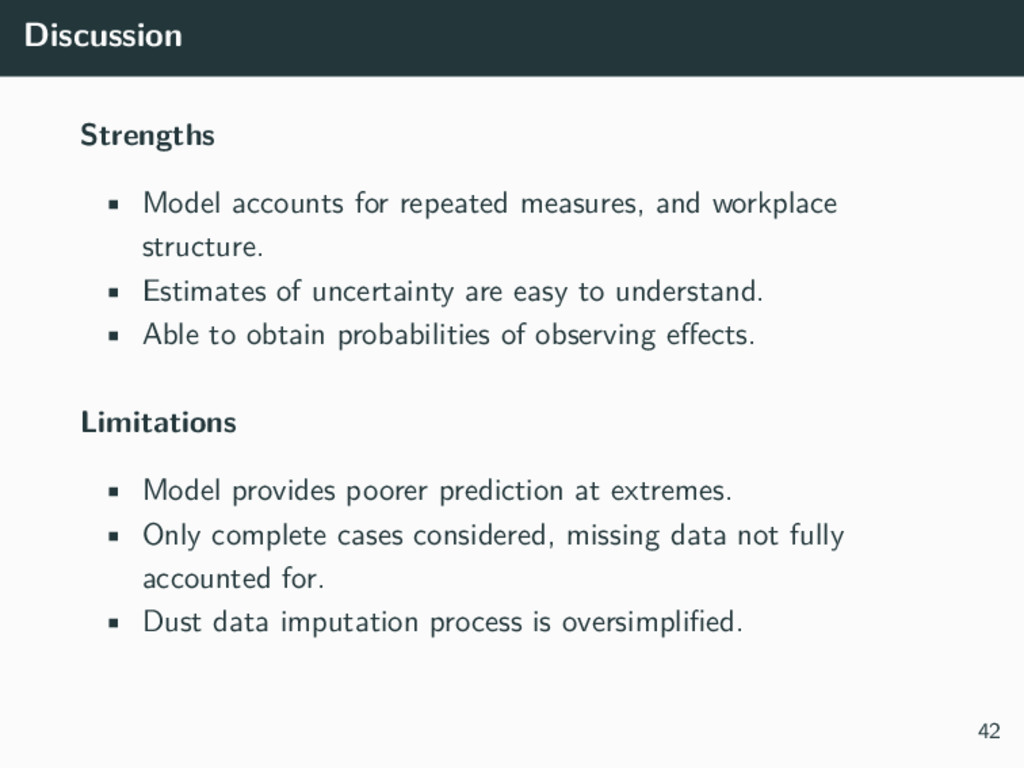
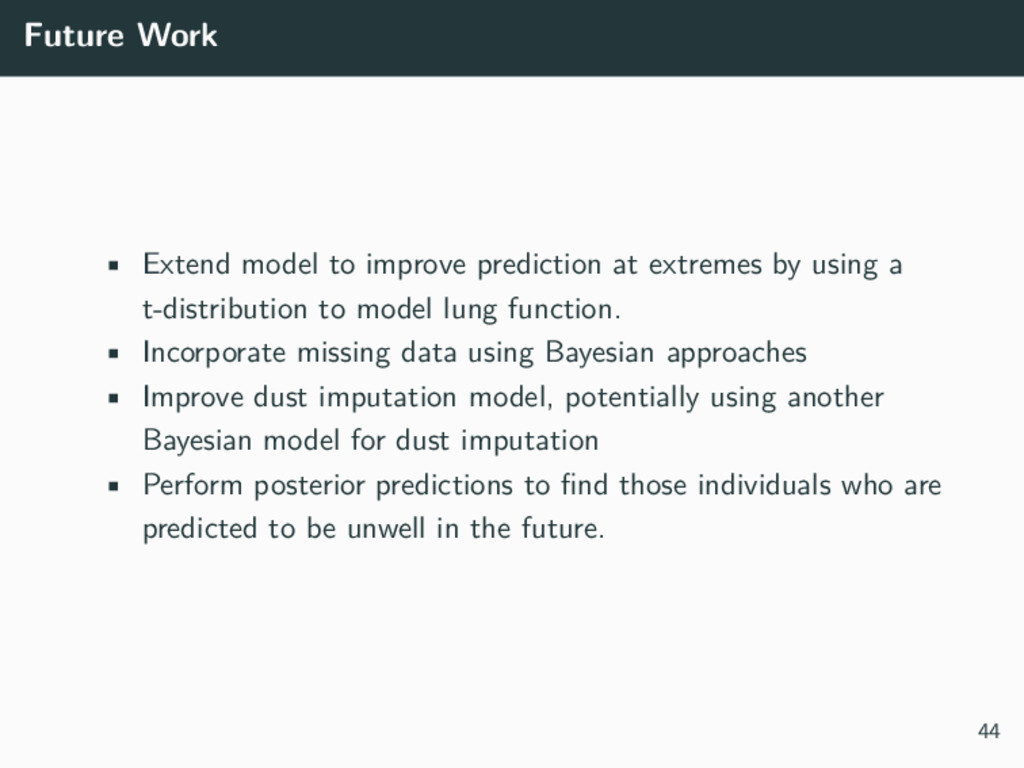
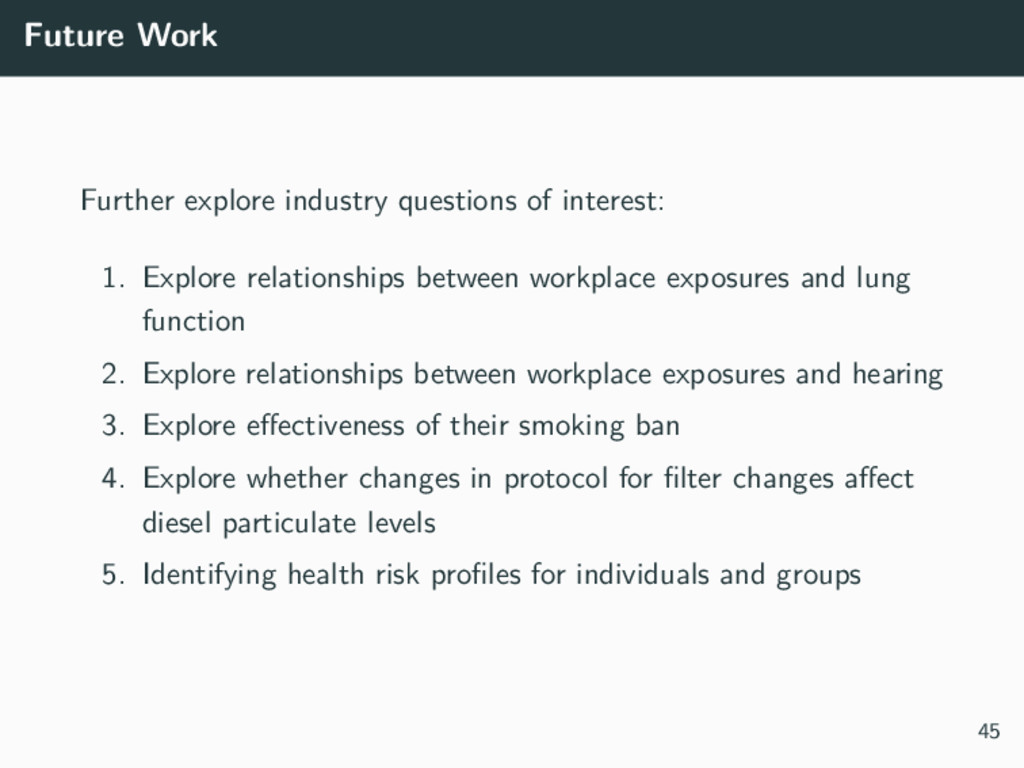
Working with real world data is often difficult and almost always messy. This talk discusses a real world research project under a new PhD scheme, the Industry Doctoral Training Centre (IDTC). The IDTC is a new program in Australia where PhD students work with an industry partner, and the research problem may have its roots in industry, rather than academia and theory. In this research project, Nicholas Tierney works with Hunter Industrial Medicine, a firm of occupational physicians who help monitor the health of employees in various industries such as mining, police, fire and rescue, and construction. This process of monitoring health is known as Occupational Health Surveillance (OHS), the systematic collection, analysis, and dissemination of employee environmental exposure and health data to facilitate early detection of disease and dangerous exposures in the workplace. Presently, analyses in OHS often ignore repeated measurements, missing data, and workplace structures, resulting in limited predictive performance and poor inference. This work aims to improve OHS models by applying Bayesian methods and machine learning techniques to help create occupational health risk profiles.

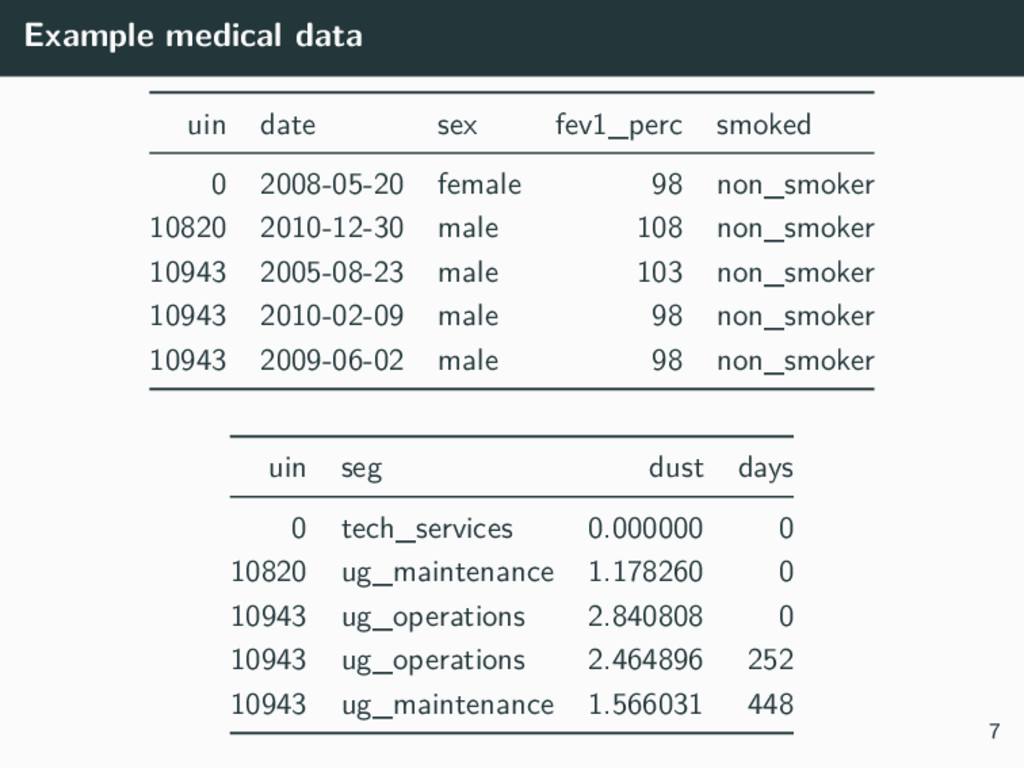
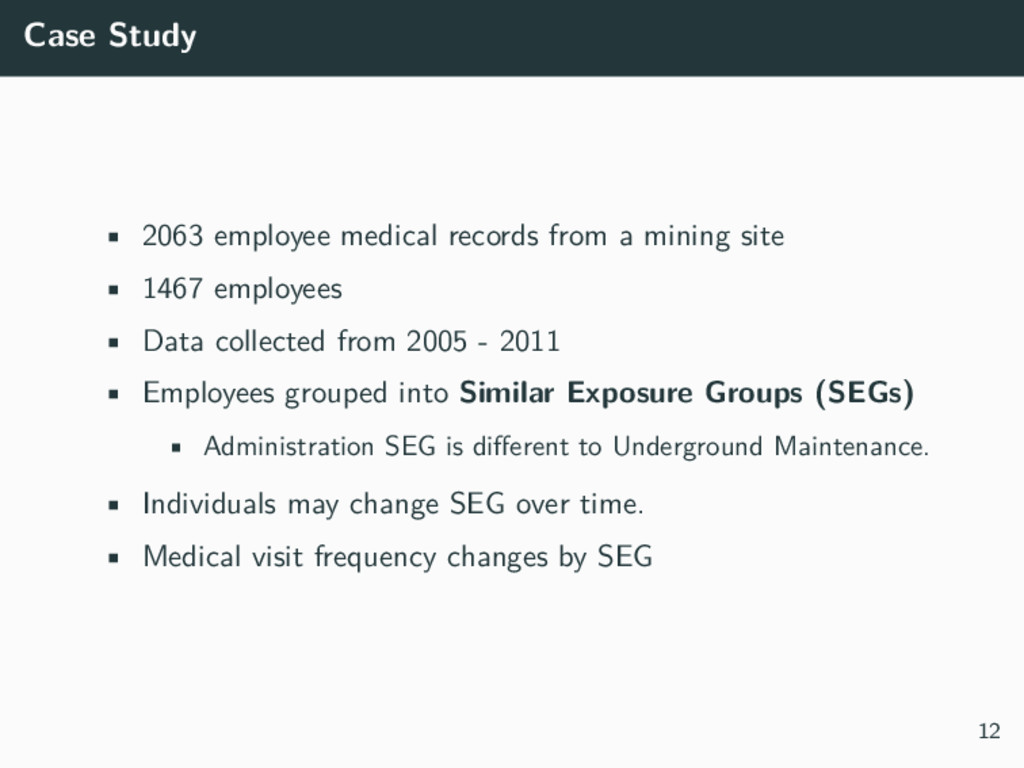
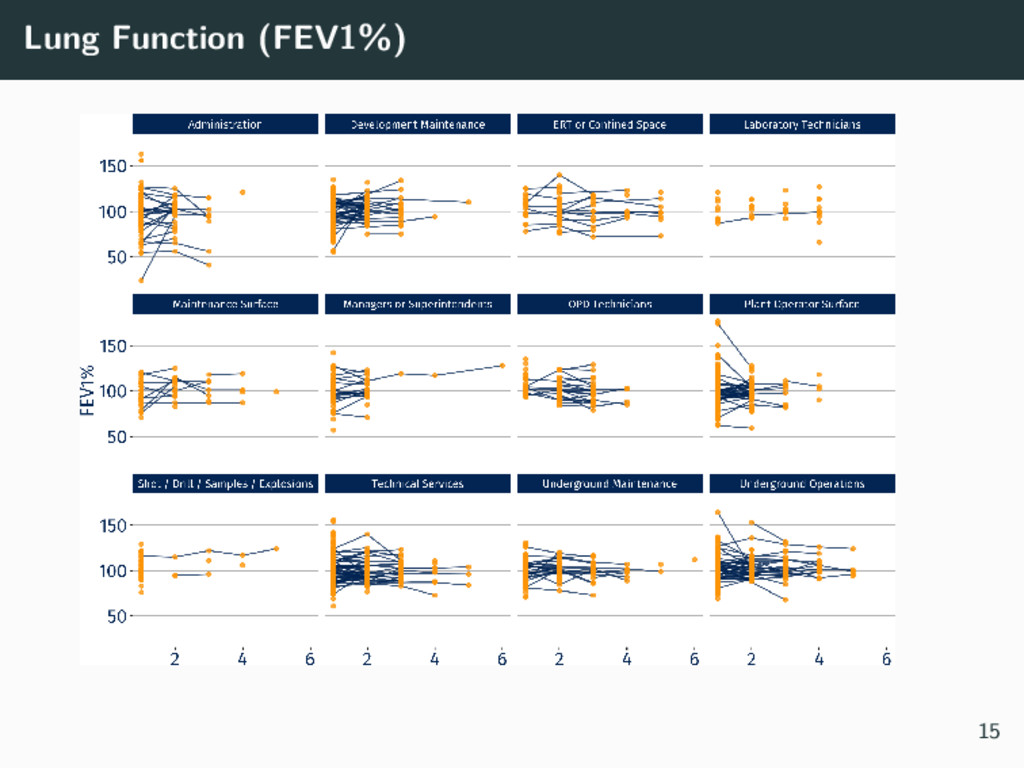
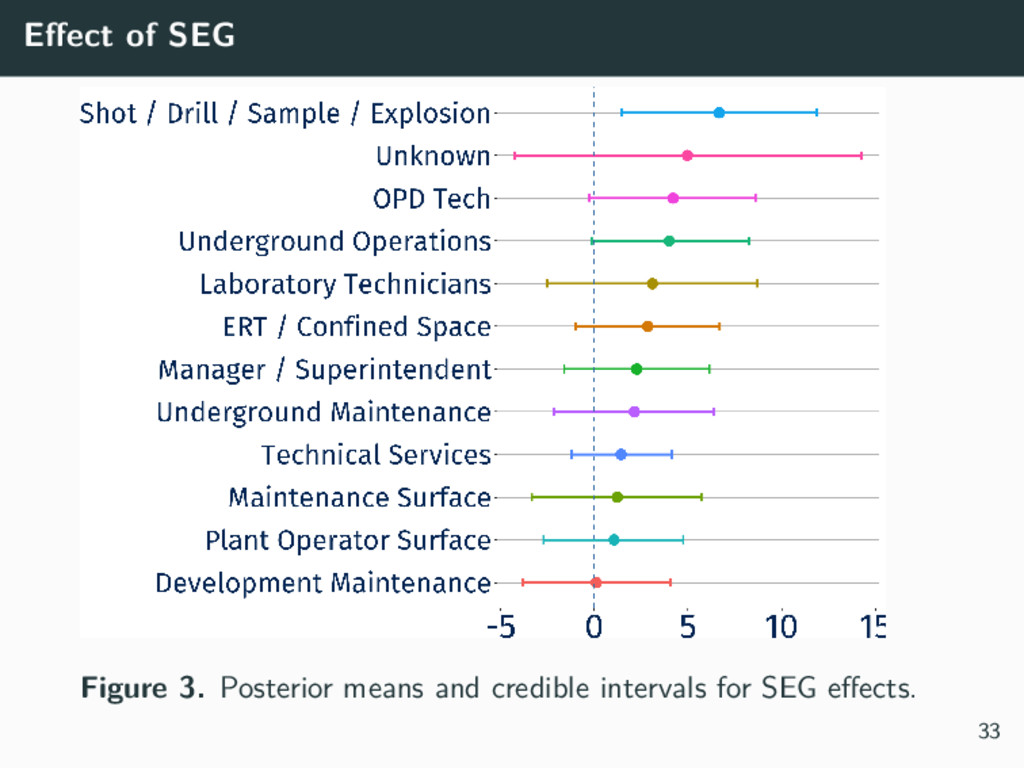
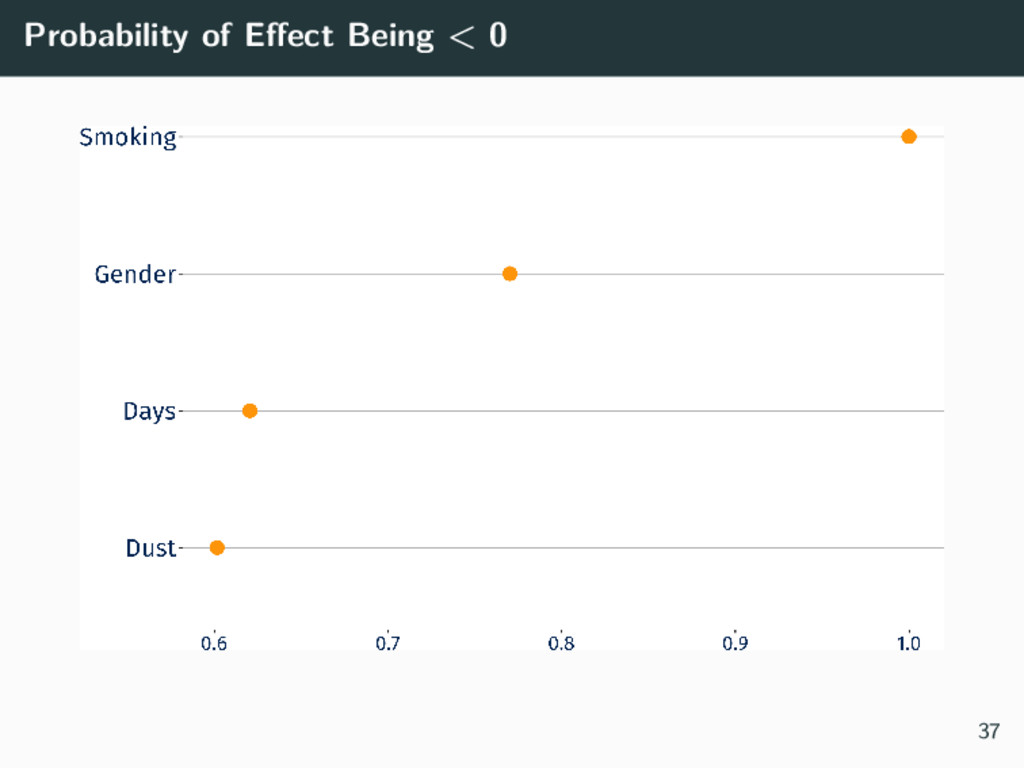
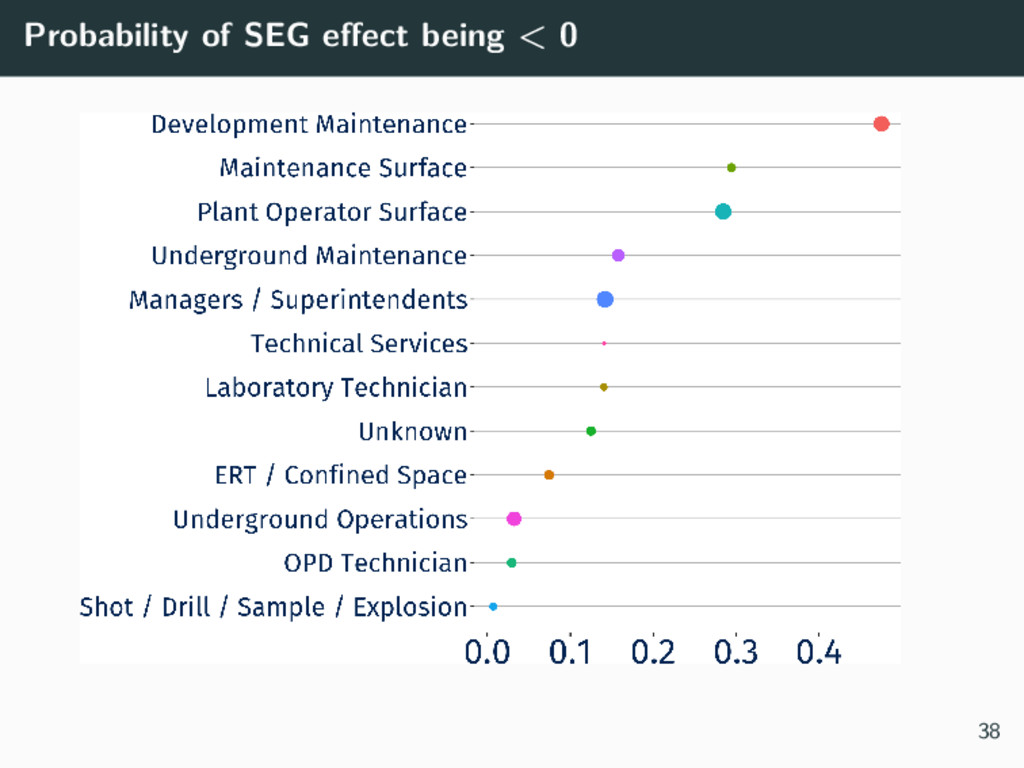
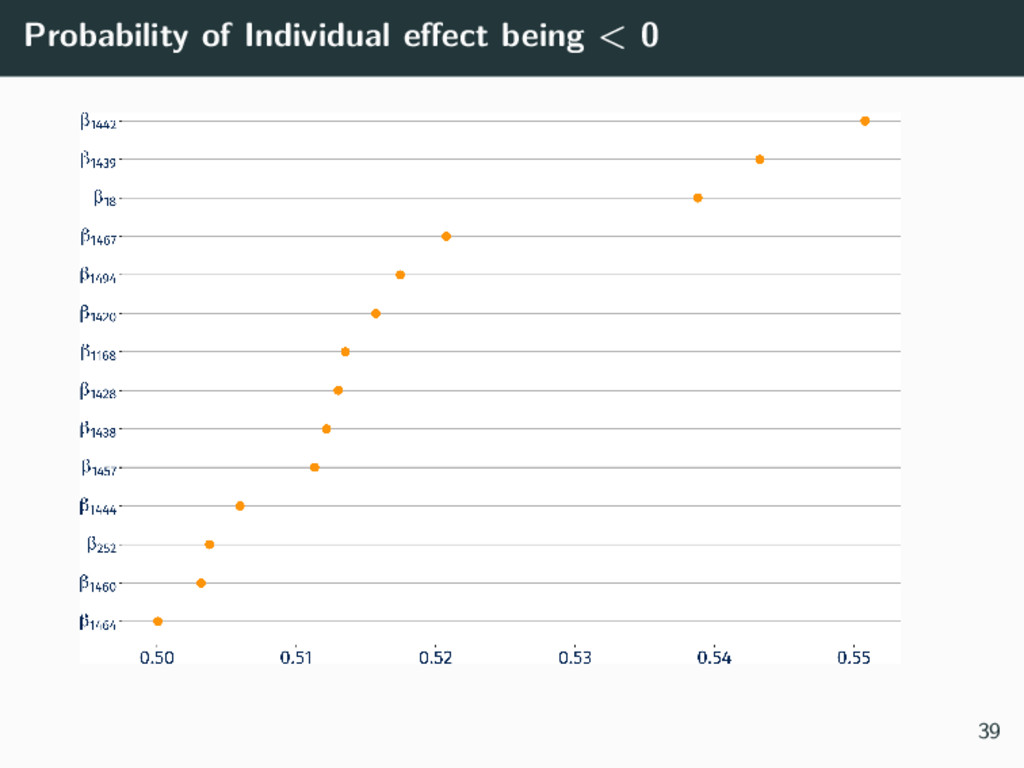
We consider a case study dataset from a mining site in Australia, which contains employee medical history and environmental exposures. Each employee may have multiple visits, and is within a Similar Exposure Group (SEG) based on their occupation (e.g., administration is in a different SEG to underground technician). We discuss the results so far in this work, plans for future analyses, and the lessons we have learnt from working with an industry partner and a real live dataset.

This project has been made available through partnership with Hunter Industrial Medicine, and is sponsored by the Industry Doctoral Training Centre, the Australian Centre of Excellence for Mathematical and Statistical Frontiers, and the Queensland University of Technology.

Nicholas Tierney

July 05, 2016
Tweet

More Decks by Nicholas Tierney

Other Decks in Science

Transcript

  1. Data Mining in Mining Data: Statistical Approaches in Occupational Health

    Surveillance for a Mining Site Queensland University of Technology, Brisbane, Australia Bayesian Research Applications Group ACEMS Nicholas Tierney Tuesday 5th July 1
  2. Background Research Problem Case Study Population Method A small digression

    into Bayesian methods Results Discussion Future Work 2
  3. PhD Research Industry Doctoral Training Centre (IDTC) • A new

    PhD programme, aiming to create stronger links between research and industry • The IDTC links a PhD student with an Industry Partner Key feature of the IDTC The research problem is born out of industry, and not necessarily academia. 4
  4. Hunter Industrial Medicine • Firm of occupational health physicians •

    Collect medical information on employees in various industries • Mining • Consutrction • Emergency Services 6
  5. Example medical data uin date sex fev1_perc smoked 0 2008-05-20

    female 98 non_smoker 10820 2010-12-30 male 108 non_smoker 10943 2005-08-23 male 103 non_smoker 10943 2010-02-09 male 98 non_smoker 10943 2009-06-02 male 98 non_smoker uin seg dust days 0 tech_services 0.000000 0 10820 ug_maintenance 1.178260 0 10943 ug_operations 2.840808 0 10943 ug_operations 2.464896 252 10943 ug_maintenance 1.566031 448 7
  6. Research Problem Industry is required by law to monitor employee

    health and analyse their employee health data, to perform Occupational Health Surveillance, which is defined as: The systematic collection, analysis, and dissemination of employee exposure and health data to facilitate early detection of disease and dangerous exposures in the workplace. 9
  7. Research Problem: • Current OHS analyses ignore features of data,

    such as repeated measurements and workplace structures • This leads to limited predictive performance and poor inferences. Research project aim Provide statistical guidance and support for Hunter Industrial Medicine, and to identify occupational health risk profiles. 10
  8. Case Study • 2063 employee medical records from a mining

    site • 1467 employees • Data collected from 2005 - 2011 • Employees grouped into Similar Exposure Groups (SEGs) • Administration SEG is different to Underground Maintenance. • Individuals may change SEG over time. • Medical visit frequency changes by SEG 12
  9. Case Study Research Aim Explore two objectives: 1. Determine whether

    smoking has an impact on lung function. 2. Explore the effect of dust exposure on lung function. 13
  10. Exploring Case Study Data Variables of interest: • Lung function

    (FEV1%) FEV1% = FEV1(L) FEV1(Predicted) ∗ 100 • SEG • Dust exposures • Gender • Smoking Status • Days since arrival 14
  11. Dust Exposures • Dust exposures aren’t recorded at the same

    time as medical visits. • Dust scores are interpolated by fitting a loess model for each SEG, and then predicting dust values for each SEG using corresponding dates in the medical data 17
  12. Case Study Method Explore two objectives: 1. Determine whether smoking

    has an impact on lung function. 2. Explore the effect of dust exposure on lung function. To do so we build a Bayesian hierarchical model • As far as we are aware, this is the first time Bayesian methods have been applied to this kind of OHS data. 19
  13. Why Bayesian? A statistical model aims to explain the phenonema/process

    under study, and can be thought of as a proposed mechanism for the generation of data y For a single observation, yi yi ∼ p(yi|θ) Where p(yi |θ) is the probability of observed yi as a function of some parameter/s θ, The “likelihood”. • p(yi |θ) is assumed to come from some parametric family (Normal, Poisson, Weibull,. . . ) 21
  14. Why Bayesian Given a model, we aim to estimate θ

    in order to summarise/make inferential statements about the population under study • In the classical or “frequentist” setting, this is achieved by maximum likelihood techniques • In the frequentist framework then, the focus here is on the probability of the data given θ: p(Y |θ) 22
  15. Why Bayesian Bayesian methods are based on the application of

    Bayes’ theorem For continuous θ: p(θ|y) = p(y|θ)p(θ) p(y|θ)p(θ)dθ For discrete θ: p(θ|y) = p(y|θ)p(θ) θ p(y|θ)p(θ) Up to a constant of proportionality, p(θ|y) ∝ p(y|θ)p(θ) 23
  16. Why Bayesian The main thing to take away from this

    is that using Bayesian methods means that we shift the focus from probability of data given the parameters to probability of parameters given the data. This allows you to ask what can you say about θ given the data you have collected. 24
  17. Benefits of Bayesian • Allows for the quantification of uncertainty

    in θ and/or the incorporation of previous knowledge/“expert opinion” • Shifts the statement of probability from the data to the unknown parameters. • Distributions are given for parameters, rather than point-estimates. You could think of point estimates giving you information about the height of a mountain, and the bayesian methods giving you a rich topographical map, describing the landscape 25
  18. Priors Priors can be informative or noninformative • Informative: previous

    knowledge or opinion about θ is available • Noninformative: little is known - allows the data to “speak for itself” 26
  19. Bayesian Estimation Models are very rarely simple. . . The

    Bayesian posterior is often analytically intractable We consider numerical solutions of Markov Chain Monte Carlo (MCMC), using Gibbs sampling, an MCMC approach commonly used in Bayesian methods (C. P. Robert & Casella, 2004). 27
  20. Model Yij ∼ N(µij, τy ) µij = β0 +

    δxij + αi + βi xij+ θsexi + λsmokeij + ηdustij + nSEG −1 k=1 γkI(SEGij = k) for i = 1 . . . npatients for j = 1 . . . nobservations,i For k = 1, . . . , nSEG 28
  21. Model Priors αi ∼ N(0, τα) βi ∼ N(0, τβ)

    γk ∼ N(0, τγk ) β0, δ, θ, λ, η ∼ N(0, 103) τα, τy , τβ, ∼ Γ(0.001, 0.001) 29
  22. Model Software Model was fit using JAGS, run for 20,000

    iterations, with a burnin of 10,000 30
  23. Effects of Smoking, Dust, Gender, Days Figure 2. Posterior means

    and 95% credible intervals for Smoking, Gender, Dust, and Days. 32
  24. Results Summary The definition of a Bayesian credible interval as

    a range of probable values for a parameter makes it easier to communicate model inferences and show individuals who do not deviate much from the overall population change in lung function. • Highly unlikely that dust, gender, and the number of days since first visi have an effect on lung function • Highly likely smoking has an impact on lung function. • SEG “Shot Drill Sample Explosion” is highly likely to have higher lung function over Administration after accounting for SEG-based dust exposure. 35
  25. Using MCMC Samples to convey information differently. Taking every MCMC

    poster sample (after the burn-in), we can make the samples to be 1 or 0, based on whether the sample is < 0. variable samples indicator smoking -0.5 1 smoking -0.1 1 smoking -1.3 1 dust 1.2 0 dust 0.9 0 variable mean_indicator smoking 0.99 dust 0.45 36
  26. Results Summary • Appears to be no significant between-individual effect

    for lung function over time. • ≈ 100% chance smoking is negatively impacting lung function, vs 85% chance for sex. • Low chance that SEGs have lung function lower than Administration. • Identify individuals for closer monitoring based upon finding those individuals with ≥ 3 visits and > 50% chance of deviating negatively from the overall population. 40
  27. Discussion Strengths • Model accounts for repeated measures, and workplace

    structure. • Estimates of uncertainty are easy to understand. • Able to obtain probabilities of observing effects. Limitations • Model provides poorer prediction at extremes. • Only complete cases considered, missing data not fully accounted for. • Dust data imputation process is oversimplified. 42
  28. Future Work • Extend model to improve prediction at extremes

    by using a t-distribution to model lung function. • Incorporate missing data using Bayesian approaches • Improve dust imputation model, potentially using another Bayesian model for dust imputation • Perform posterior predictions to find those individuals who are predicted to be unwell in the future. 44
  29. Future Work Further explore industry questions of interest: 1. Explore

    relationships between workplace exposures and lung function 2. Explore relationships between workplace exposures and hearing 3. Explore effectiveness of their smoking ban 4. Explore whether changes in protocol for filter changes affect diesel particulate levels 5. Identifying health risk profiles for individuals and groups 45
  30. References 1: JAGS: A program for analysis of Bayesian Graphical

    Models using Gibbs sampling, Plummer, M, 2003. 2: Martyn Plummer (2016). rjags: Bayesian Graphical Models using MCMC. R package version 4-6. https://CRAN.R-project.org/package=rjags 3: R Core Team (2016). R: A language and environment for statistical computing. R Foundation for Statistical Computing, Vienna, Austria. URL https://www.R-project.org/. 46
  31. References 4: RStudio Team (2015). RStudio: Integrated Development for R.

    RStudio, Inc., Boston, MA http://www.rstudio.com/. 5: Gelman, A., Carlin, J. B., Stern, H. S., & Rubin, D. B. (2014). Bayesian data analysis (Vol. 2). Boca Raton, FL, USA: Chapman & Hall/CRC. 6: Lunn, D., Jackson, C., Best, N., Thomas, A., & Spiegelhalter, D. (2012). The BUGS book: A practical introduction to Bayesian analysis. CRC press. 47
  32. Acknowledgements The author would like to thank and acknowledge the

    United States Office of Naval Research for providing travel support for this conference. The author would also like to thank Xing Lee and Nicole White for their advice and collaboration with this project. 48