Upgrade to Pro — share decks privately, control downloads, hide ads and more …

Understanding Missing Data: The Use of Classification and Regression Trees, and Boosted Regression Trees

Understanding Missing Data: The Use of Classification and Regression Trees, and Boosted Regression Trees

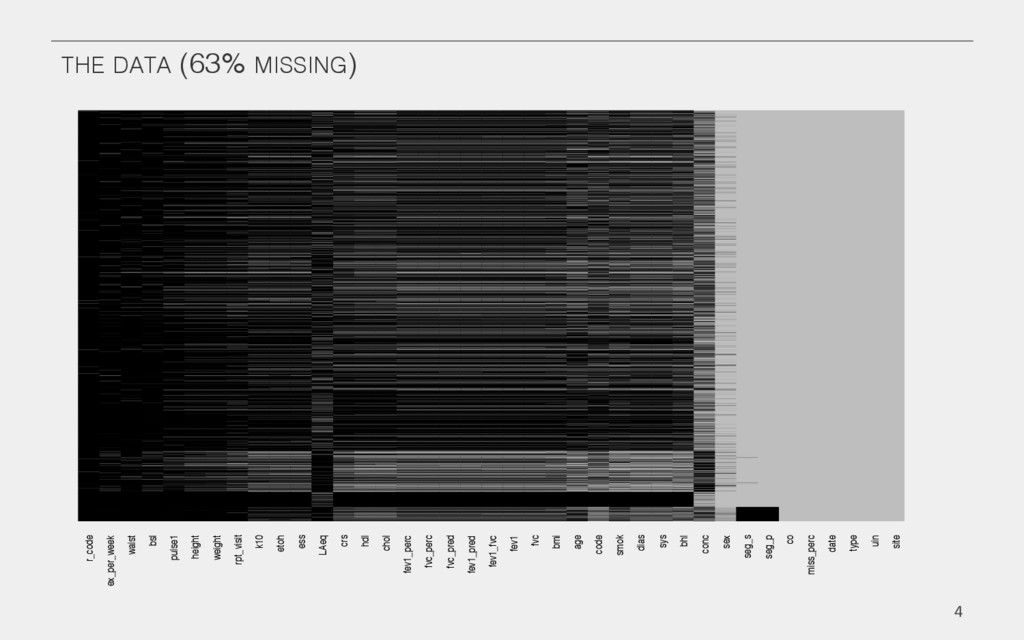
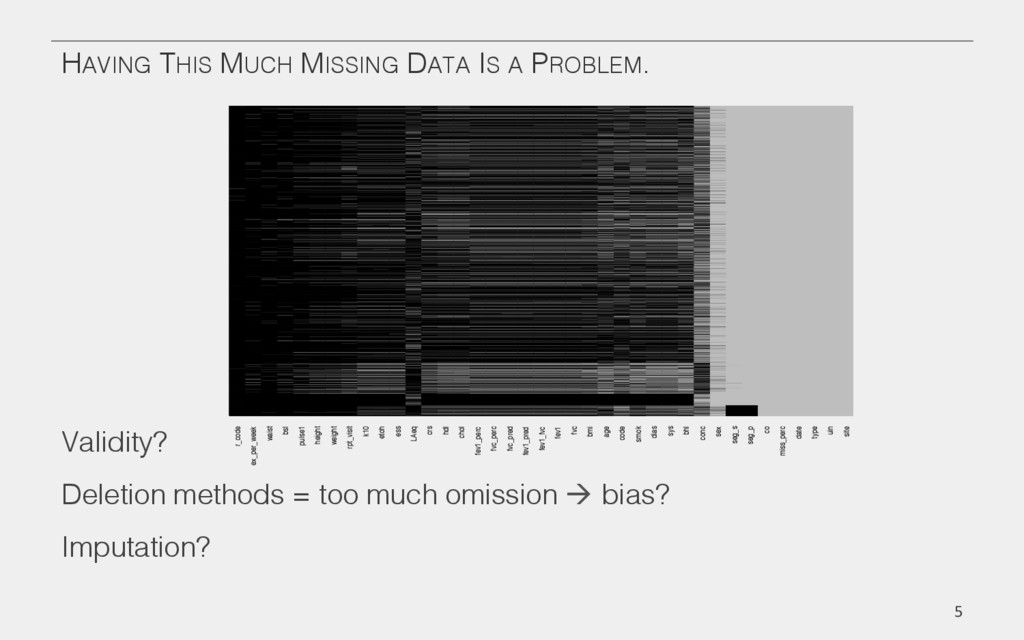
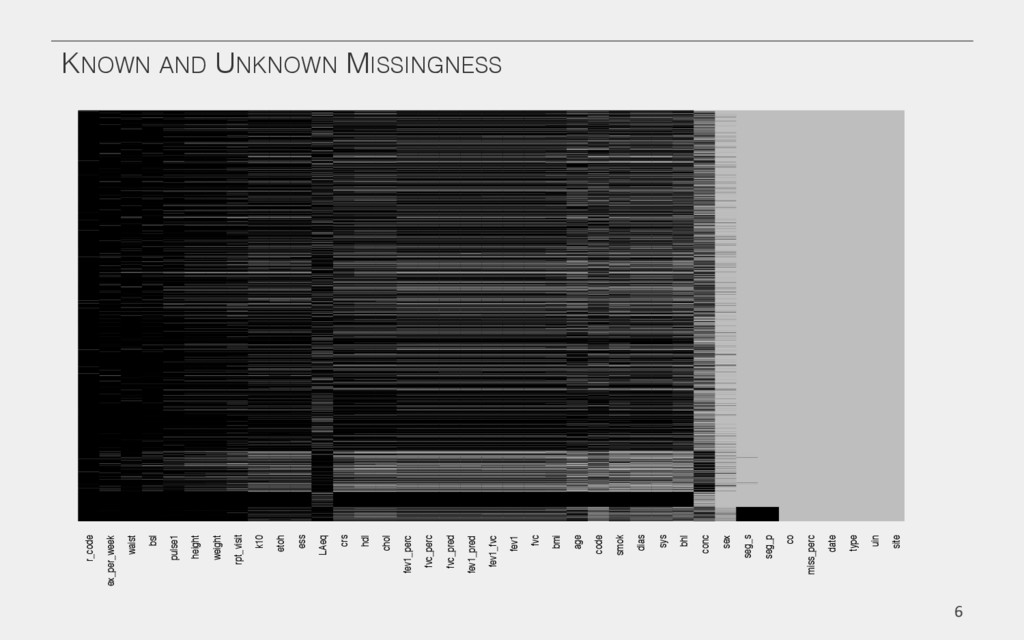
With access to data becoming easier, and the emergence of Big Data, situations arise where researchers may not easily understand the context in which the data was measured, collected, and collated. Consequentially, researchers may find themselves confused as to what they should do with an ‘unusable’ dataset containing a high number of missing values. Although multiple imputation (MI) methods can provide accurate prediction of missing values, they are not always the answer to a researcher’s missing data problem, and rely heavily on the researcher having a complete understanding of how data were generated. We demonstrate a method for approaching missing data when using linked health data, and propose a set of steps that could be generalised to applied research.

Nicholas Tierney

July 09, 2014
Tweet

More Decks by Nicholas Tierney

Other Decks in Science

Transcript

  1. UNDERSTANDING MISSING DATA USING CART AND BRT MODELS!
    ASC-IMS 2014!
    Authors: Nicholas Tierney, Dr. Jegar Pitchforth, Prof. Kerrie Mengersen!
    Special Thanks: Dr. Fiona Harden, Dr. Maurice Harden!
    ! 1  

    View Slide

  2. OUTLINE!
    •  Aims of research!
    •  Motivating example!
    •  Methods!
    •  Detect Structure in missing data!
    •  CART!
    •  BRT!
    •  Results!
    •  Discussion + Conclusion!
    •  Current Research!
    •  Future Methods!
    2  

    View Slide

  3. AIMS OF MY RESEARCH!
    3  
    DATA!
    •  BMI!
    •  Lung Function!
    •  Cholesterol!
    •  Age!
    •  Gender!
    •  Blood and Urine!
    !
    AIMS:!
    •  " Identify risk factors!
    •  " Identify risk groups!
    !

    View Slide

  4. THE DATA (63% MISSING)!
    r_code
    ex_per_week
    waist
    bsl
    pulse1
    height
    weight
    rpt_visit
    k10
    etoh
    ess
    LAeq
    crs
    hdl
    chol
    fev1_perc
    fvc_perc
    fvc_pred
    fev1_pred
    fev1_fvc
    fev1
    fvc
    bmi
    age
    code
    smok
    dias
    sys
    bhl
    conc
    sex
    seg_s
    seg_p
    co
    miss_perc
    date
    type
    uin
    site
    4  

    View Slide

  5. HAVING THIS MUCH MISSING DATA IS A PROBLEM.!
    !
    Validity?!
    Deletion methods = too much omission à bias?!
    Imputation?!
    !
    5  
    r_code
    ex_per_week
    waist
    bsl
    pulse1
    height
    weight
    rpt_visit
    k10
    etoh
    ess
    LAeq
    crs
    hdl
    chol
    fev1_perc
    fvc_perc
    fvc_pred
    fev1_pred
    fev1_fvc
    fev1
    fvc
    bmi
    age
    code
    smok
    dias
    sys
    bhl
    conc
    sex
    seg_s
    seg_p
    co
    miss_perc
    date
    type
    uin
    site

    View Slide

  6. KNOWN AND UNKNOWN MISSINGNESS!
    6  
    r_code
    ex_per_week
    waist
    bsl
    pulse1
    height
    weight
    rpt_visit
    k10
    etoh
    ess
    LAeq
    crs
    hdl
    chol
    fev1_perc
    fvc_perc
    fvc_pred
    fev1_pred
    fev1_fvc
    fev1
    fvc
    bmi
    age
    code
    smok
    dias
    sys
    bhl
    conc
    sex
    seg_s
    seg_p
    co
    miss_perc
    date
    type
    uin
    site

    View Slide

  7. KNOWN AND UNKNOWN MISSINGNESS!
    UIN! AGE! BMI! N-Test!
    1-ABC! 21! 22! -!
    1-ABC! 21! 24! -!
    1-ABC! 21! 23! -!
    2-HJK! 45! 25! 8!
    2-HJK! 46! 26! 9!
    7  

    View Slide

  8. AIM!
    Detect missingness structure in a dataset.!
    DV = Proportion of missingness!
    IV = All other variables!
    CART and BRT – Novel approach!!
    •  CART & BRT can handle many variables!
    •  CART provides interpretability!
    •  BRT provides robustness!
    !
    8  

    View Slide

  9. CART!
    9  
    James et al. (2013)!

    View Slide

  10. RESULTS - CART!
    ## Run the model!
    cart.small <- rpart(miss_perc ~ X1…Xp, !
    data = data, !
    na.action = na.rpart, !
    method = "anova")!
    !
    !
    !
    !
    !
    !
    !
    !
    10  
    type = 1
    type = 2
    rpt_visi = 1
    2,3,4,5,6
    3,4,5,6
    2,3,4,5,6,7,8
    Prop. Miss = 0.67
    n=7915
    Prop. Miss = 0.26
    n=1504
    Prop. Miss = 0.77
    n=6411
    Prop. Miss = 0.64
    n=1349
    Prop. Miss = 0.37
    n=65
    Prop. Miss = 0.65
    n=1284
    Prop. Miss = 0.8
    n=5062
    ## Plot the model!
    prp(cart.small, extra = 1, type =
    4, prefix = "Prop. Miss = ")!
    !

    View Slide

  11. CART: LIMITATIONS!
    Difficulty in modelling linear relationships !
    Sensitive to small changes in the data.!
    Do not have the same level of predictive accuracy as other methods.!
    !
    11  

    View Slide

  12. BRT!
    12  

    View Slide

  13. RESULTS - BRT!
    tree.tc5.lr01 <- gbm.step(data = data, !
    ! ! ! ! ! ! ! !tree.complexity = 5,!
    ! ! ! ! ! ! ! !learning.rate = 0.01,!
    ! ! ! ! ! ! ! !bag.fraction = 0.5)!
    13  
    BMI! FEV1! FVC! FVCPred
    !
    !
    FEV1Pred
    ! Type! FEV1%! Sys! Smok! FVCperc
    !
    26.3! 20.3! 15.6! 11.3! 9.5! 4.2! 2! 1.7! 1.7! 1.0!

    View Slide

  14. RESULTS: BRT!
    14  

    View Slide

  15. DISCUSSION: DECISION TREES!
    Reveal important known and unknown missingness structure!
    CART: Influence of Type and repeated visit on missingness!
    BRT: Influence of extreme values!
    15  

    View Slide

  16. CONCLUSION!
    CART and BRT models have been helpful for our data!
    It will help us continue our way towards our aims:!
    •  Identify Risk factors, groups, and individuals.!
    16  

    View Slide

  17. CURRENT WORK: DEALING WITH MISSING DATA!
    17  
    type = 1
    type = 2
    rpt_visi = 1
    2,3,4,5,6
    3,4,5,6
    2,3,4,5,6,7,8
    Prop. Miss = 0.67
    n=7915
    Prop. Miss = 0.26
    n=1504
    Prop. Miss = 0.77
    n=6411
    Prop. Miss = 0.64
    n=1349
    Prop. Miss = 0.37
    n=65
    Prop. Miss = 0.65
    n=1284
    Prop. Miss = 0.8
    n=5062
    Subsetting based upon CART
    model.!
    !
    !
    !

    View Slide

  18. CURRENT WORK: PCA!
    18  


    29.74
    20.66
    14.43
    10.99
    9.9
    7.98
    4.34
    1.96
    0.5
    1.0
    1.5
    2.0
    1 2 3 4 5 6 7 8
    Components
    In Order of Extraction
    Eigenvalue
    Scree plot
    With Proportion of Variance Explained

    View Slide

  19. 19  

    View Slide

  20. FUTURE WORK!
    Explore cluster membership over time!
    Predict the Pr(High Risk) using MLM!
    Inform our industry to help prevent illness early.!
    20  

    View Slide

  21. REFERENCES!
    1 "Schafer JL, Graham JW. Missing data: Our view of the state of the art. Psychol Methods 2002;7:147–77. doi:10.1037//1082-989X.
    7.2.147!
    2 "Brick J, Kalton G. Handling missing data in survey research. Stat Methods Med Res 1996;5:215–38. doi:
    10.1177/096228029600500302!
    3 "Graham JW. Missing data analysis: making it work in the real world. Annu Rev Psychol 2009;60:549–76. doi:10.1146/annurev.psych.
    58.110405.085530!
    4 "Little RJA. A Test of Missing Completely at Random for Multivariate Data with Missing Values. J Am Stat Assoc 1988;83:1198–202.!
    5 "Rubin DB. Inference and missing data. Biometrika 1976;63:581–92.http://biomet.oxfordjournals.org/!
    6 "Howell D. Statistical Methods for Psychology. Cengage Learning 2012. !
    7 "Breiman L, Friedman J, Stone CJ, et al. Classification and regression trees. CRC press 1984. !
    8 "Hastie T, Tibshirani R, Friedman J. The elements of statistical learning. Springer 2009. http://www.springerlink.com/index/
    D7X7KX6772HQ2135.pdf (accessed 5 May2014).!
    9 "James G, Witten D, Hastie T, et al. An introduction to statistical learning. Springer 2013. http://link.springer.com/content/pdf/
    10.1007/978-1-4614-7138-7.pdf (accessed 5 May2014).!
    10 "Elith J, Leathwick JR, Hastie T. A working guide to boosted regression trees. J Anim Ecol 2008;77:802–13. doi:10.1111/j.
    1365-2656.2008.01390.x!
    21  

    View Slide

  22. REFERENCES!
    11 "Therneau TM, Atkinson EJ. An introduction to recursive partitioning using the RPART routines. 1997.!
    12 "Friedman JH, Meulman JJ. Multiple additive regression trees with application in epidemiology. Stat
    Med 2003;22:1365–81. doi:10.1002/sim.1501!
    13 "Breiman L. Comment-Statistical Modeling: The Two Cultures. Stat Sci 2001;16:199–231.http://
    scholar.google.com/scholar?hl=en&btnG=Search&q=intitle:Statistical+Modeling+:+The+Two+Cultures#2
    (accessed 30 Dec2013).!
    14 "R Core Team. R: A Language and Environment for Statistical Computing. 2013.http://www.r-
    project.org/!
    15 "RStudio. RStudio: Integrated development environment for R. !
    16 "Therneau T, Atkinson B, Ripley B. rpart: Recursive Partitioning. 2013.http://cran.r-project.org/
    package=rpart!
    17 "Ridgeway G. gbm: Generalized Boosted Regression Models. 2013.http://cran.r-project.org/
    package=gbm!
    18  Honaker J, King G, Blackwell M. AMELIA II : A Program for Missing Data. 2013;:1–54. !
    !
    22  

    View Slide

  23. ACKNOWLEDGEMENTS!
    Thanks to:!
    Dr. Nicole White; Dr Jegar Pitchforth; Prof. Kerrie Mengersen!
    Dr. Fiona Harden; Dr. Maurice Harden!
    !
    Australian Postgraduate Award (APA), !
    ATN Industrial Doctoral Training Centre (IDTC)!
    Australian Research Council.!
    !
    23  

    View Slide

  24. QUESTIONS!
    ?!
    24  

    View Slide

  25. EXTRA SLIDES!
    25  

    View Slide

  26. EXPLORATORY ANALYSES!
    26  
    ID! FEV1
    %! BMI! AGE! CHOL!
    1! 85%! 25! 19! 1.4!
    2! 90%! 23! 18! -missing!
    3! 89%! -missing-! -missing-! -missing!
    FEV1% = β0
    + β1
    BMI + β2
    AGE + β3
    CHOL +ε
    FEV1% = β0
    + β1
    BMI + β2
    AGE +ε

    View Slide

  27. UNKNOWN MISSINGNESS!
    27  
    UIN! AGE! BMI! FEV1%!
    25A! -! 22! 75%!
    25A! 21! 24! 79%!
    25A! 21! 23! 83%!

    View Slide

  28. INFER MISSINGNESS STRUCTURE!
    UIN! BMI! FEV1%! FVC%!
    2-HIJ! -! 75%! 80%!
    2-HIJ! -! 70%! 60%!
    3-LMNO! -! 75%! 65%!
    28  
    UIN! BMI! FEV1%! FVC%!
    4-QRS! 20! 90%! 92%!
    4-QRS! 21! 91%! 95%!
    5-XYZ! 24! 85%! 85%!
    p!
    P’!

    View Slide

  29. INFER MISSINGNESS STRUCTURE!
    GENDER!
    PRESENCE! ABSENCE!
    BMI! Observed Count!
    !
    (Expected Count)!
    Observed Count!
    !
    (Expected Count)!
    29  

    View Slide

  30. RESULTS!
    30  
    Presence /
    Absence!
    Variables Affected!
    BMI! Date, Age, SYS, DIAS, HDL, CRS, BHL, Missing%,
    FEV1/FVC, FEV1%, Site, Type, SEG (P), Code, SEG
    (S), Repeat Visit, Smoking, Sex !
    FEV1, FVC,
    FEV1 / FVC!
    As for BMI:!
    + Exercise per week !
    Concentration! UIN, Date, Missing%, Site, Type, SEG (P), SEG (S) !

    View Slide