Upgrade to Pro — share decks privately, control downloads, hide ads and more …

Be a Hawk not a Turkey: How a Bird's Eye View of your Data Can Streamline Data Analysis

Be a Hawk not a Turkey: How a Bird's Eye View of your Data Can Streamline Data Analysis

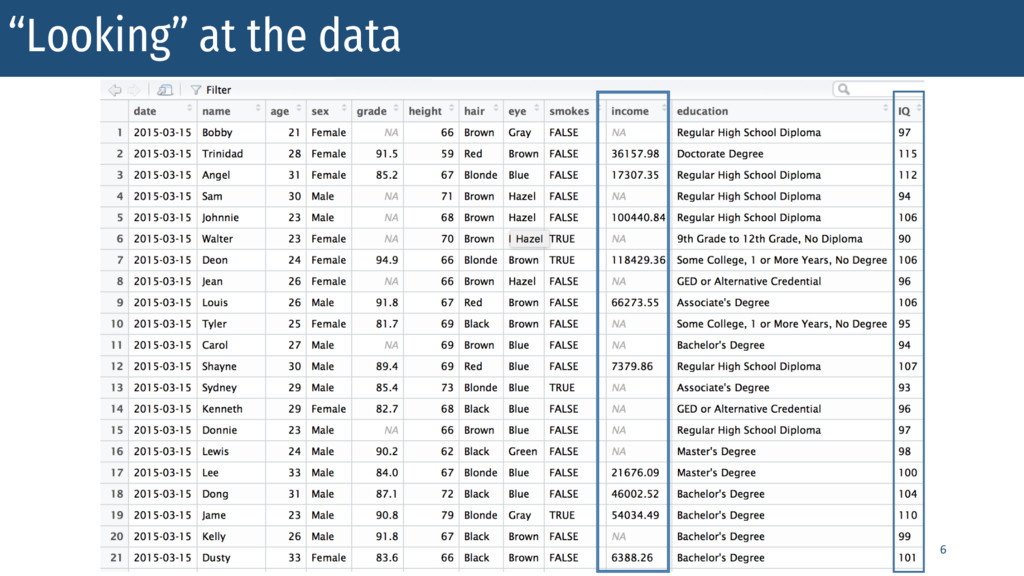
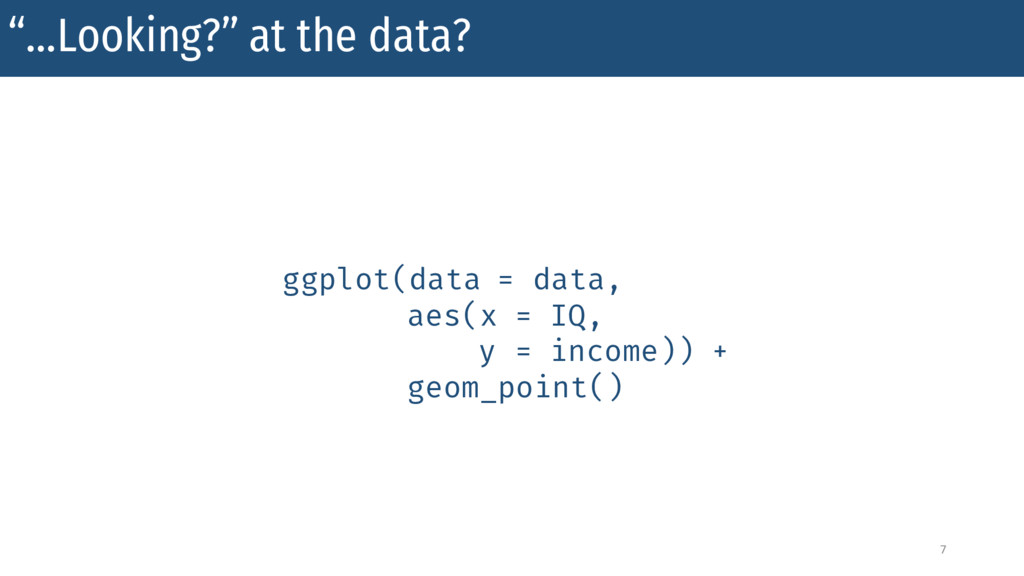
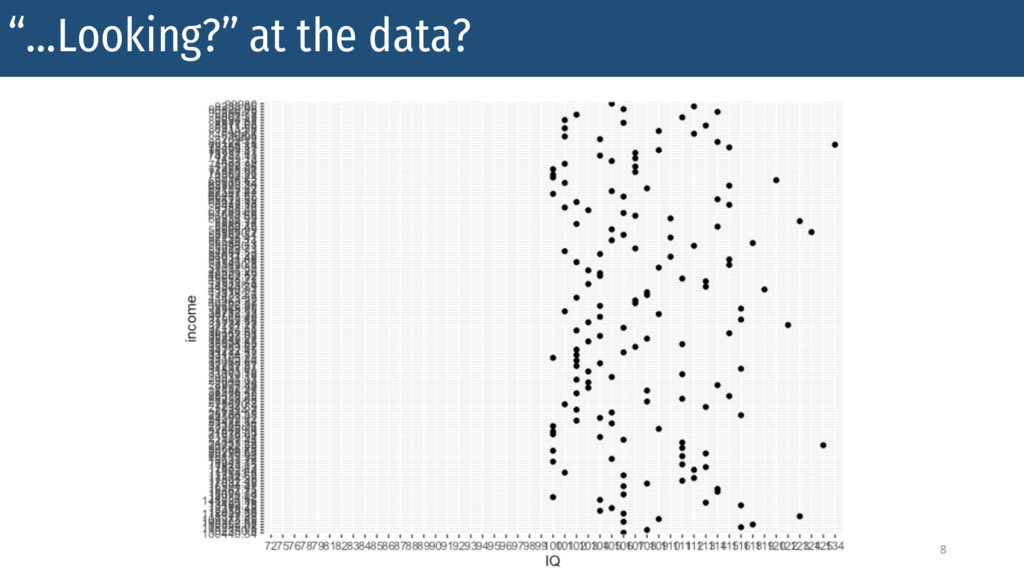
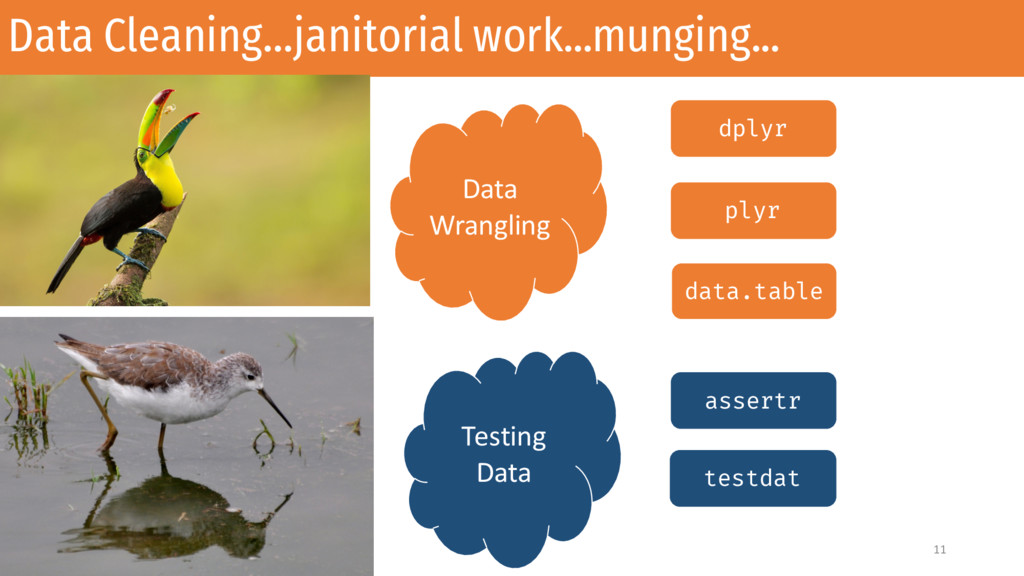
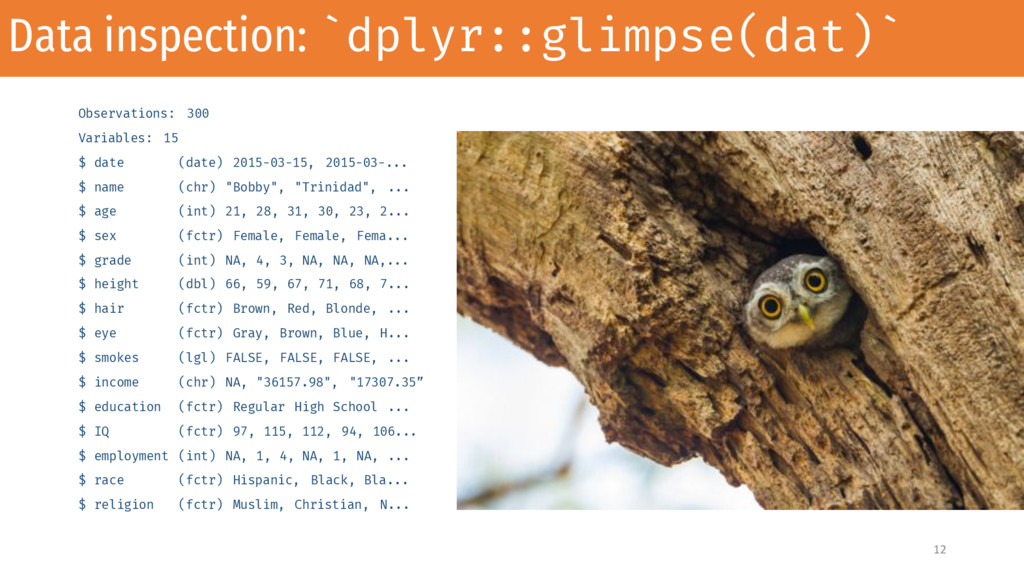
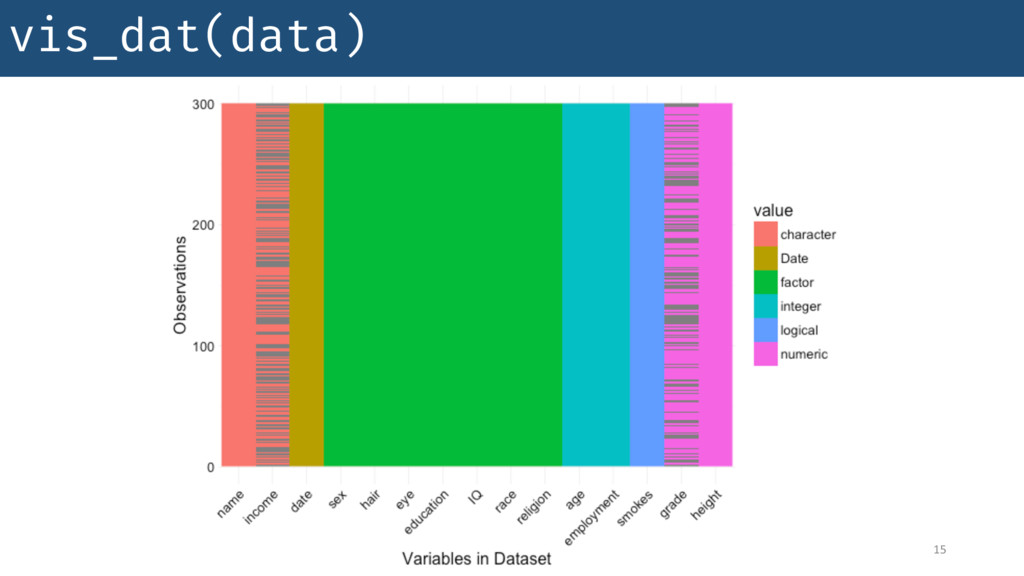
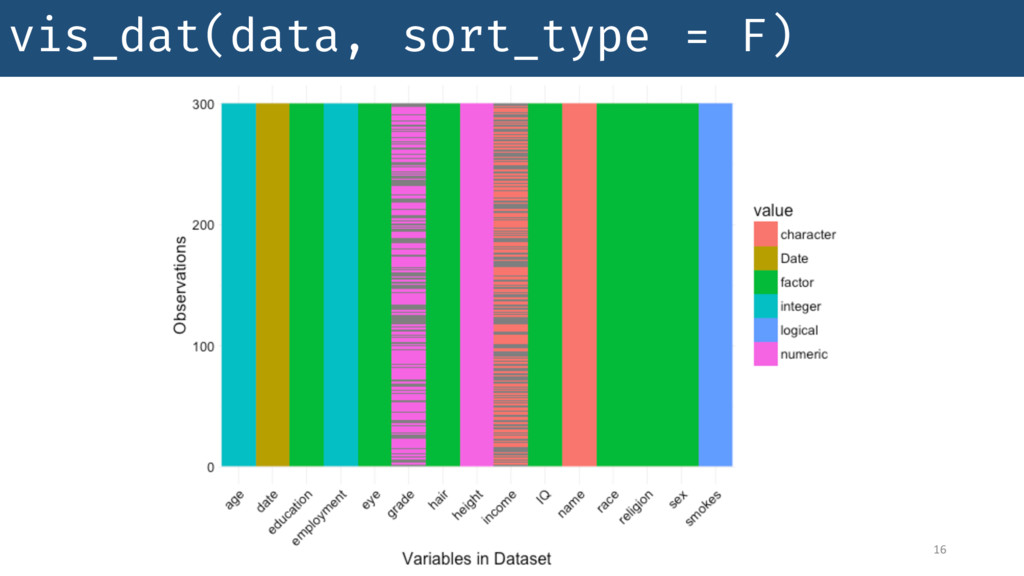
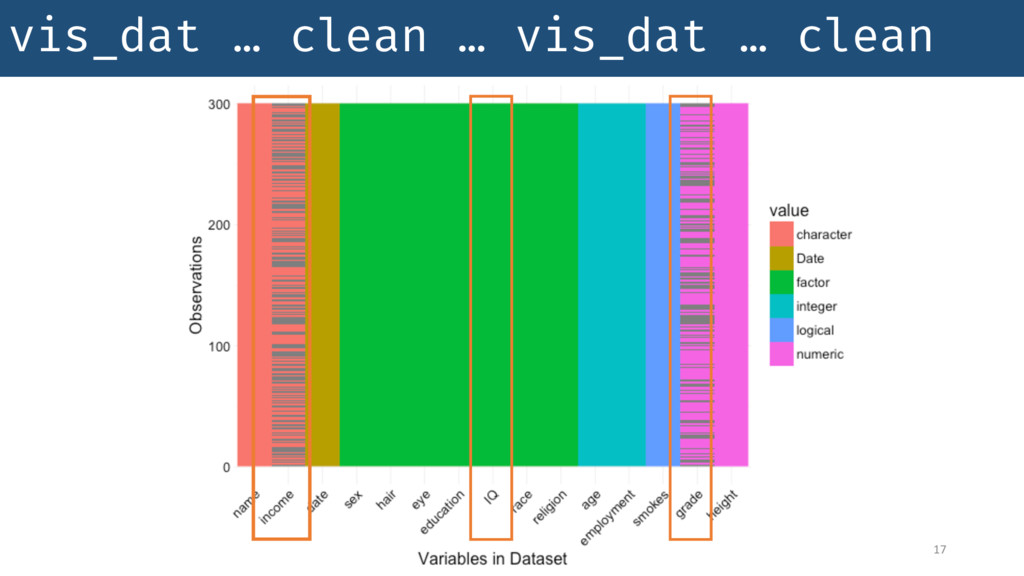
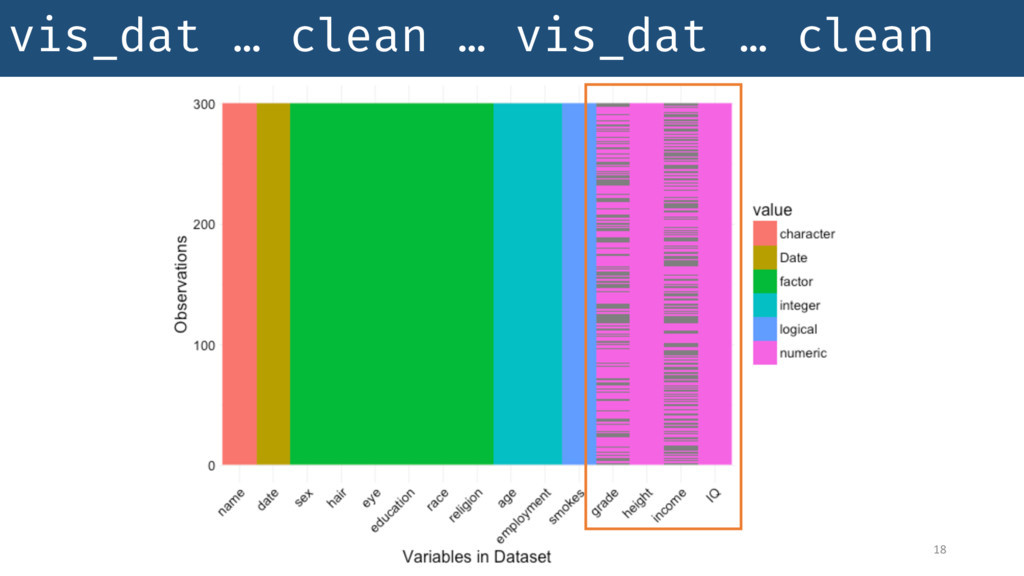
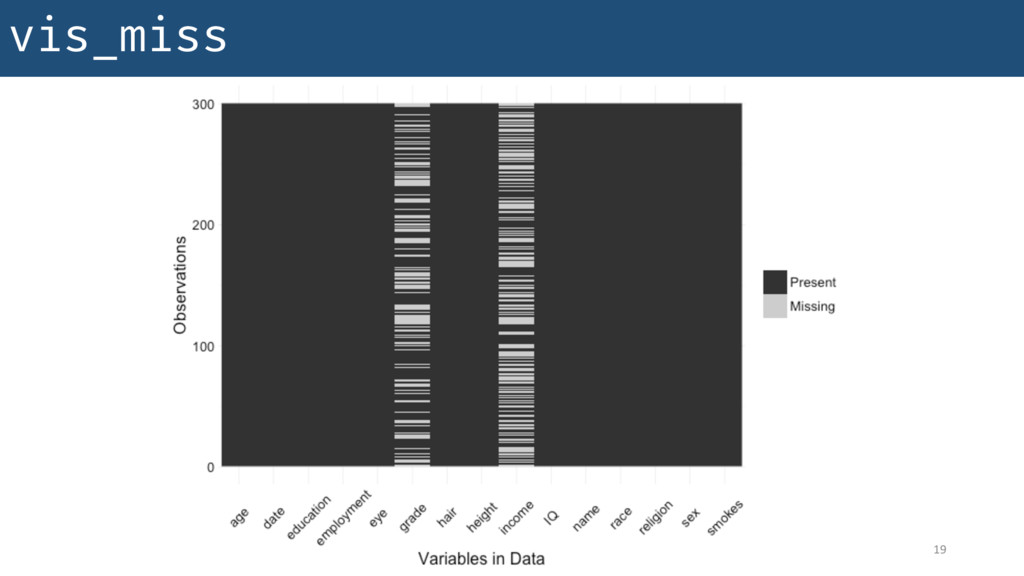
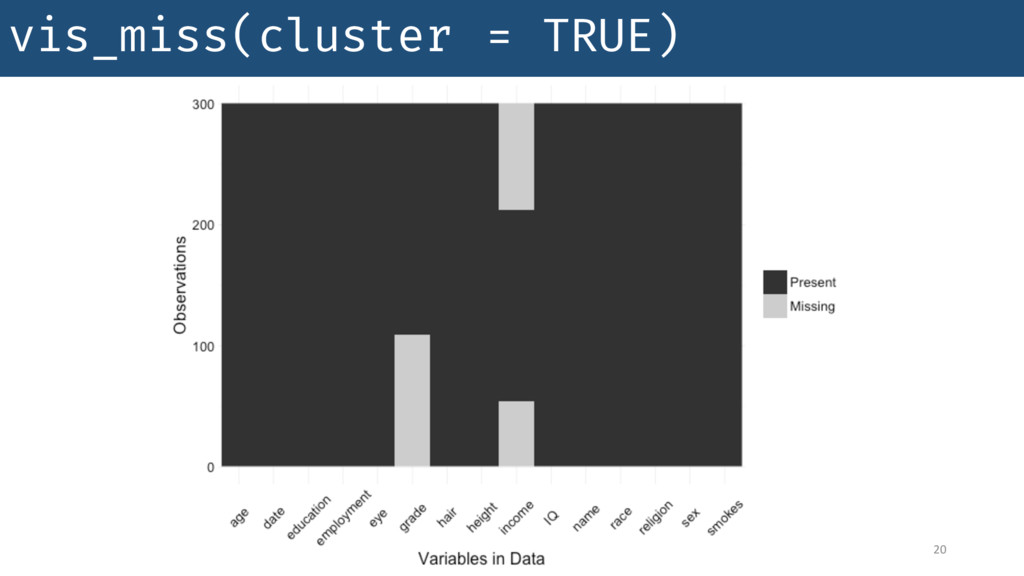
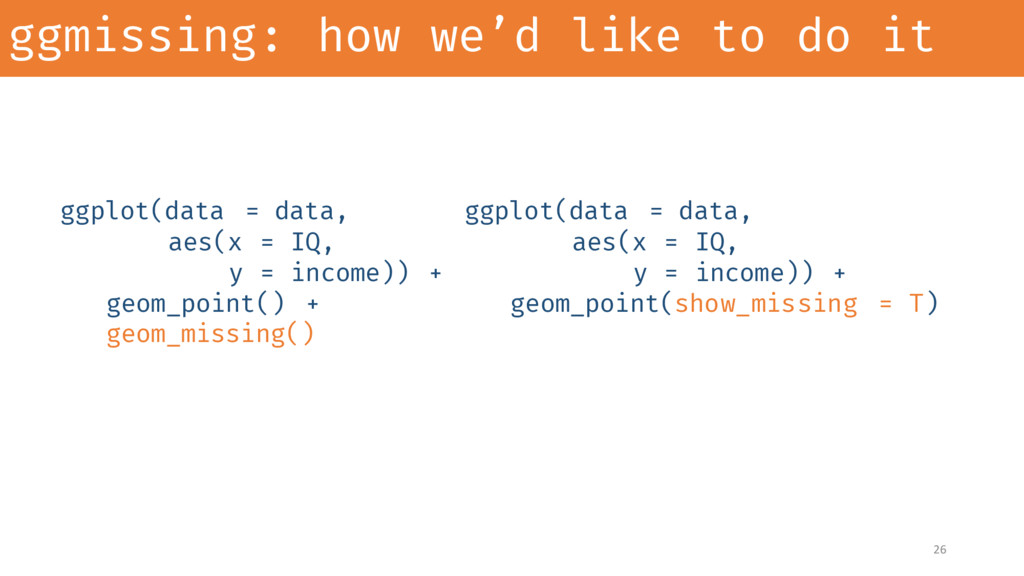
Data cleaning is acknowledged as a major bottleneck in data analysis. Common hurdles include data not in the state expected , and missing data. Two R packages currently under development are presented that assist in widening this bottleneck: ggmissing and visdat. ggmissing extends ggplot2 by allowing it to include missing values, and visdat provides simple functions for visualising whole dataframes, giving a birds eye view of the data. Examples of how these packages can be incorporated into a workflow are then described.

Nicholas Tierney

February 19, 2016
Tweet

More Decks by Nicholas Tierney

Other Decks in Programming

Transcript

  1. Be a Hawk not a Turkey How a Bird’s Eye

    View of your Data Can Streamline Data Analysis Nicholas Tierney PhD Candidate QUT WOMBAT, Melbourne Zoo 19/02/2016
  2. Real data is generally real messy Dates are not dates

    Gender is not Categorical Rows are supposed to be columns Missing data 10
  3. Data inspection: `dplyr::glimpse(dat)` Observations: 300 Variables: 15 $ date (date)

    2015-03-15, 2015-03-... $ name (chr) "Bobby", "Trinidad", ... $ age (int) 21, 28, 31, 30, 23, 2... $ sex (fctr) Female, Female, Fema... $ grade (int) NA, 4, 3, NA, NA, NA,... $ height (dbl) 66, 59, 67, 71, 68, 7... $ hair (fctr) Brown, Red, Blonde, ... $ eye (fctr) Gray, Brown, Blue, H... $ smokes (lgl) FALSE, FALSE, FALSE, ... $ income (chr) NA, "36157.98", "17307.35” $ education (fctr) Regular High School ... $ IQ (fctr) 97, 115, 112, 94, 106... $ employment (int) NA, 1, 4, NA, 1, NA, ... $ race (fctr) Hispanic, Black, Bla... $ religion (fctr) Muslim, Christian, N... 12
  4. ggmissing ggplot(data = dat, aes(x = IQ , y =

    income)) + geom_point() Warning message: Removed 142 rows containing missing values(geom_point). 23
  5. ggmissing: how to do it 25 dat %>% mutate(miss_cat =

    miss_cat(., "IQ", "income")) %>% ggplot(data = ., aes(x = shadow_shift(IQ), y = shadow_shift(income), colour = miss_cat)) + geom_point()
  6. ggmissing: how we’d like to do it 26 ggplot(data =

    data, aes(x = IQ, y = income)) + geom_point() + geom_missing() ggplot(data = data, aes(x = IQ, y = income)) + geom_point(show_missing = T)
  7. Future Work: visdat Colour cells intelligently Guess what kind a

    variable is Read in horrible messy data Include interactivity Think about ways to sensibly encode summary / value information Pipe in expectations 28
  8. Future Work: ggmissing Early days yet Create a philosophy /

    grammar of missingness Don’t re-write ggplot Include rug plot to show missing data Develop clear/intuitive ways of visualising missing values 29
  9. Got an idea or want to help? Check out our

    github github.com/tierneyn/visdat github.com/tierneyn/ggmissing
  10. 33

  11. Questions? I caught a glimpse of happiness, And saw it

    was a bird on a branch, Fixing to take wing - Richard Peck 34