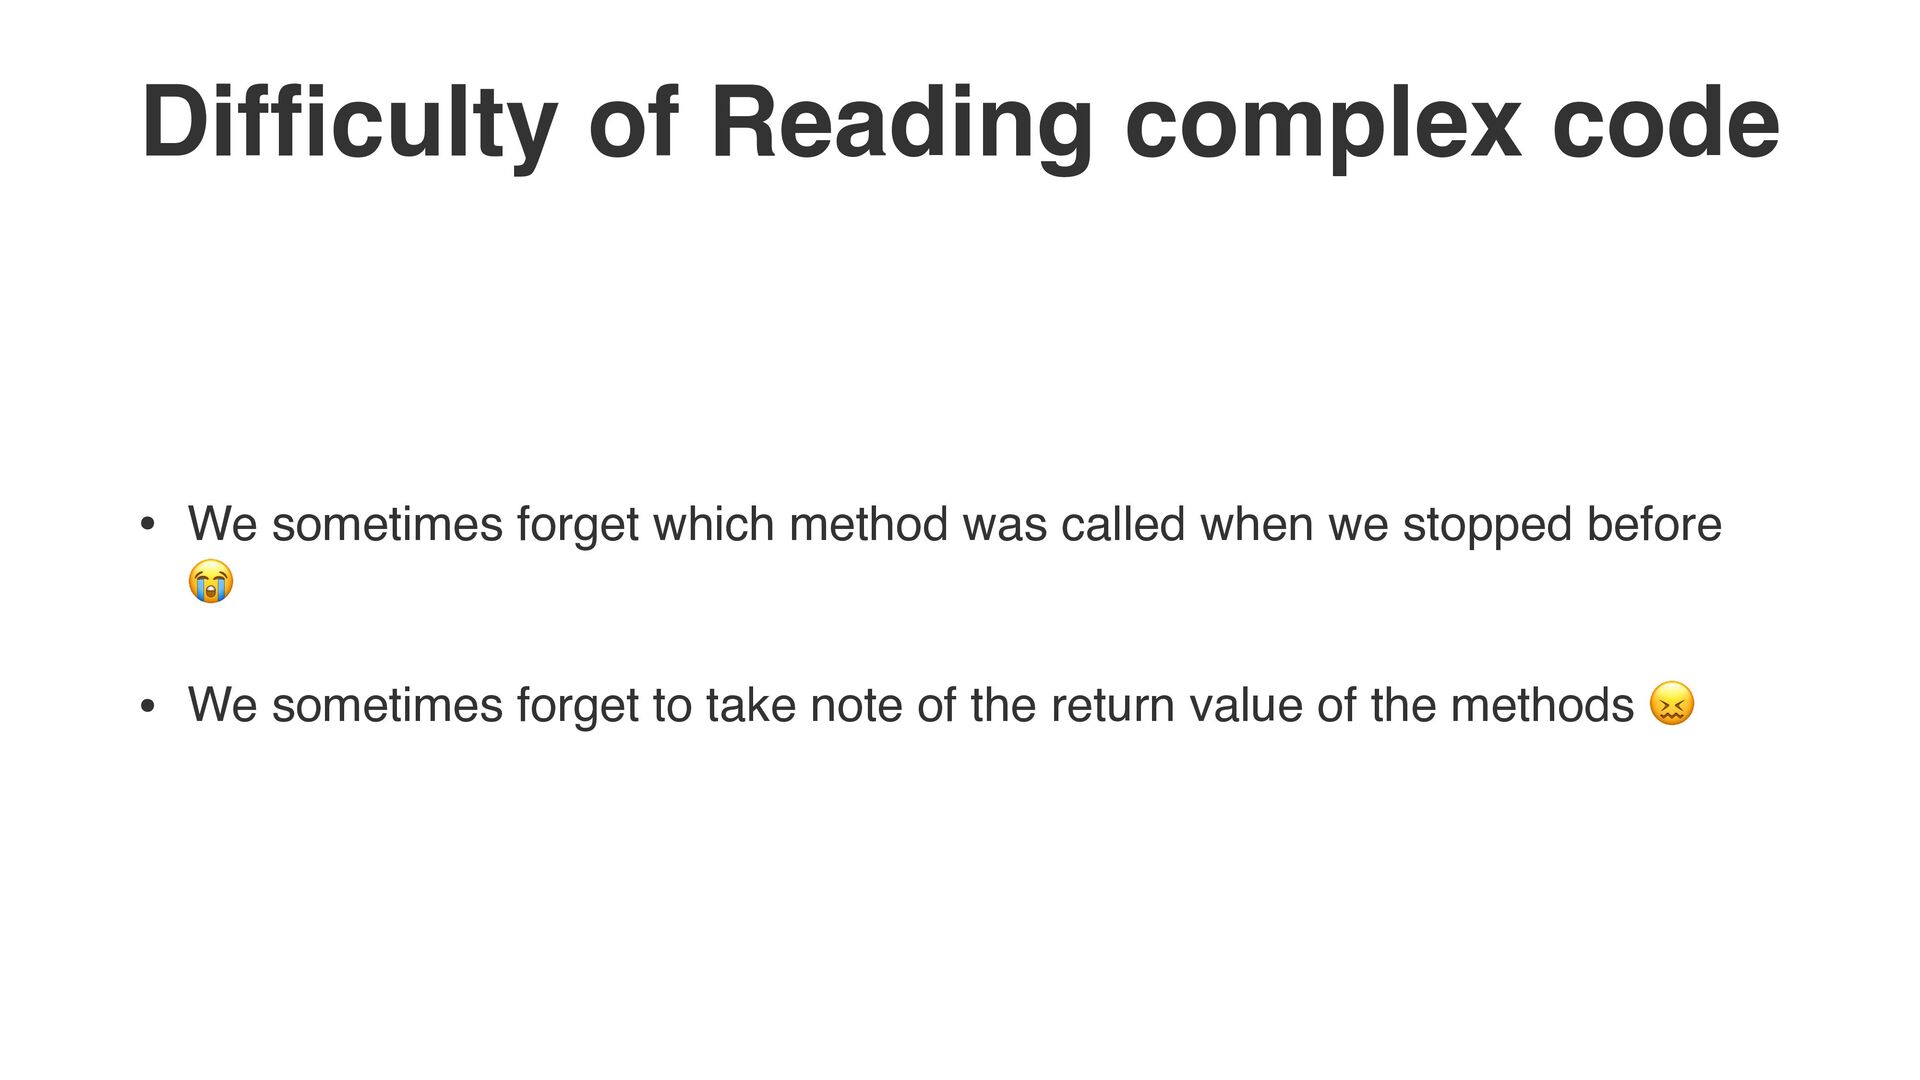
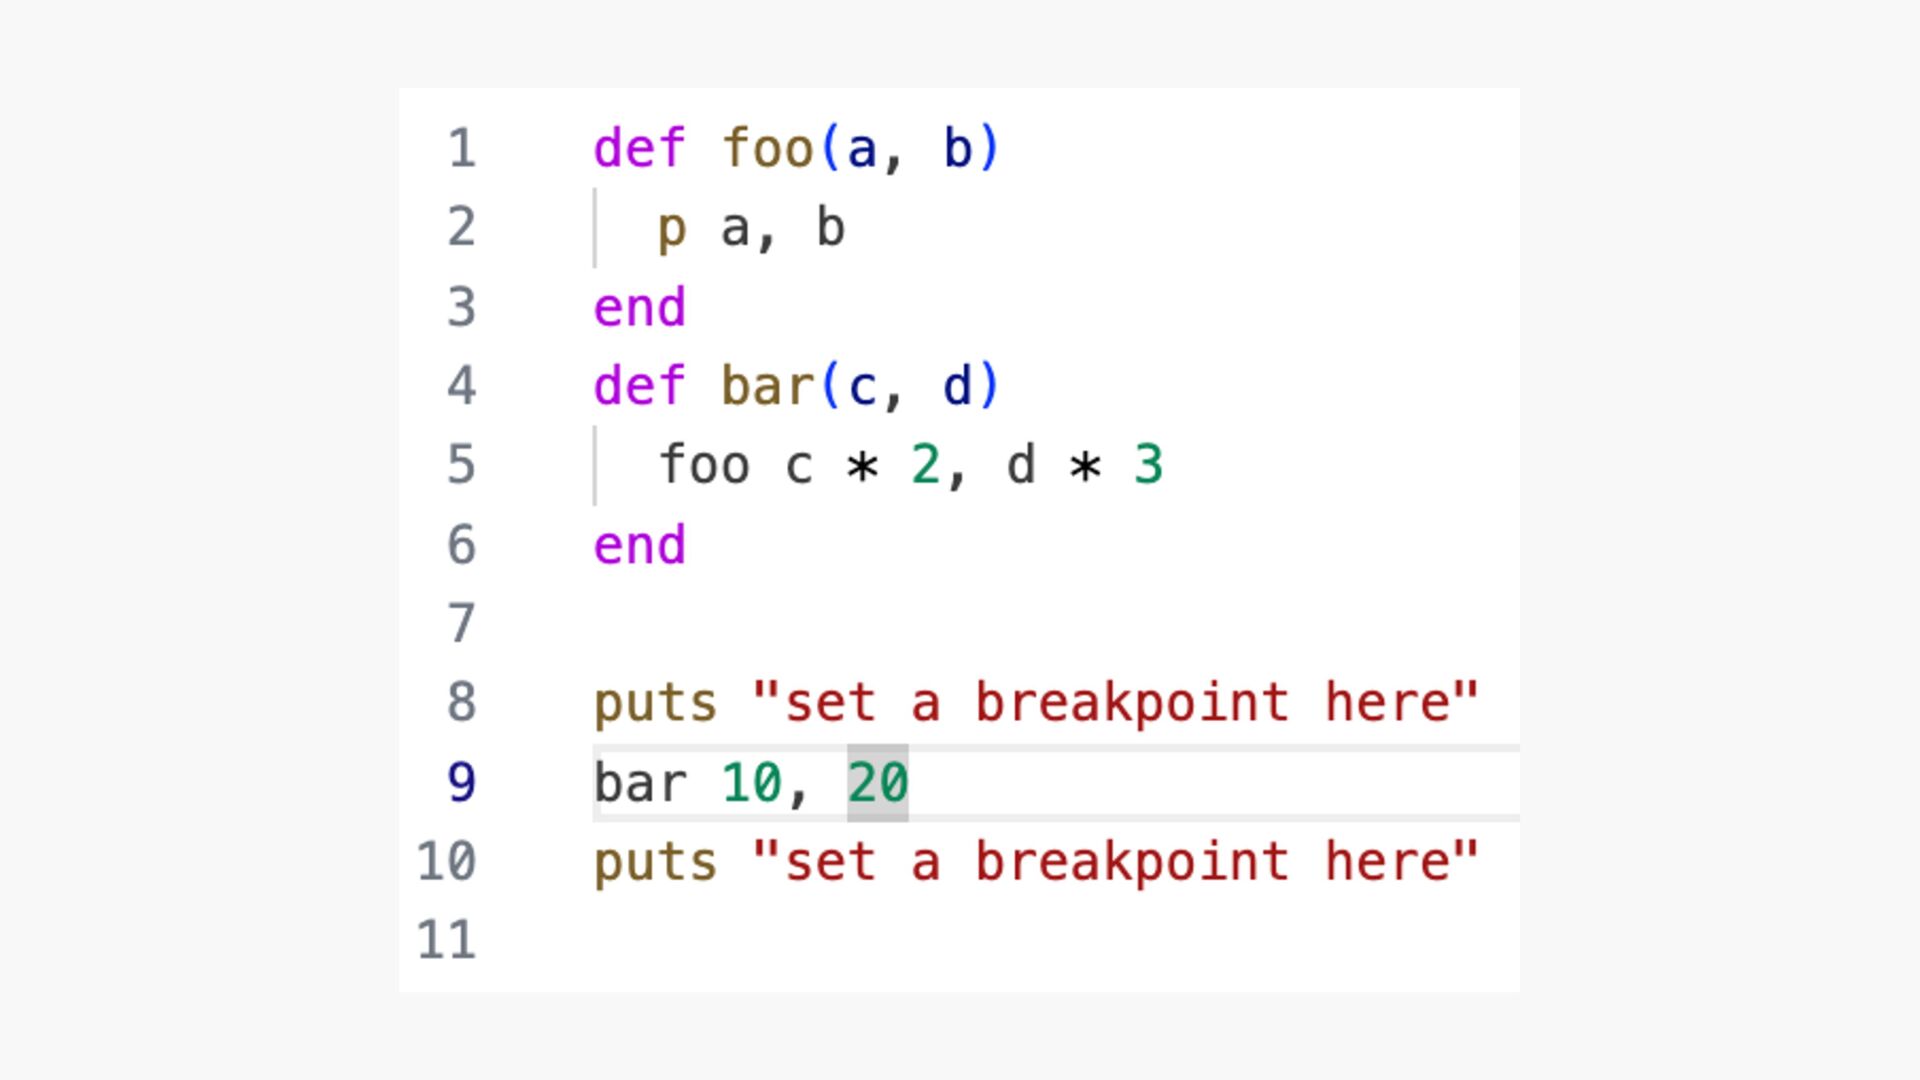
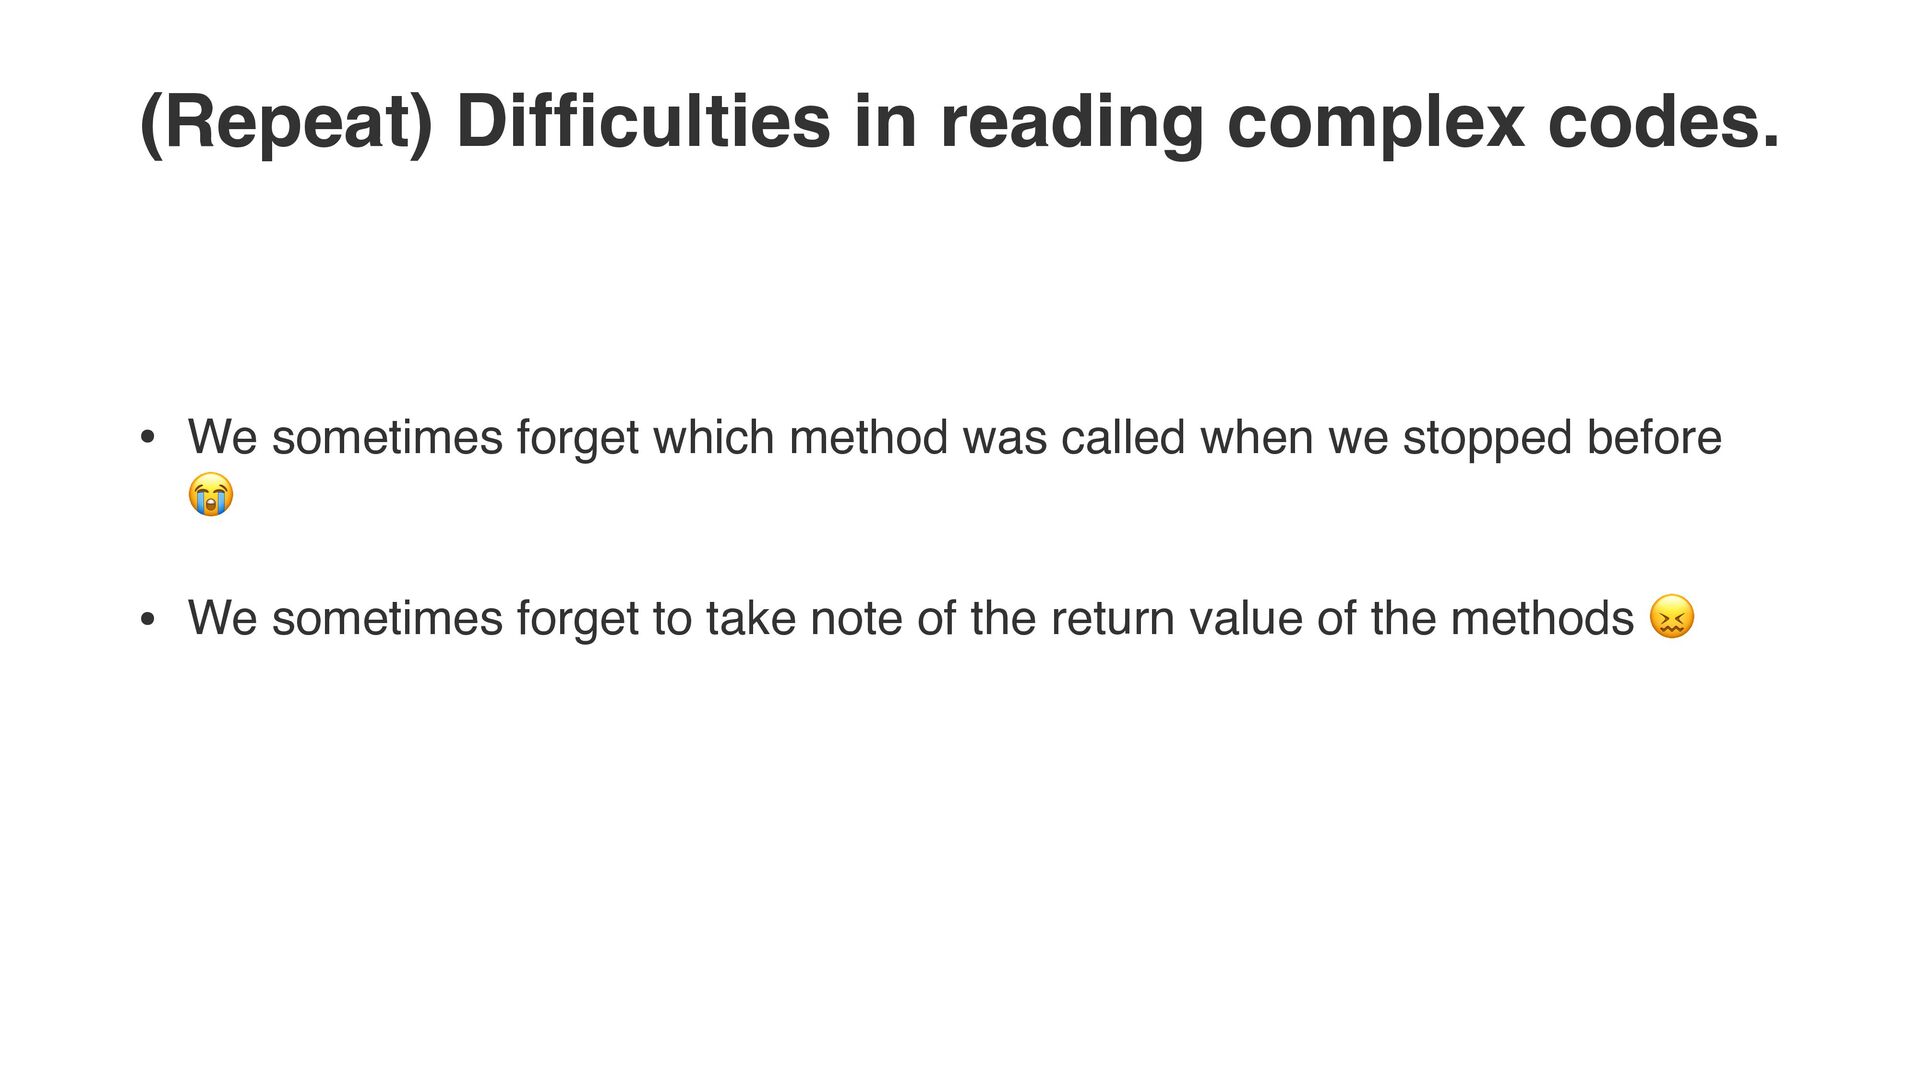
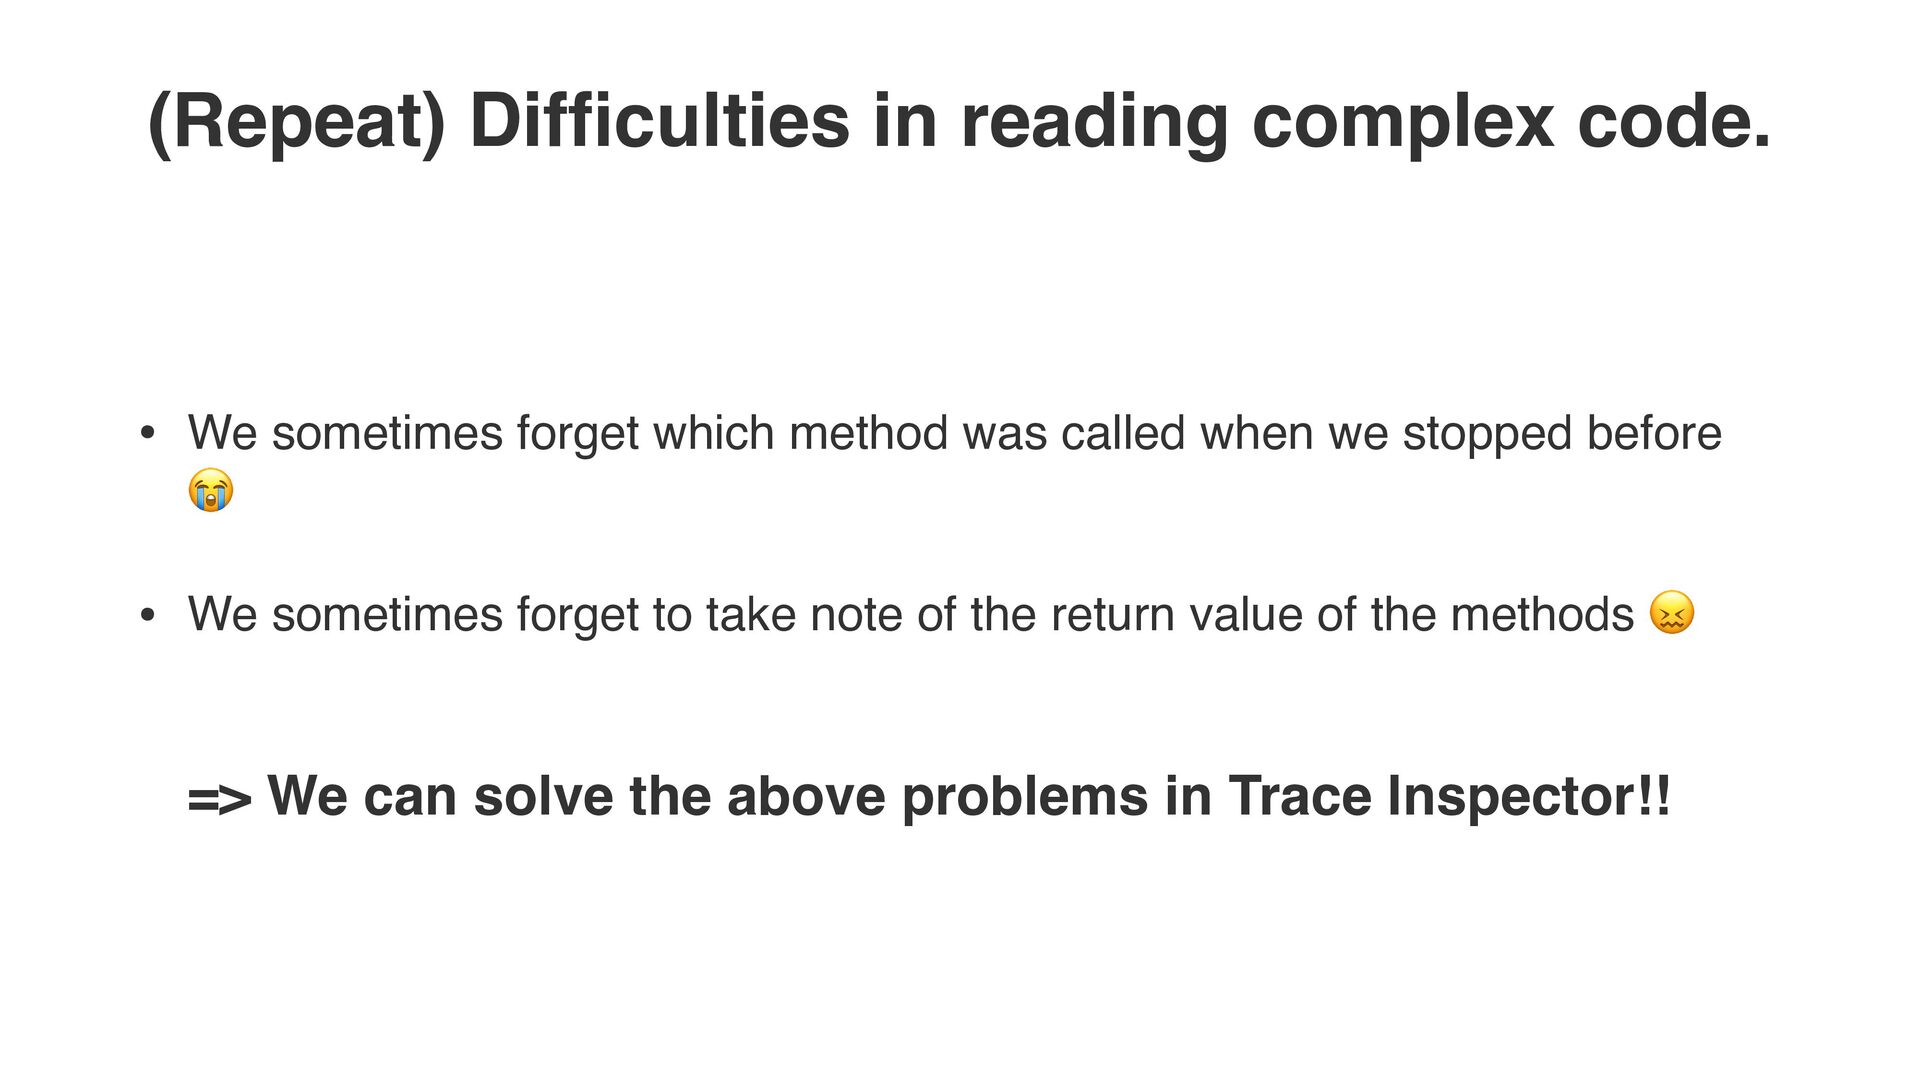
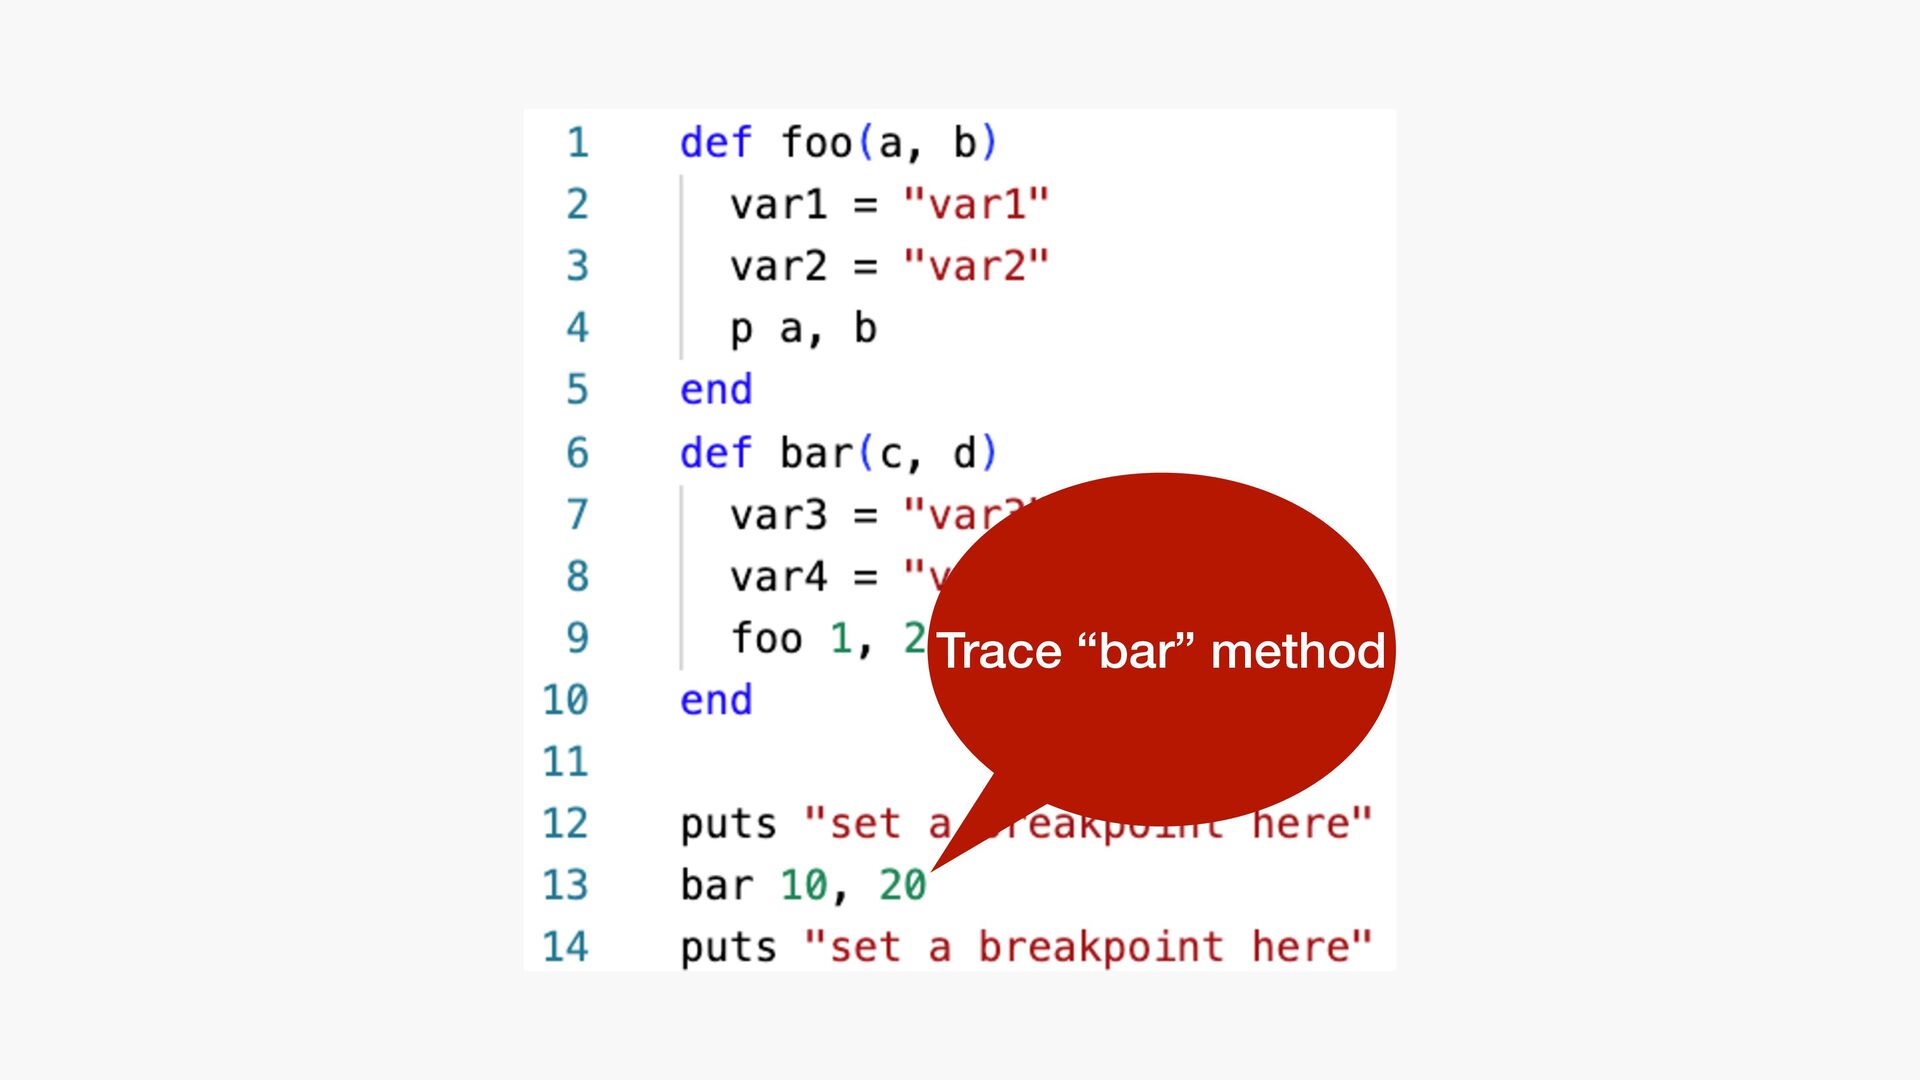
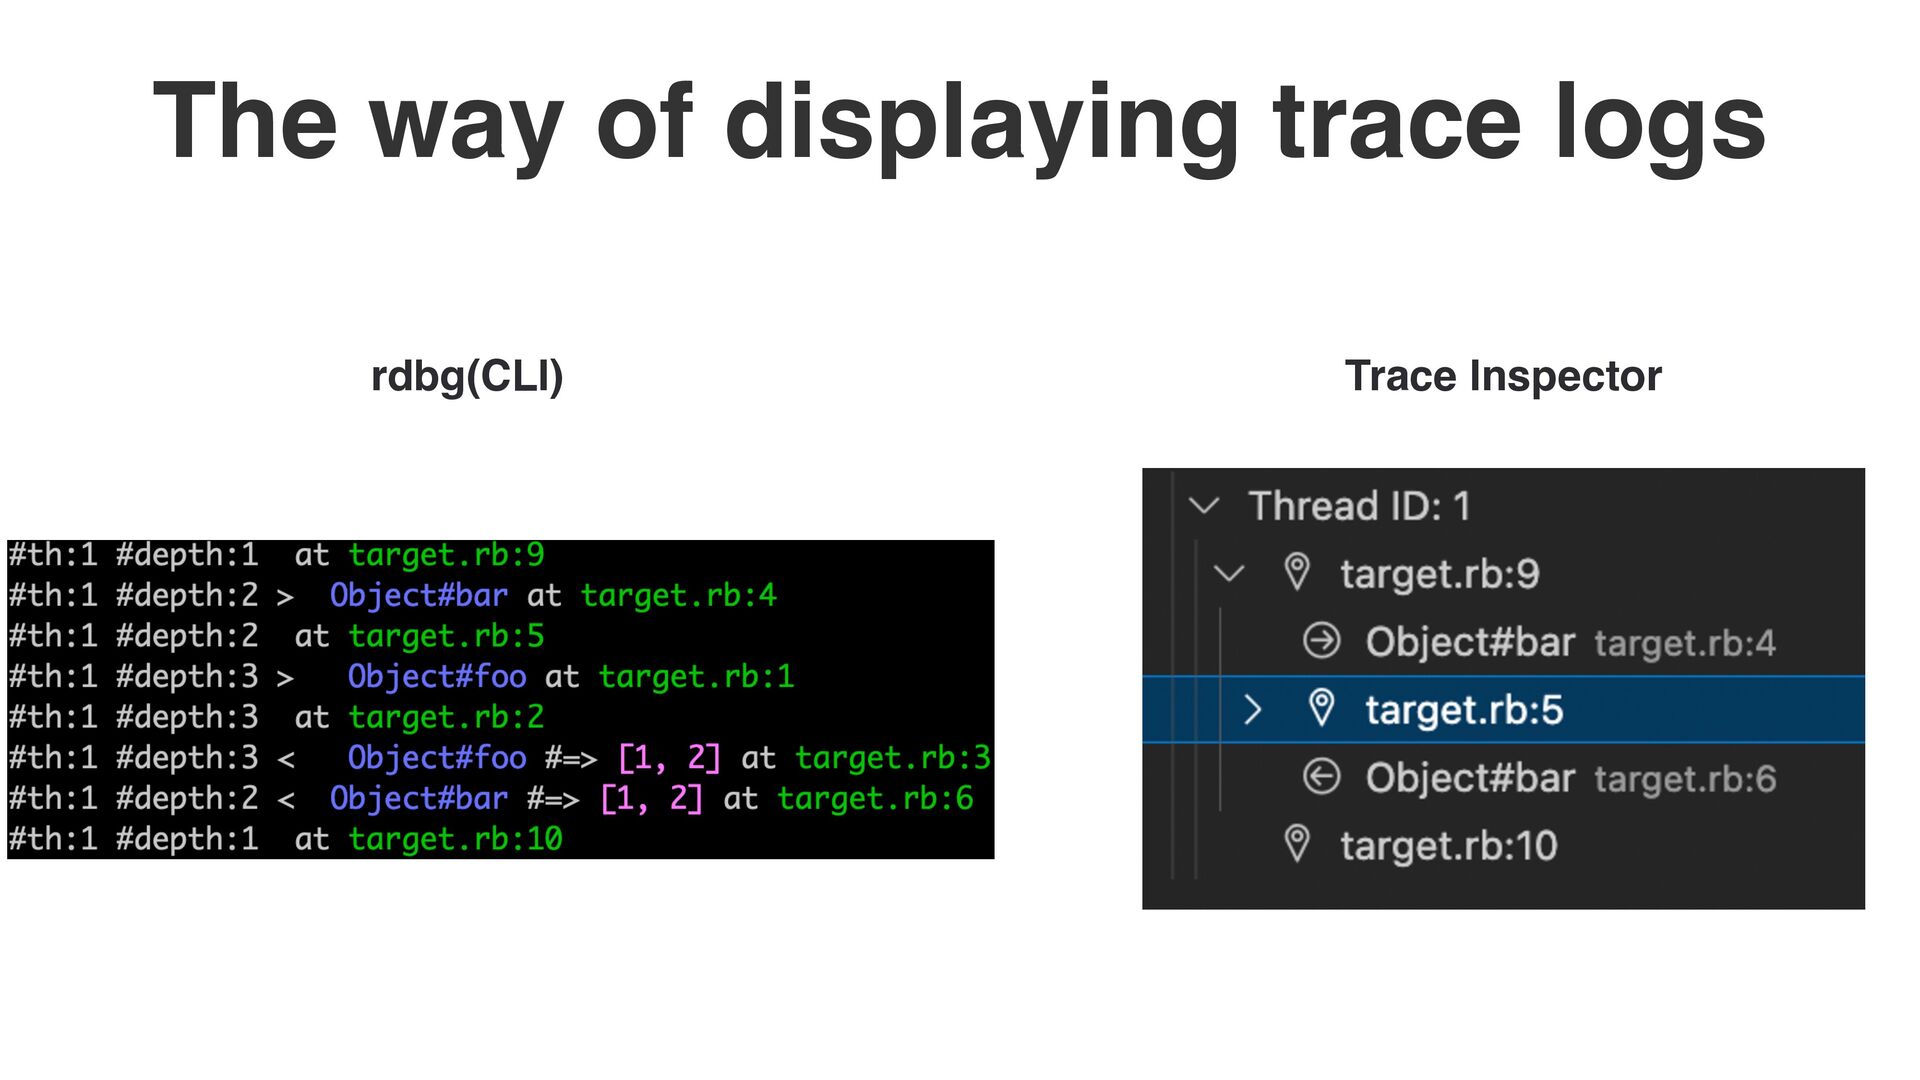
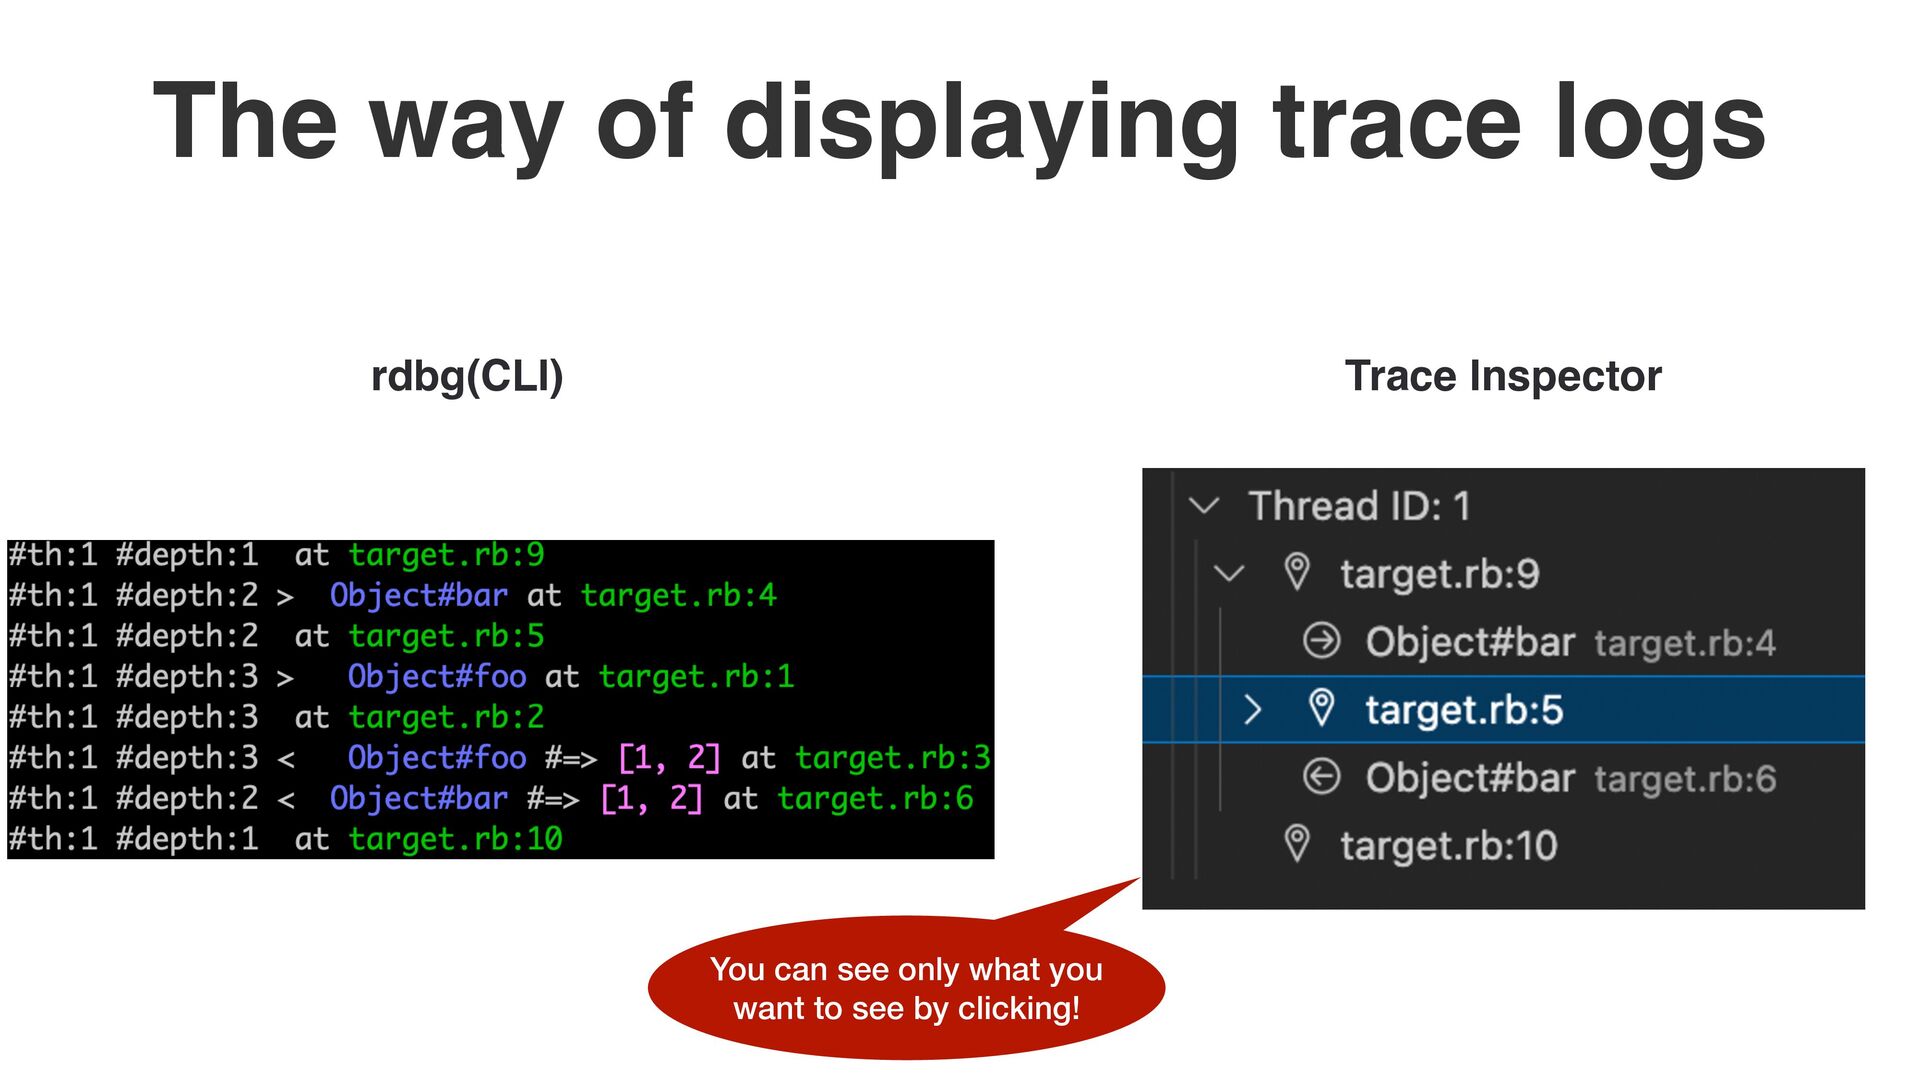
sometimes forget which method was called when we stopped before 😭 • We sometimes forget to take note of the return value of the methods 😖 => We can solve the above problems in Trace Inspector!!
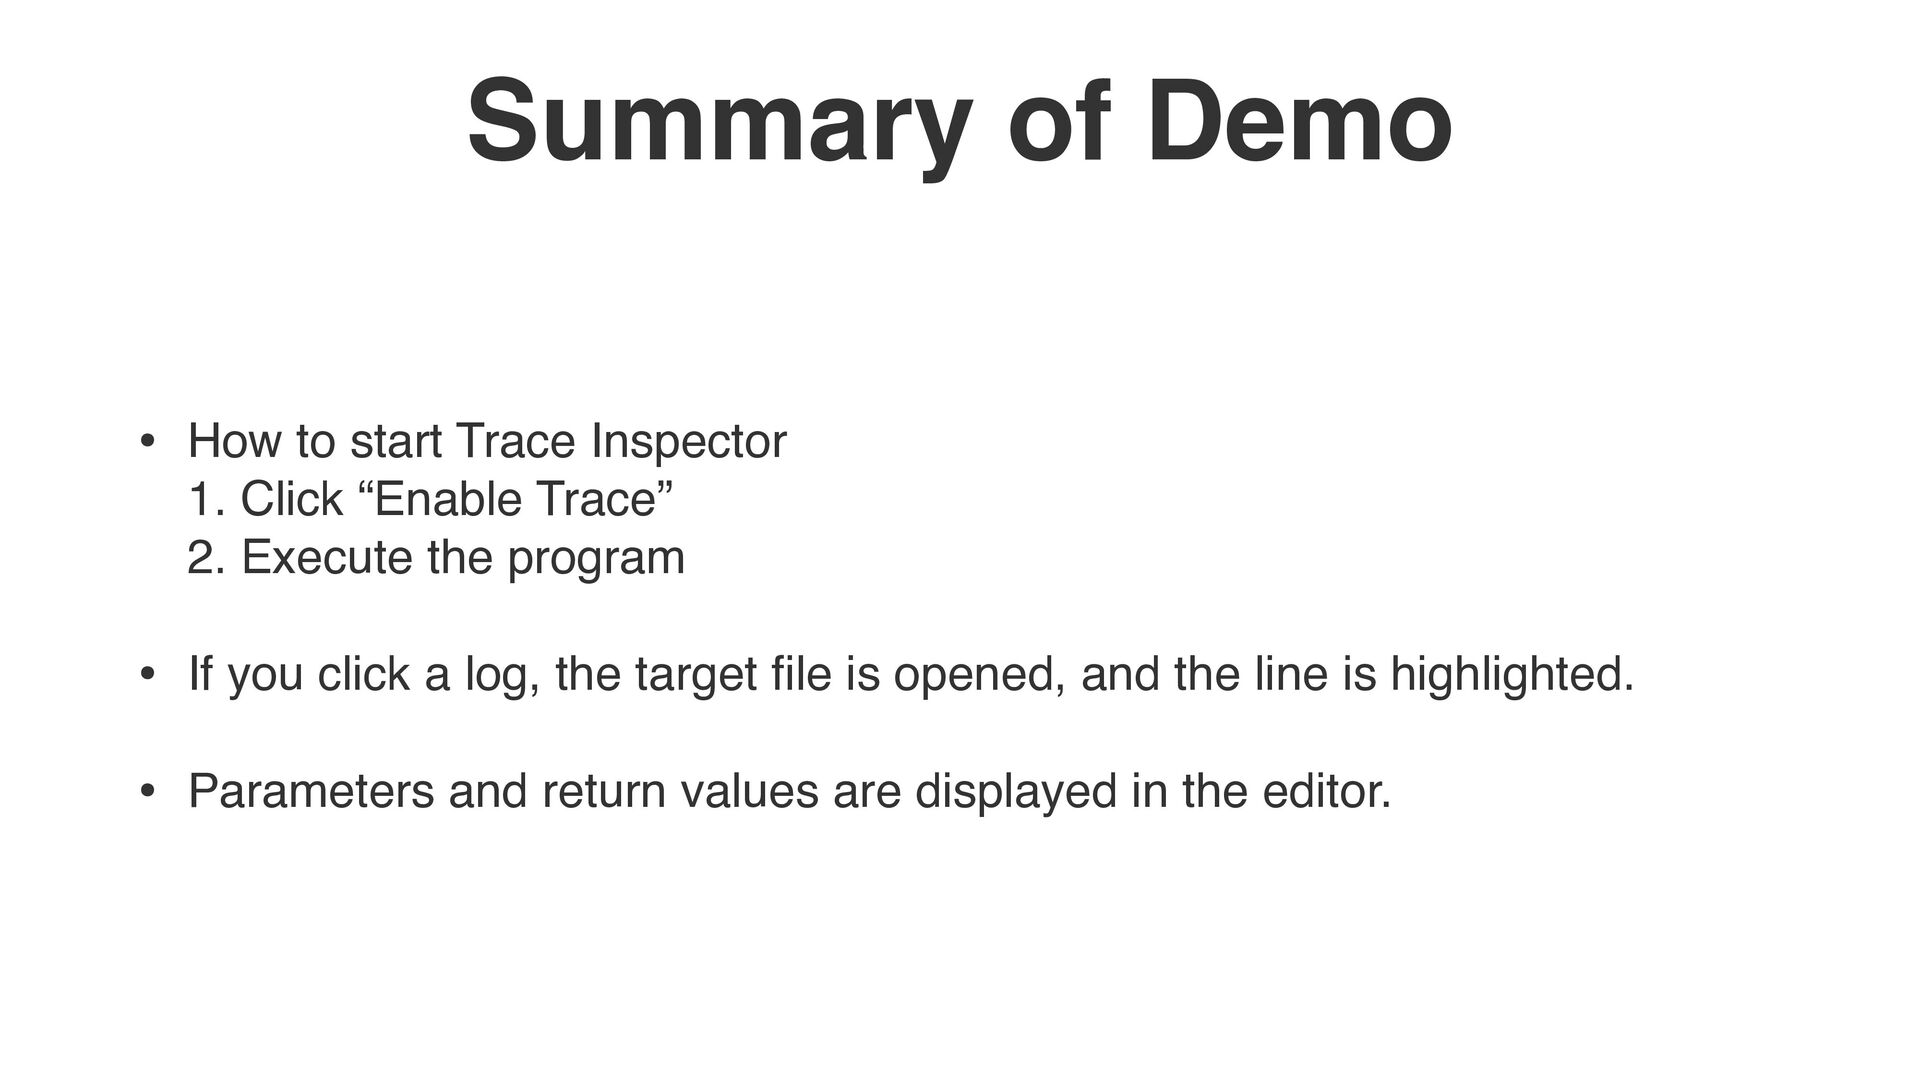
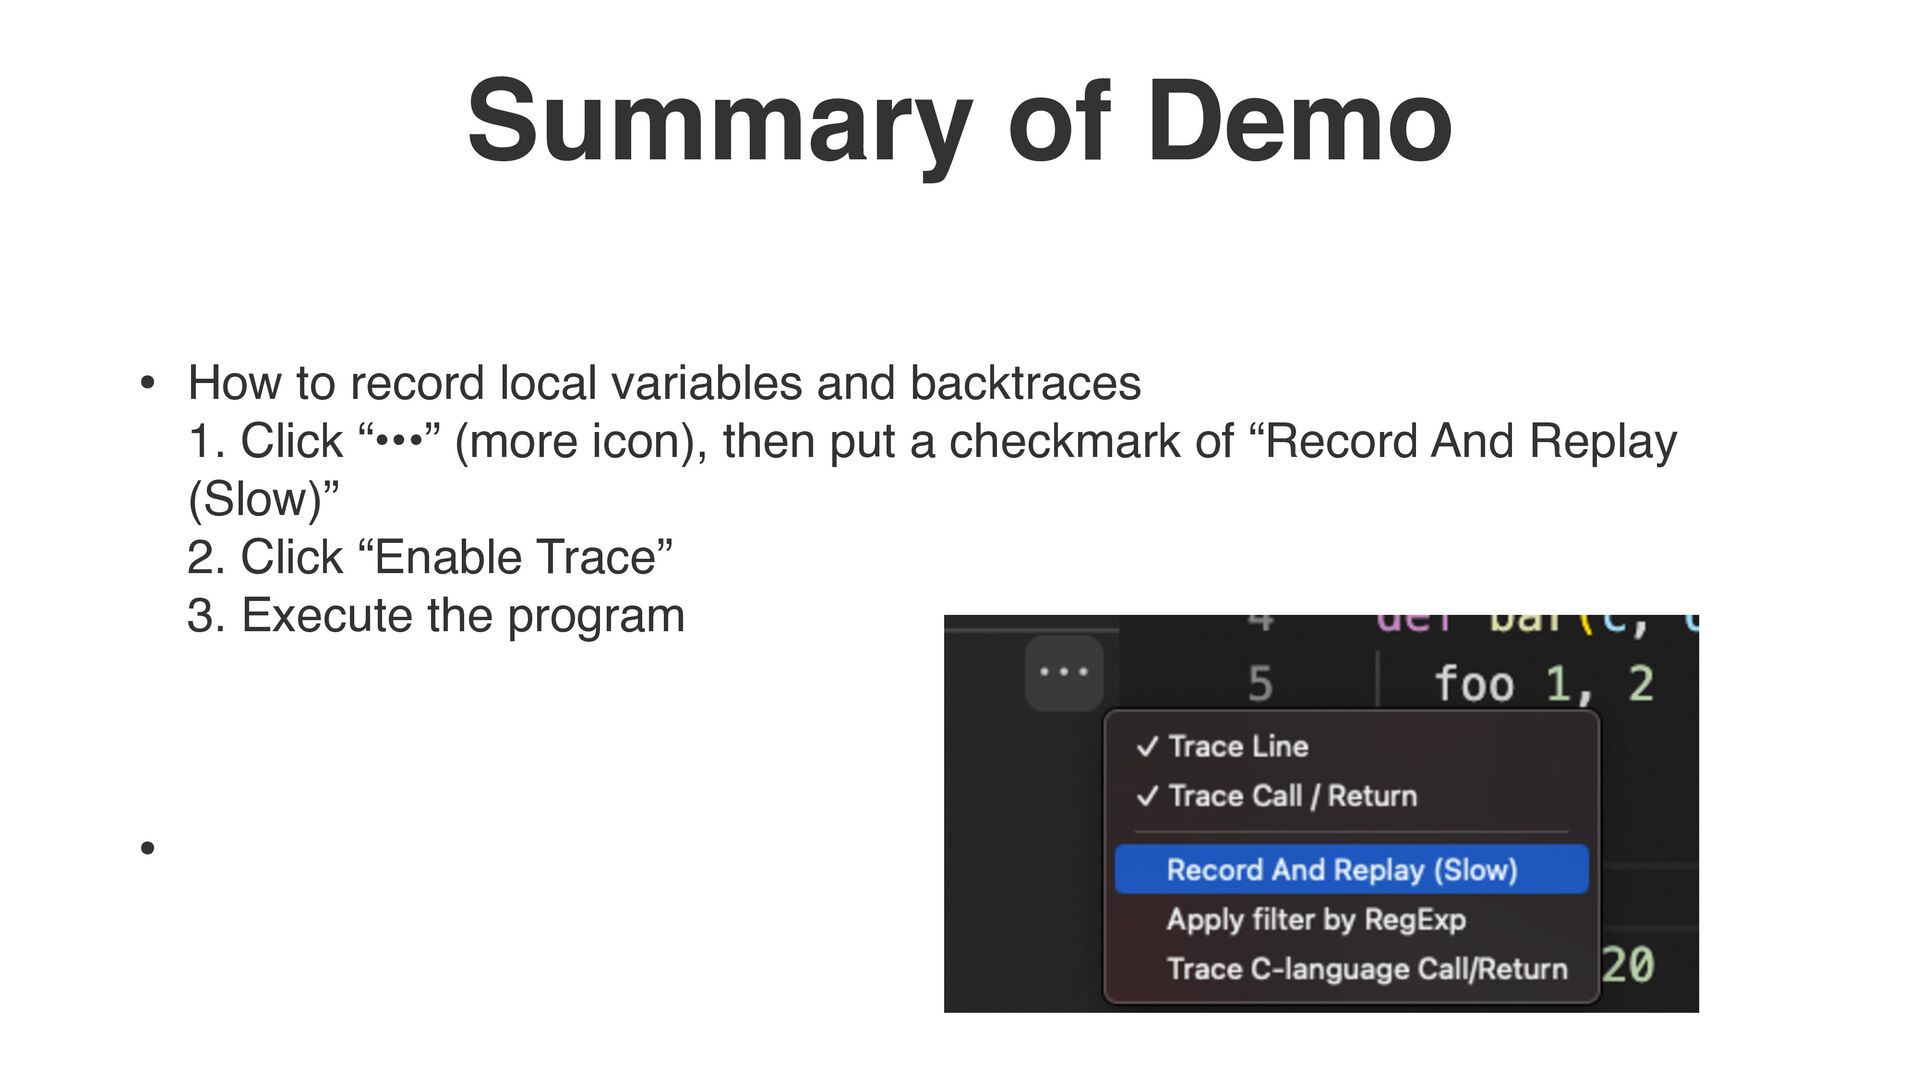
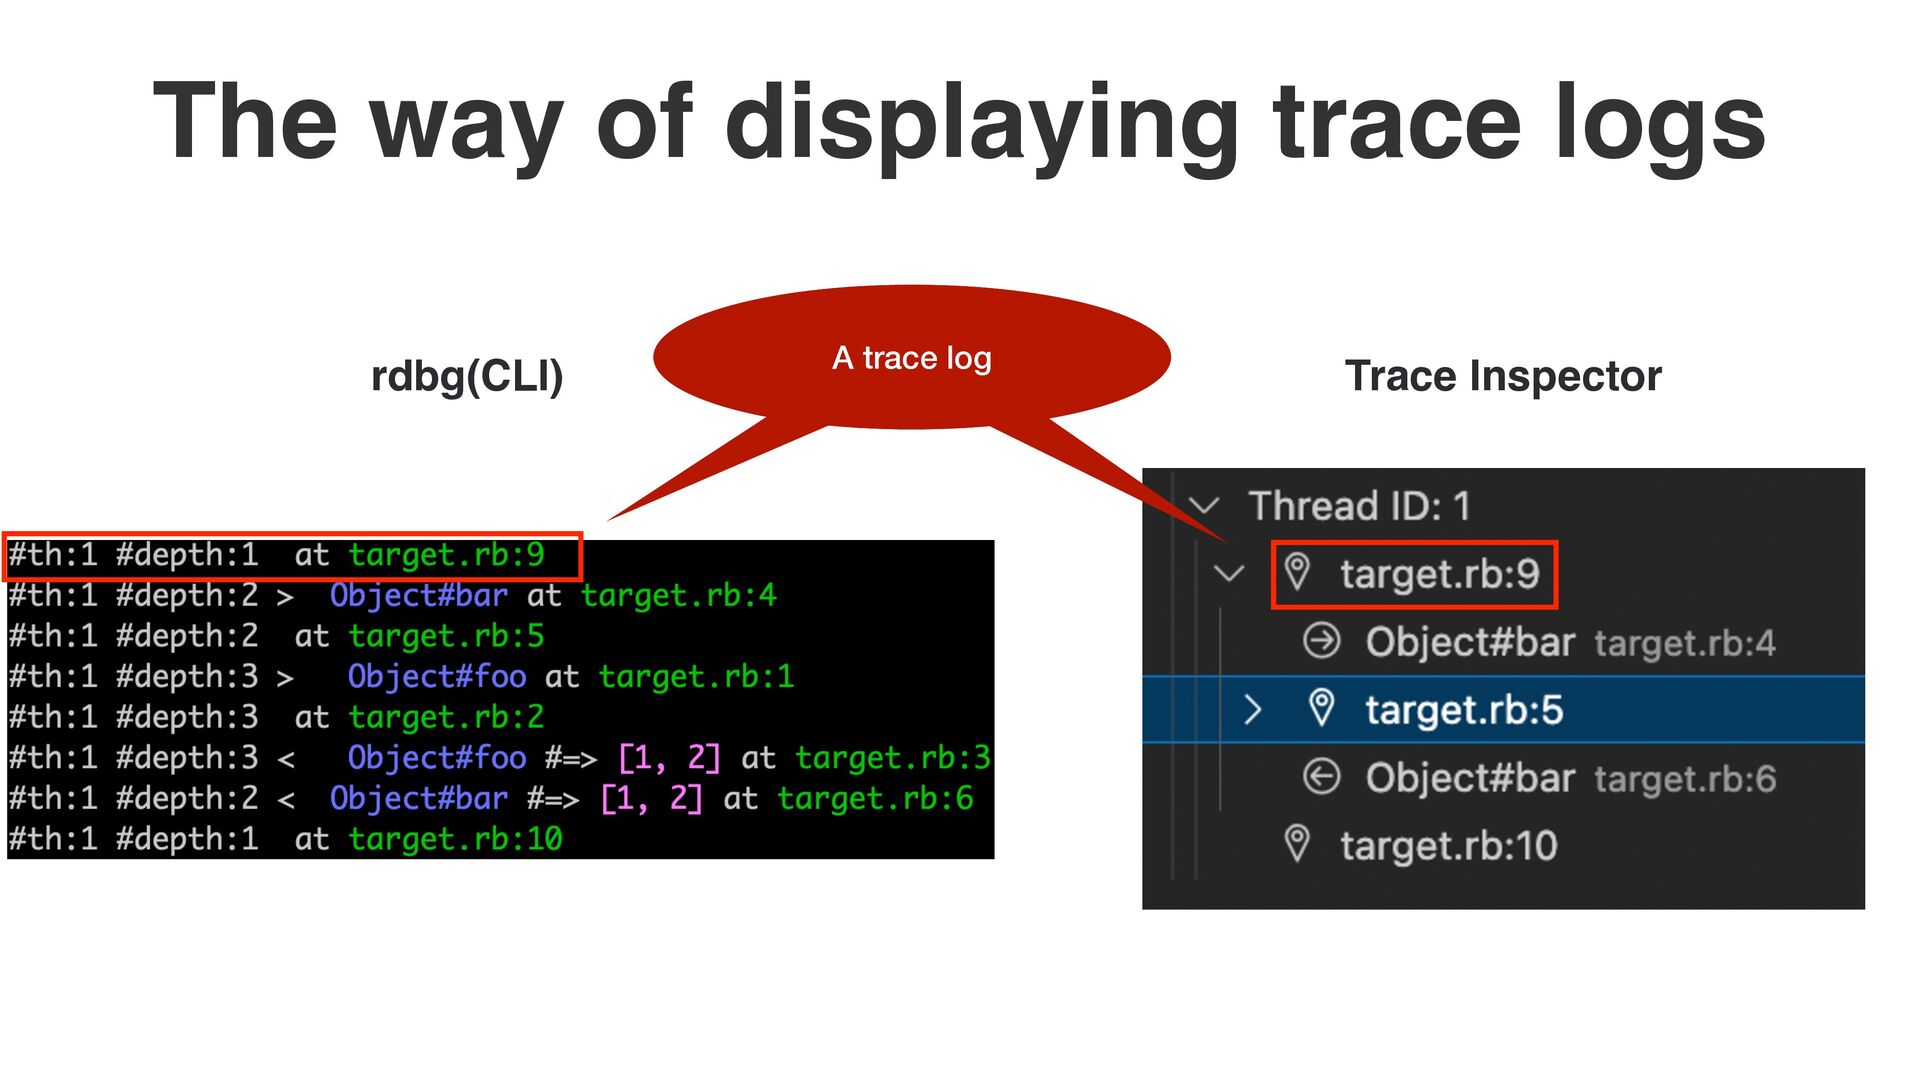
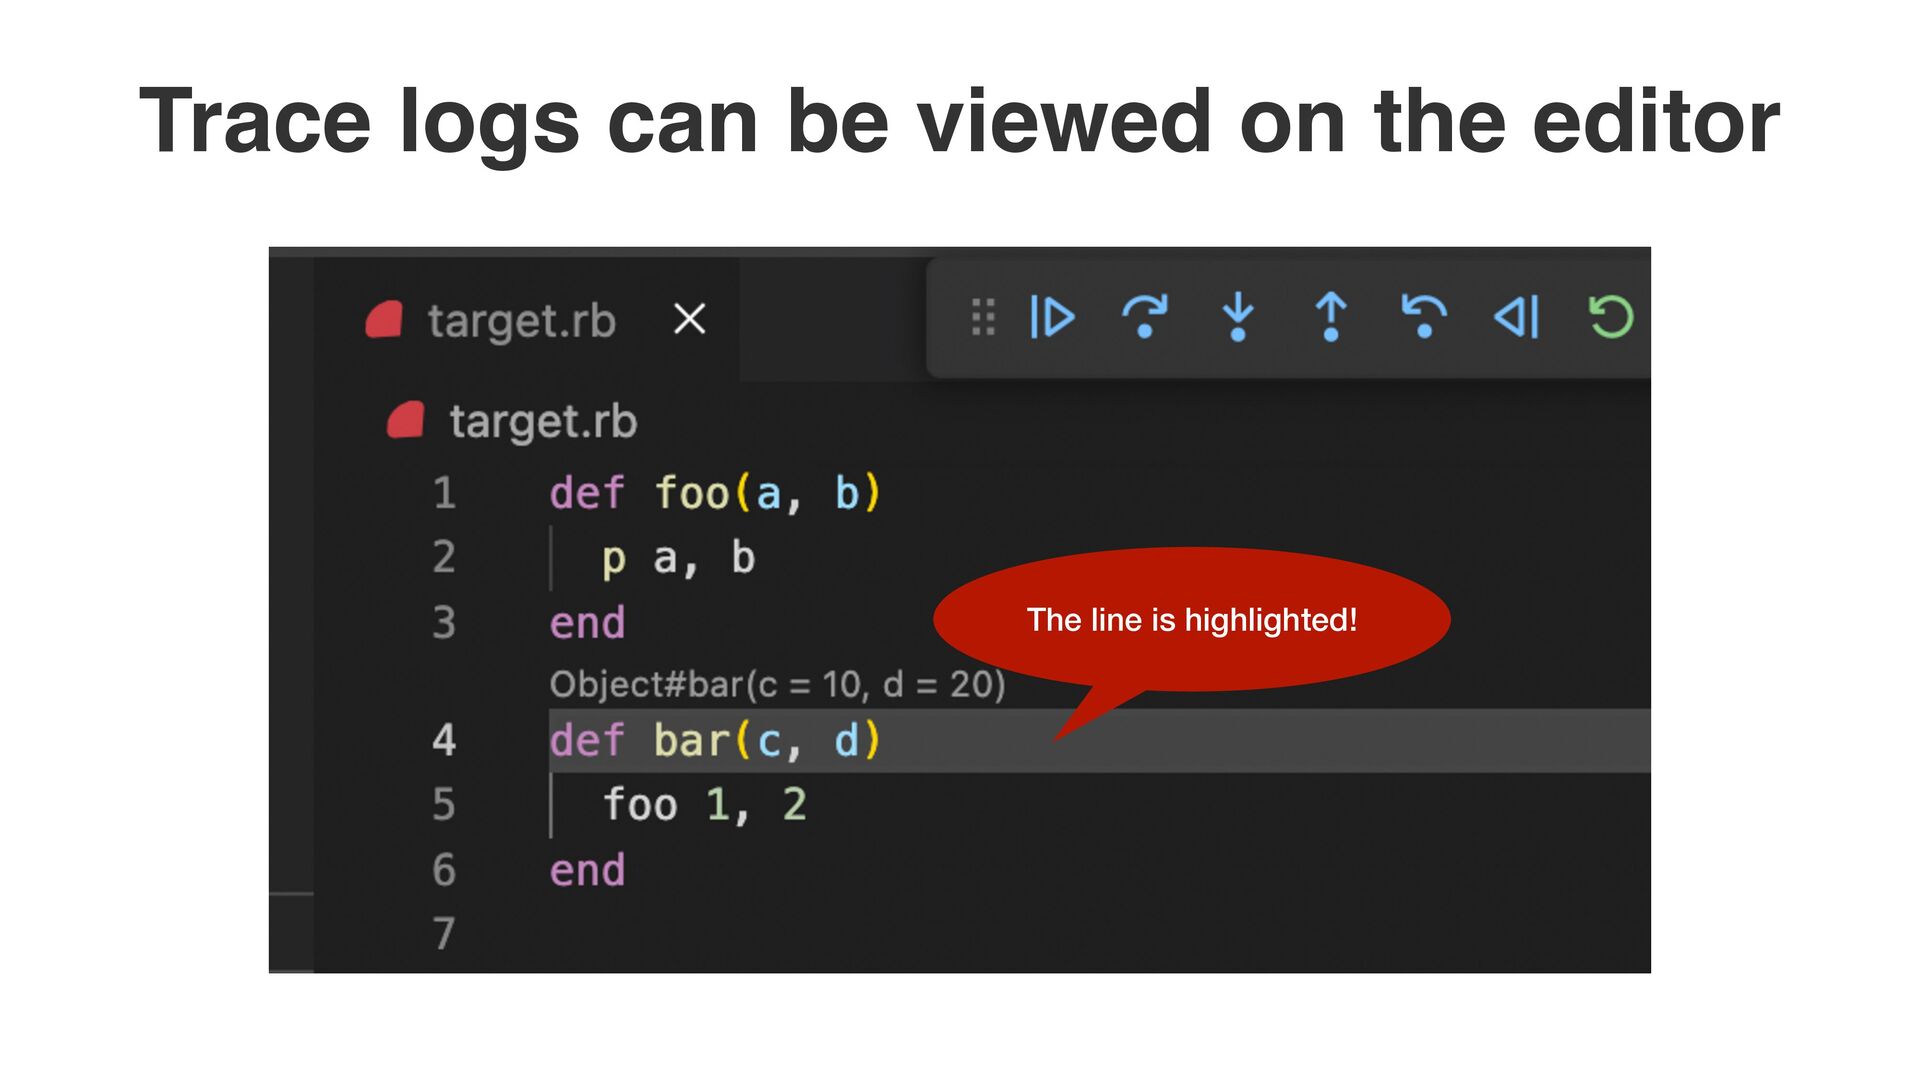
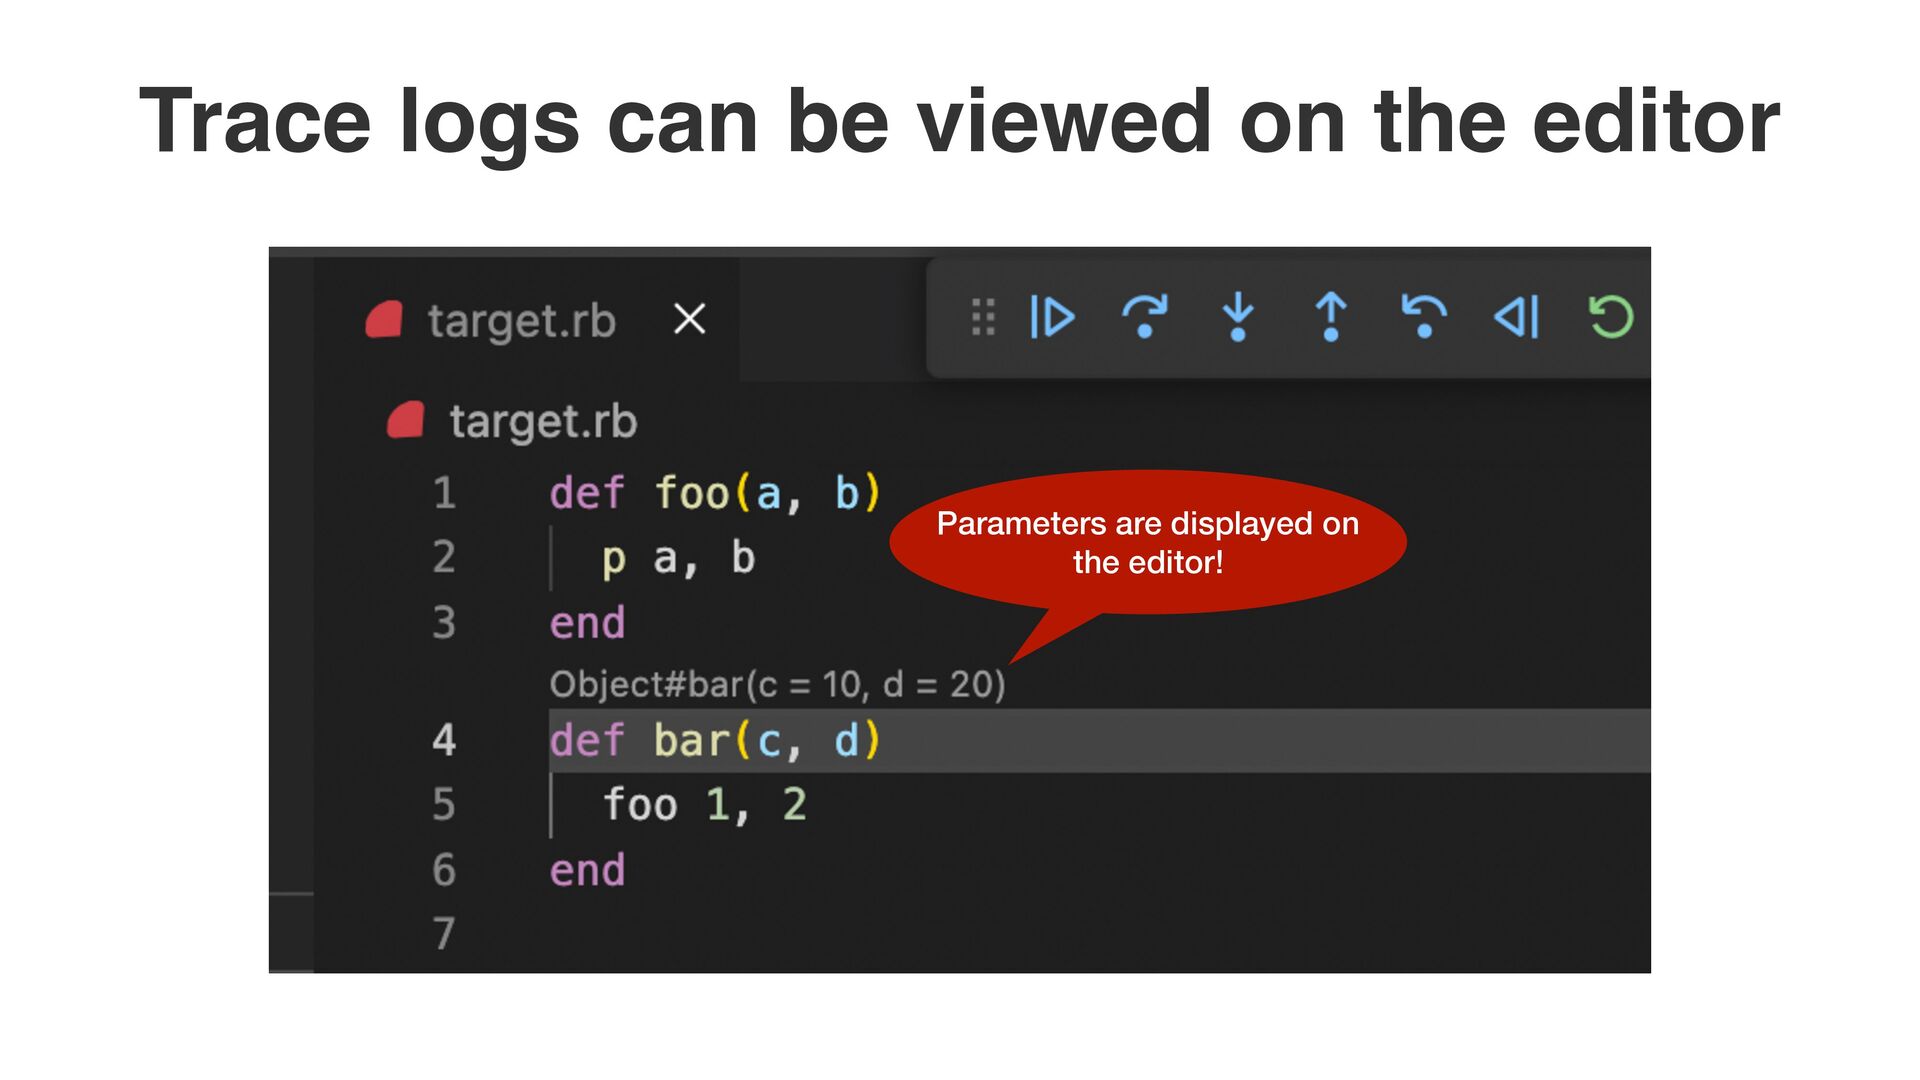
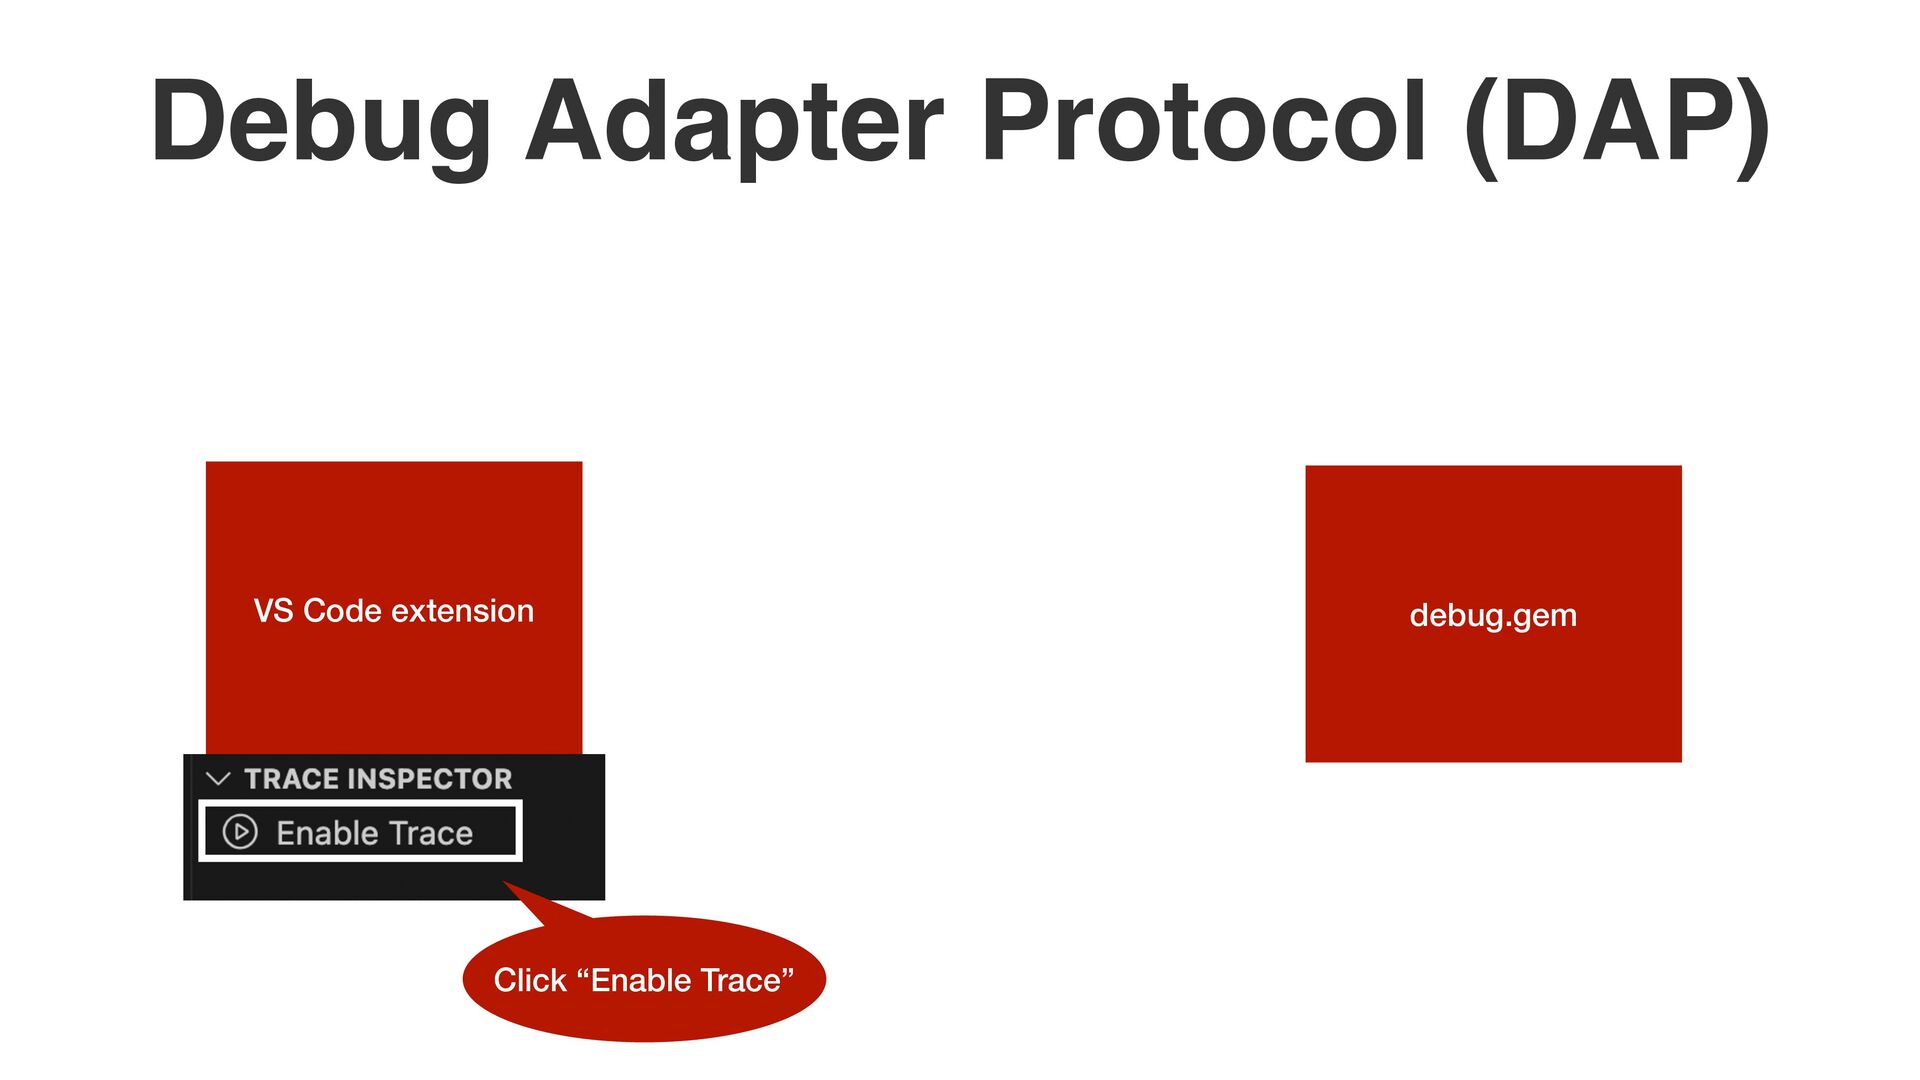
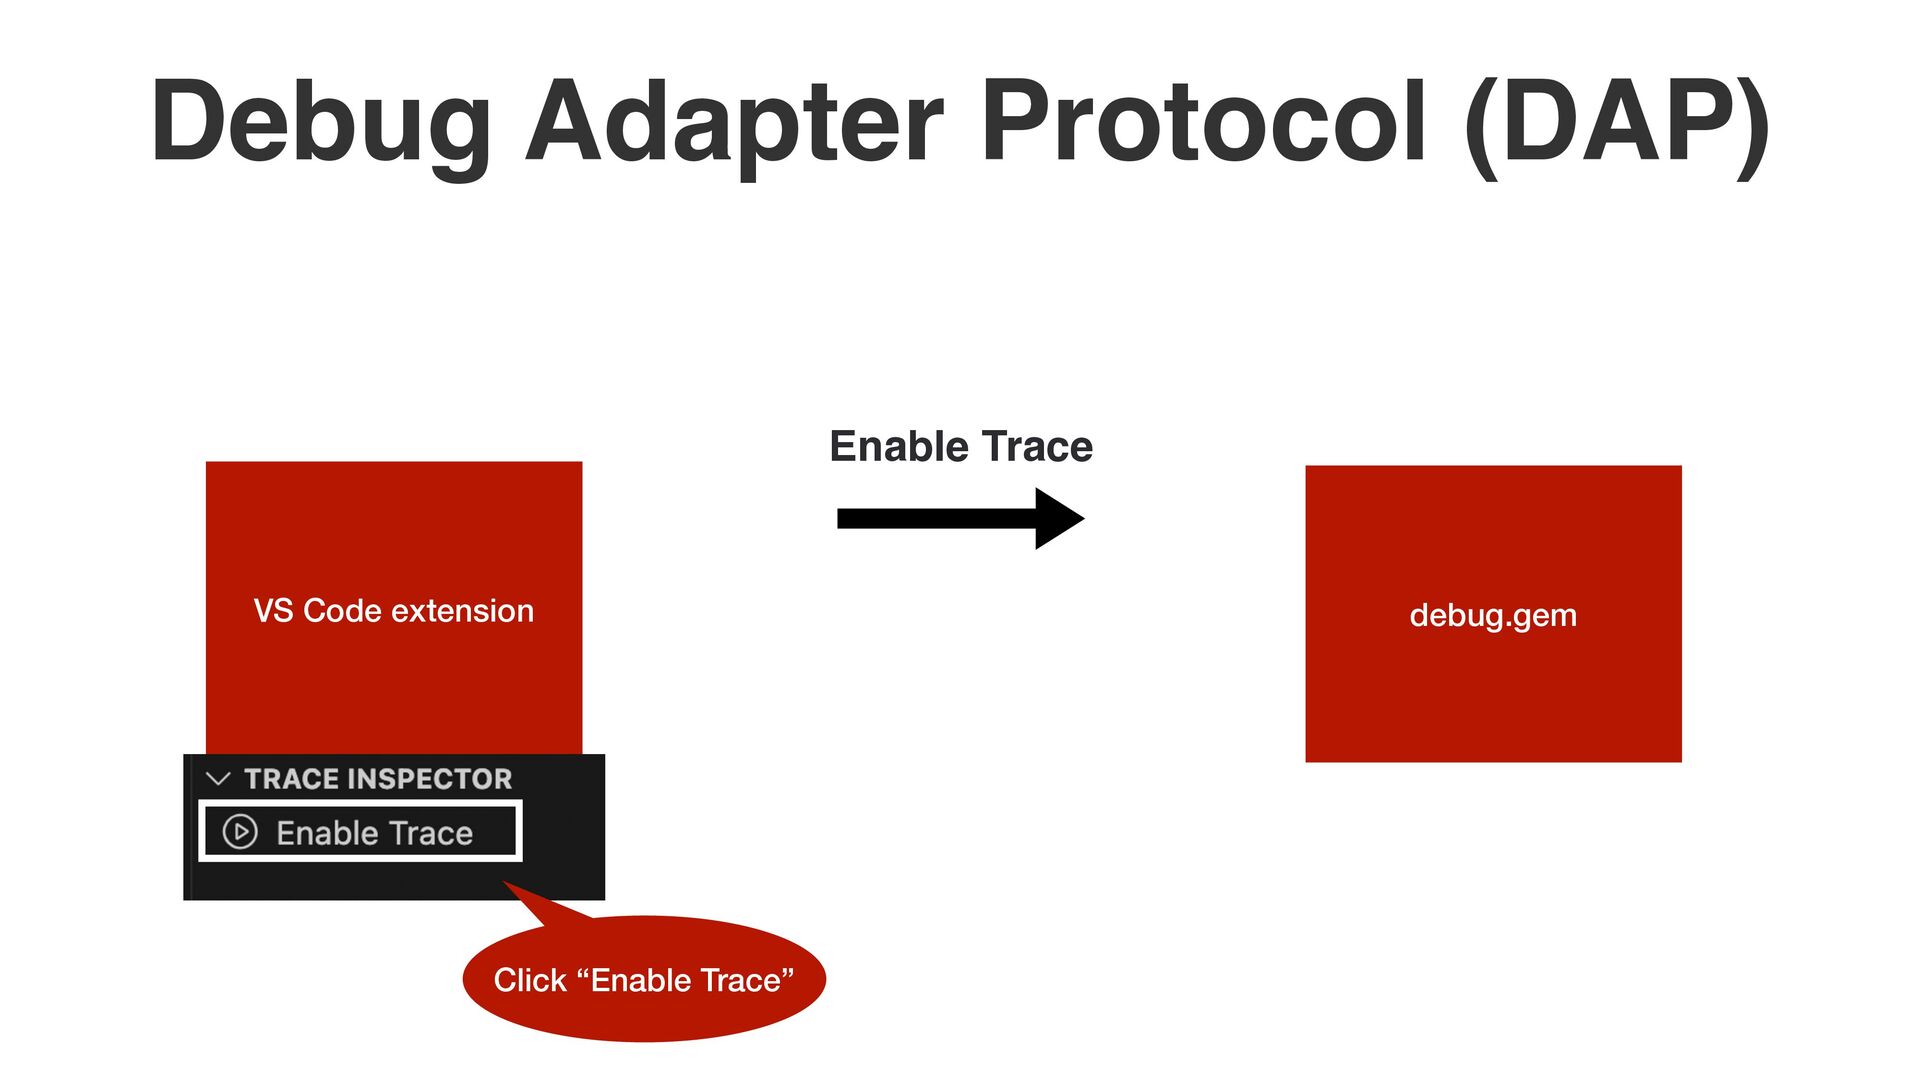
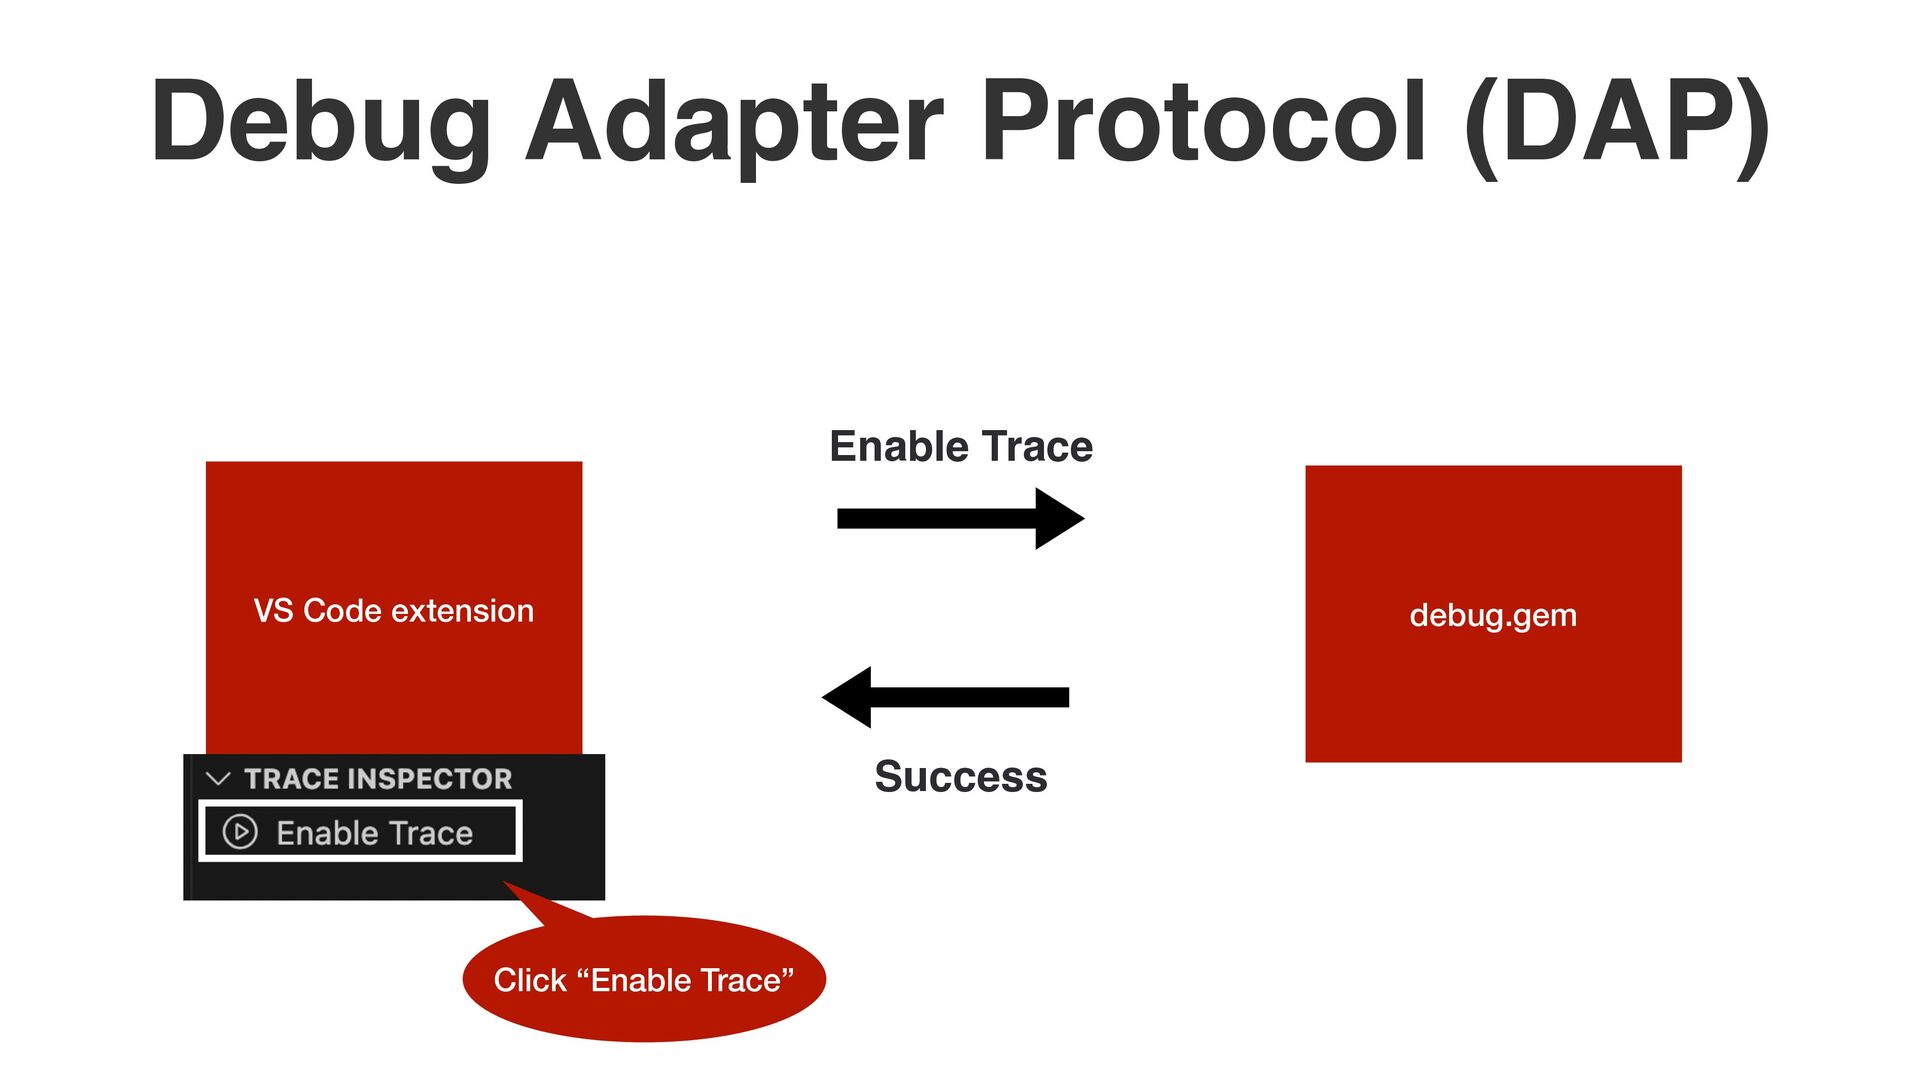
Click “Enable Trace” 2. Execute the program • If you click a log, the target fi le is opened, and the line is highlighted. • Parameters and return values are displayed in the editor.
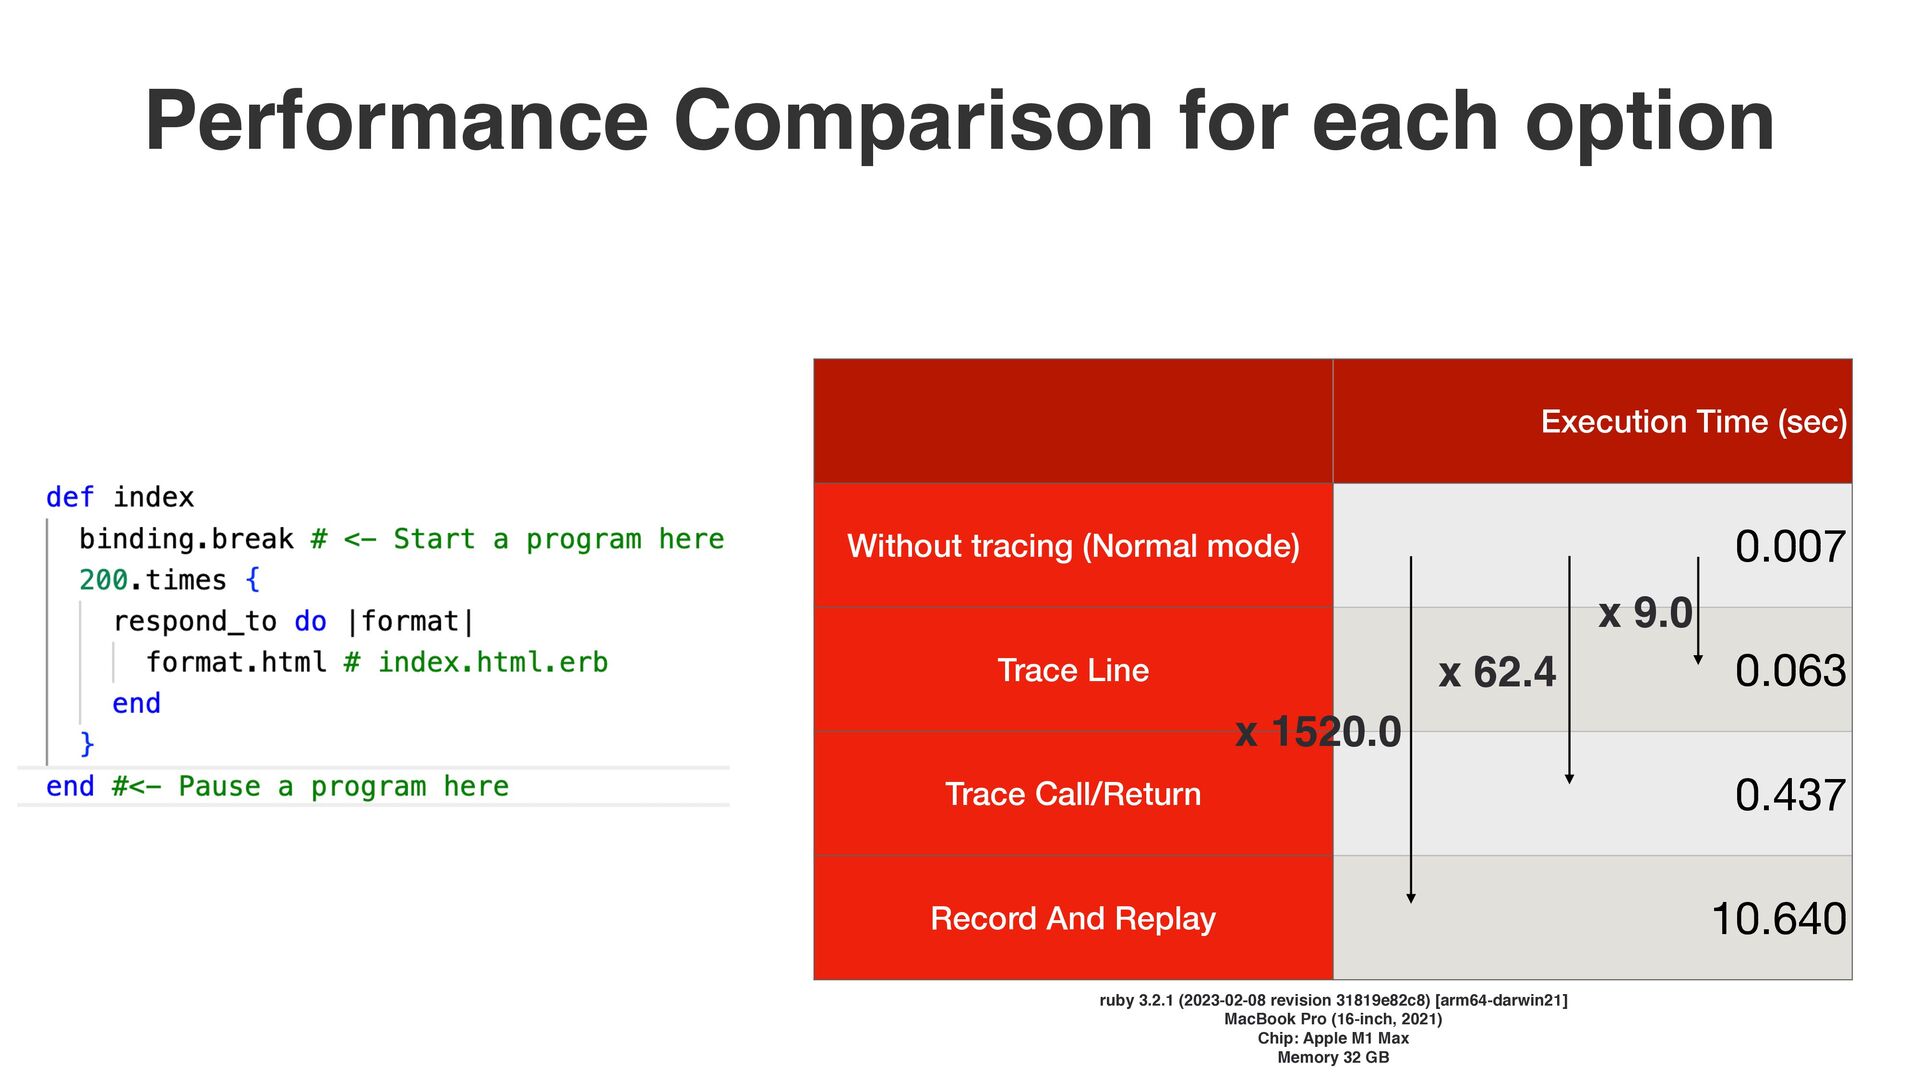
(Normal mode) 0.007 Trace Line 0.063 Trace Call/Return 0.437 Record And Replay 10.640 x 9.0 x 62.4 x 1520.0 ruby 3.2.1 (2023-02-08 revision 31819e82c8) [arm64-darwin21] MacBook Pro (16-inch, 2021) Chip: Apple M1 Max Memory 32 GB
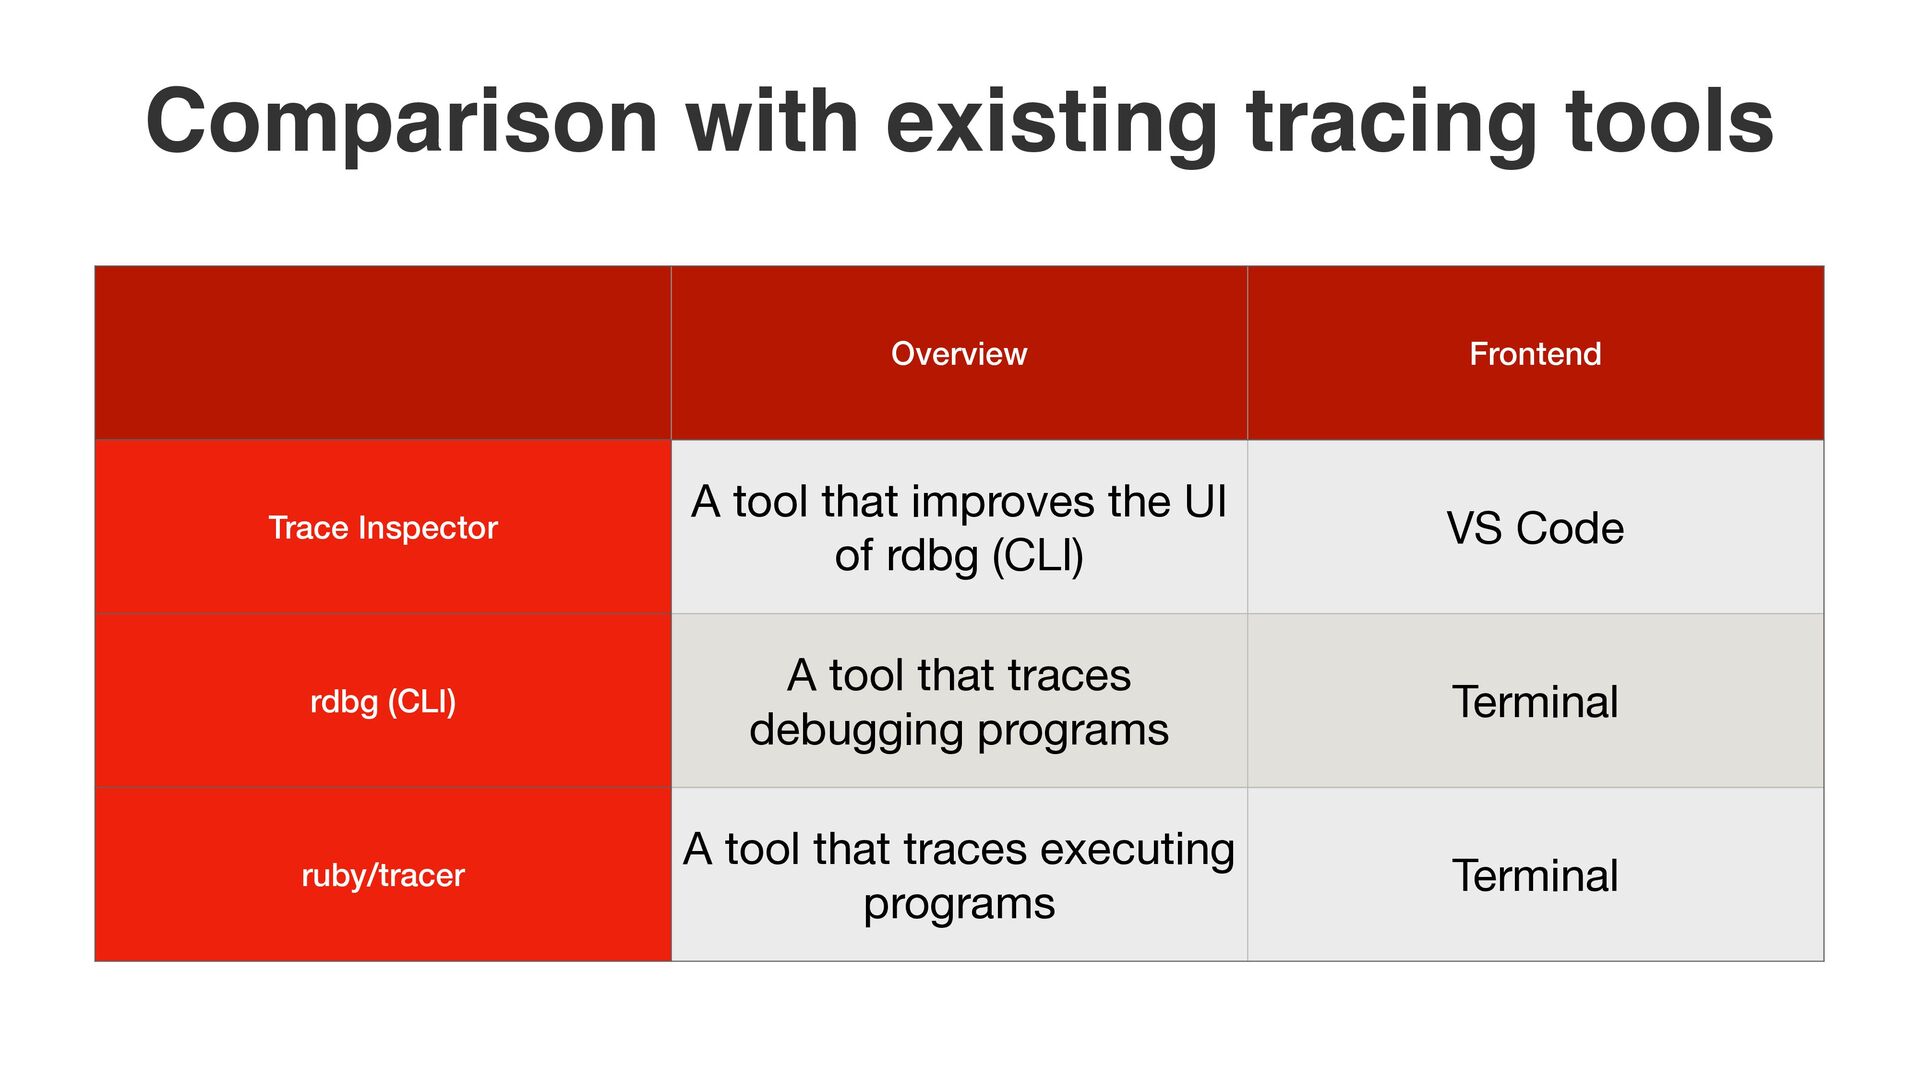
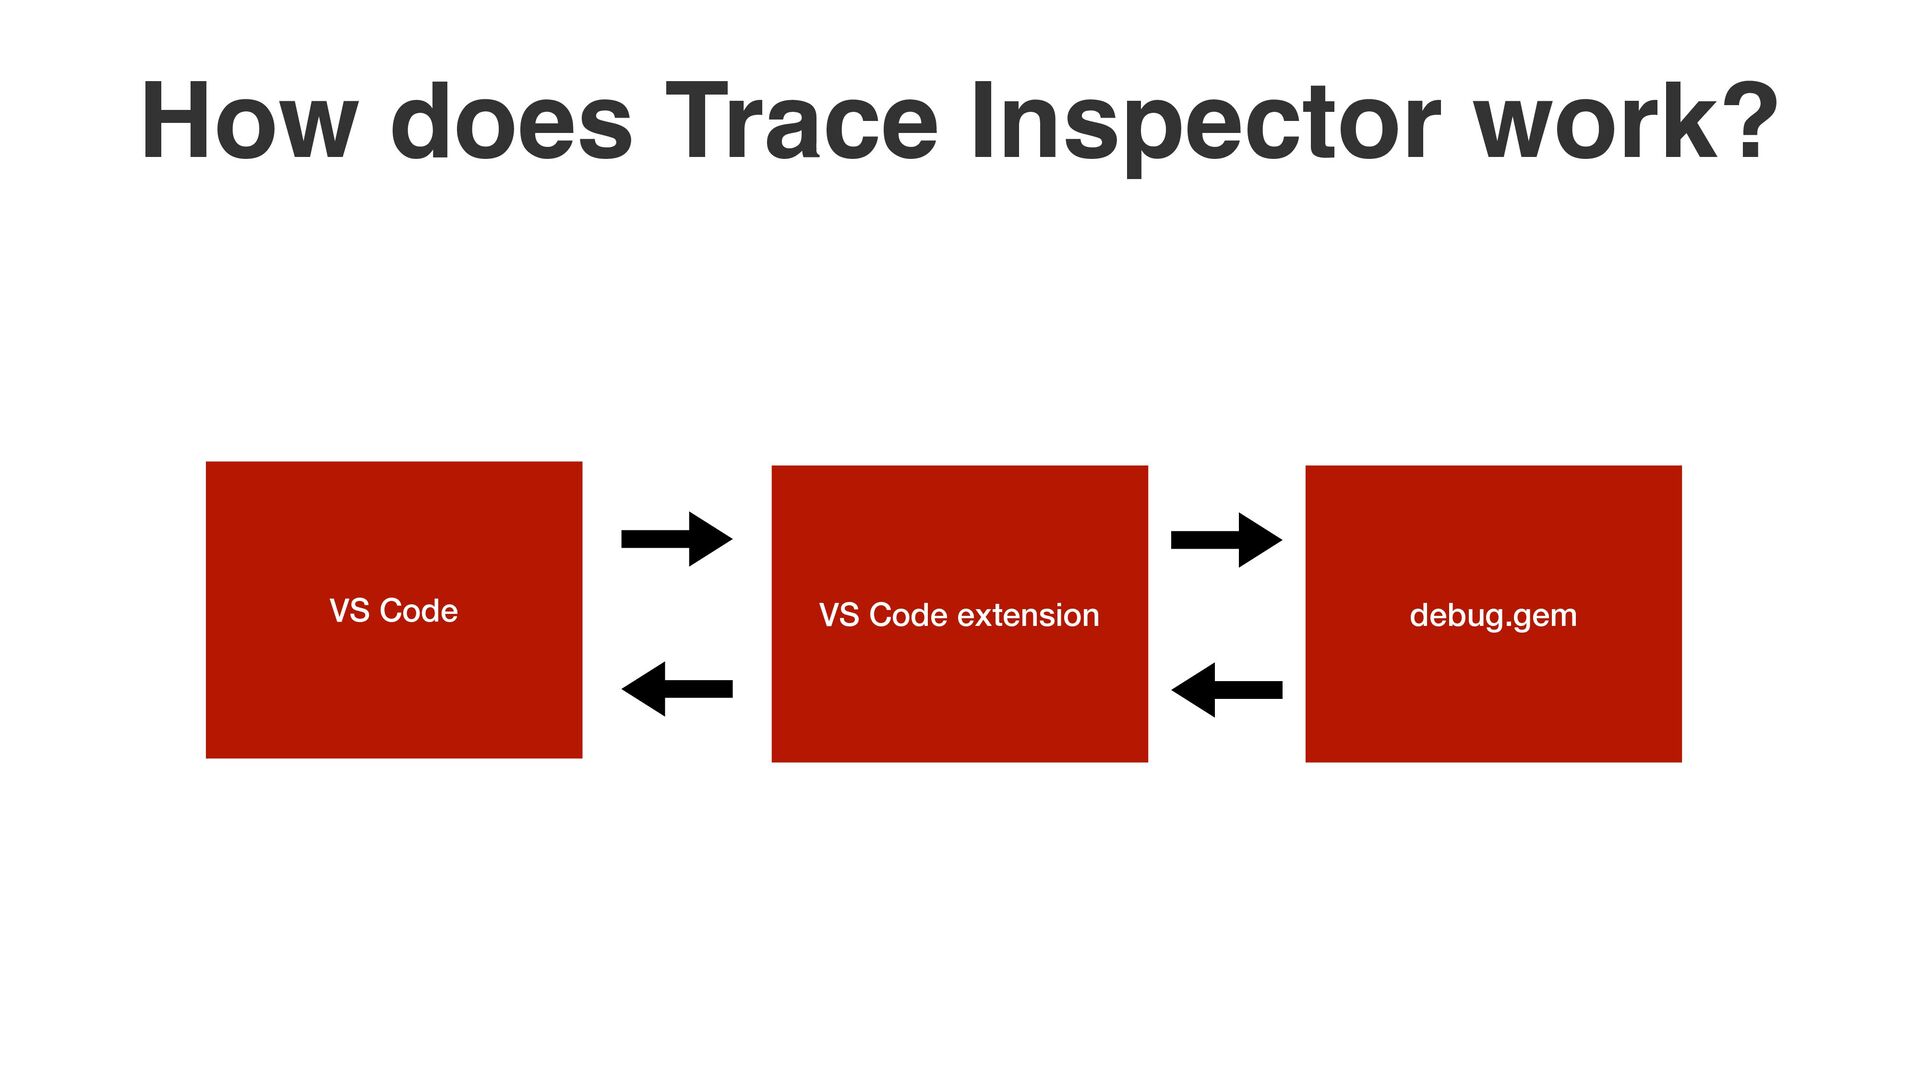
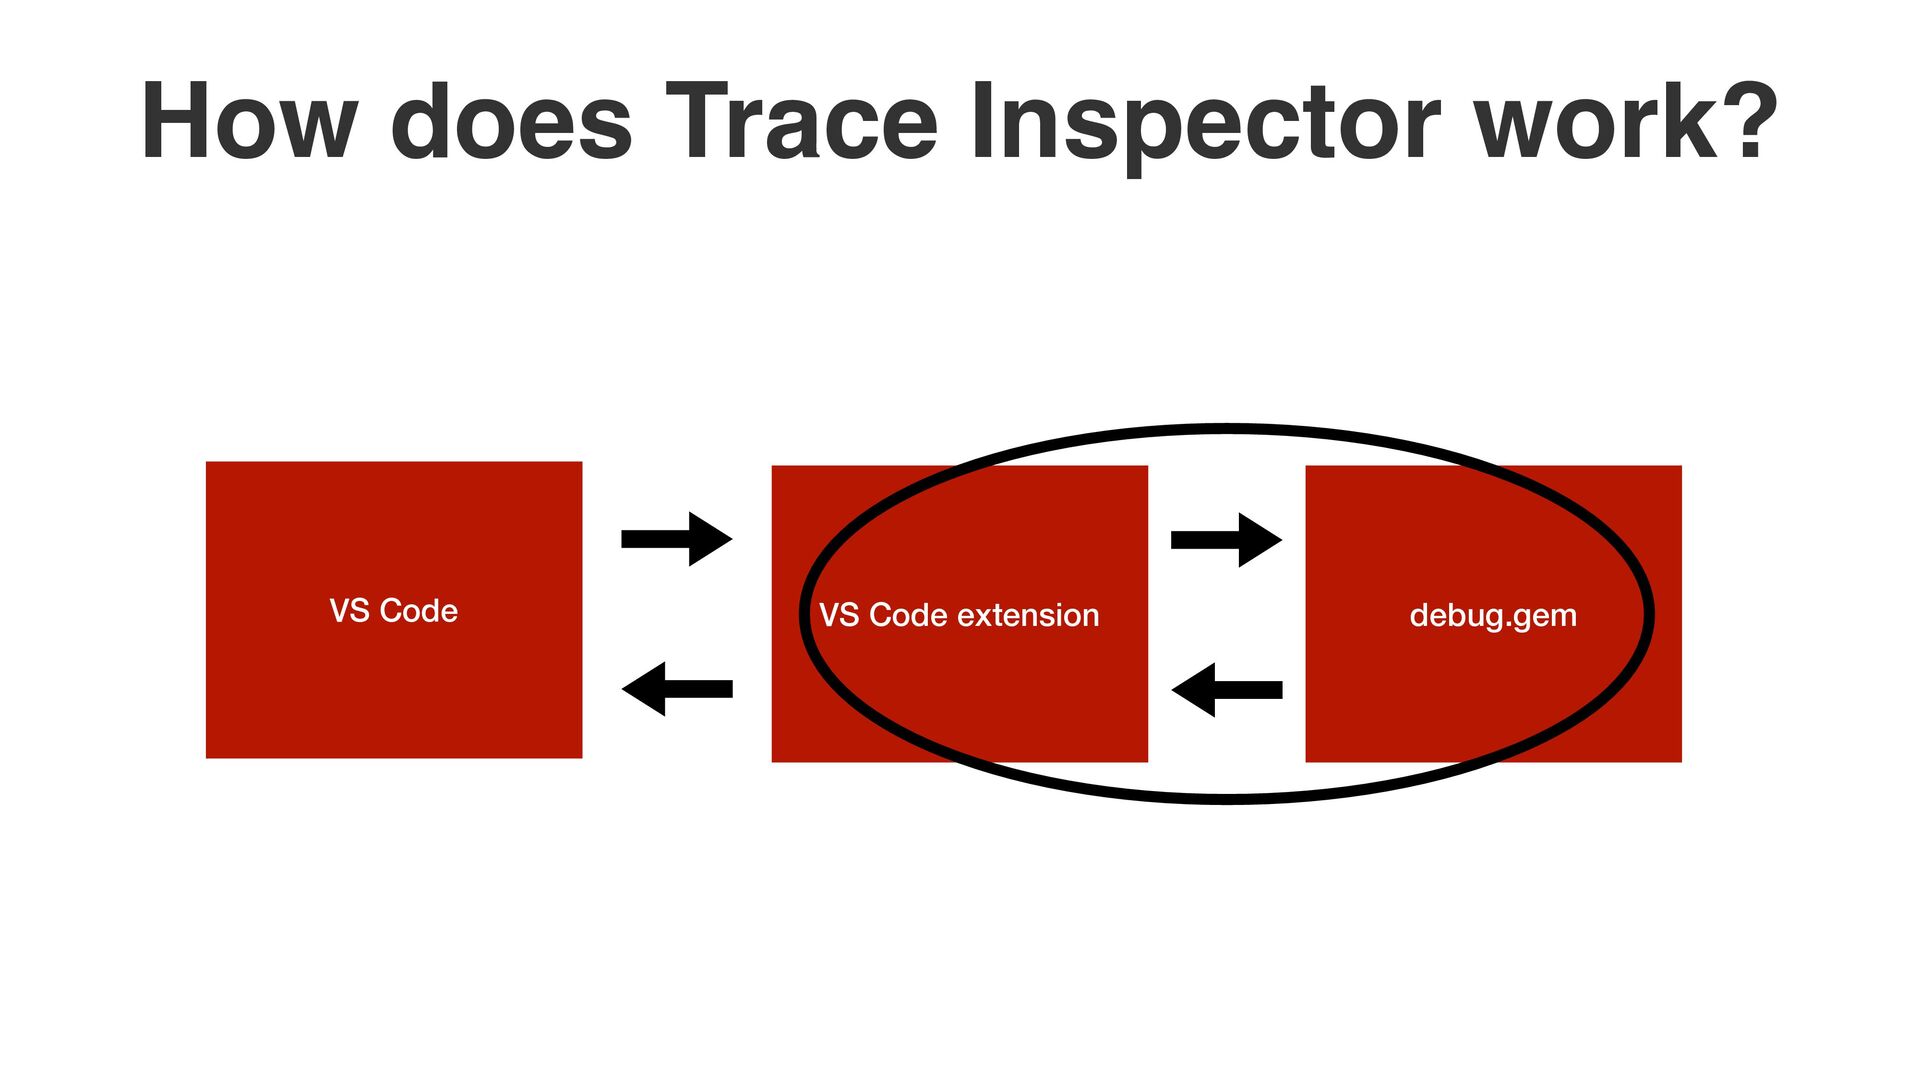
tool that improves the UI of rdbg (CLI) VS Code rdbg (CLI) A tool that traces debugging programs Terminal ruby/tracer A tool that traces executing programs Terminal
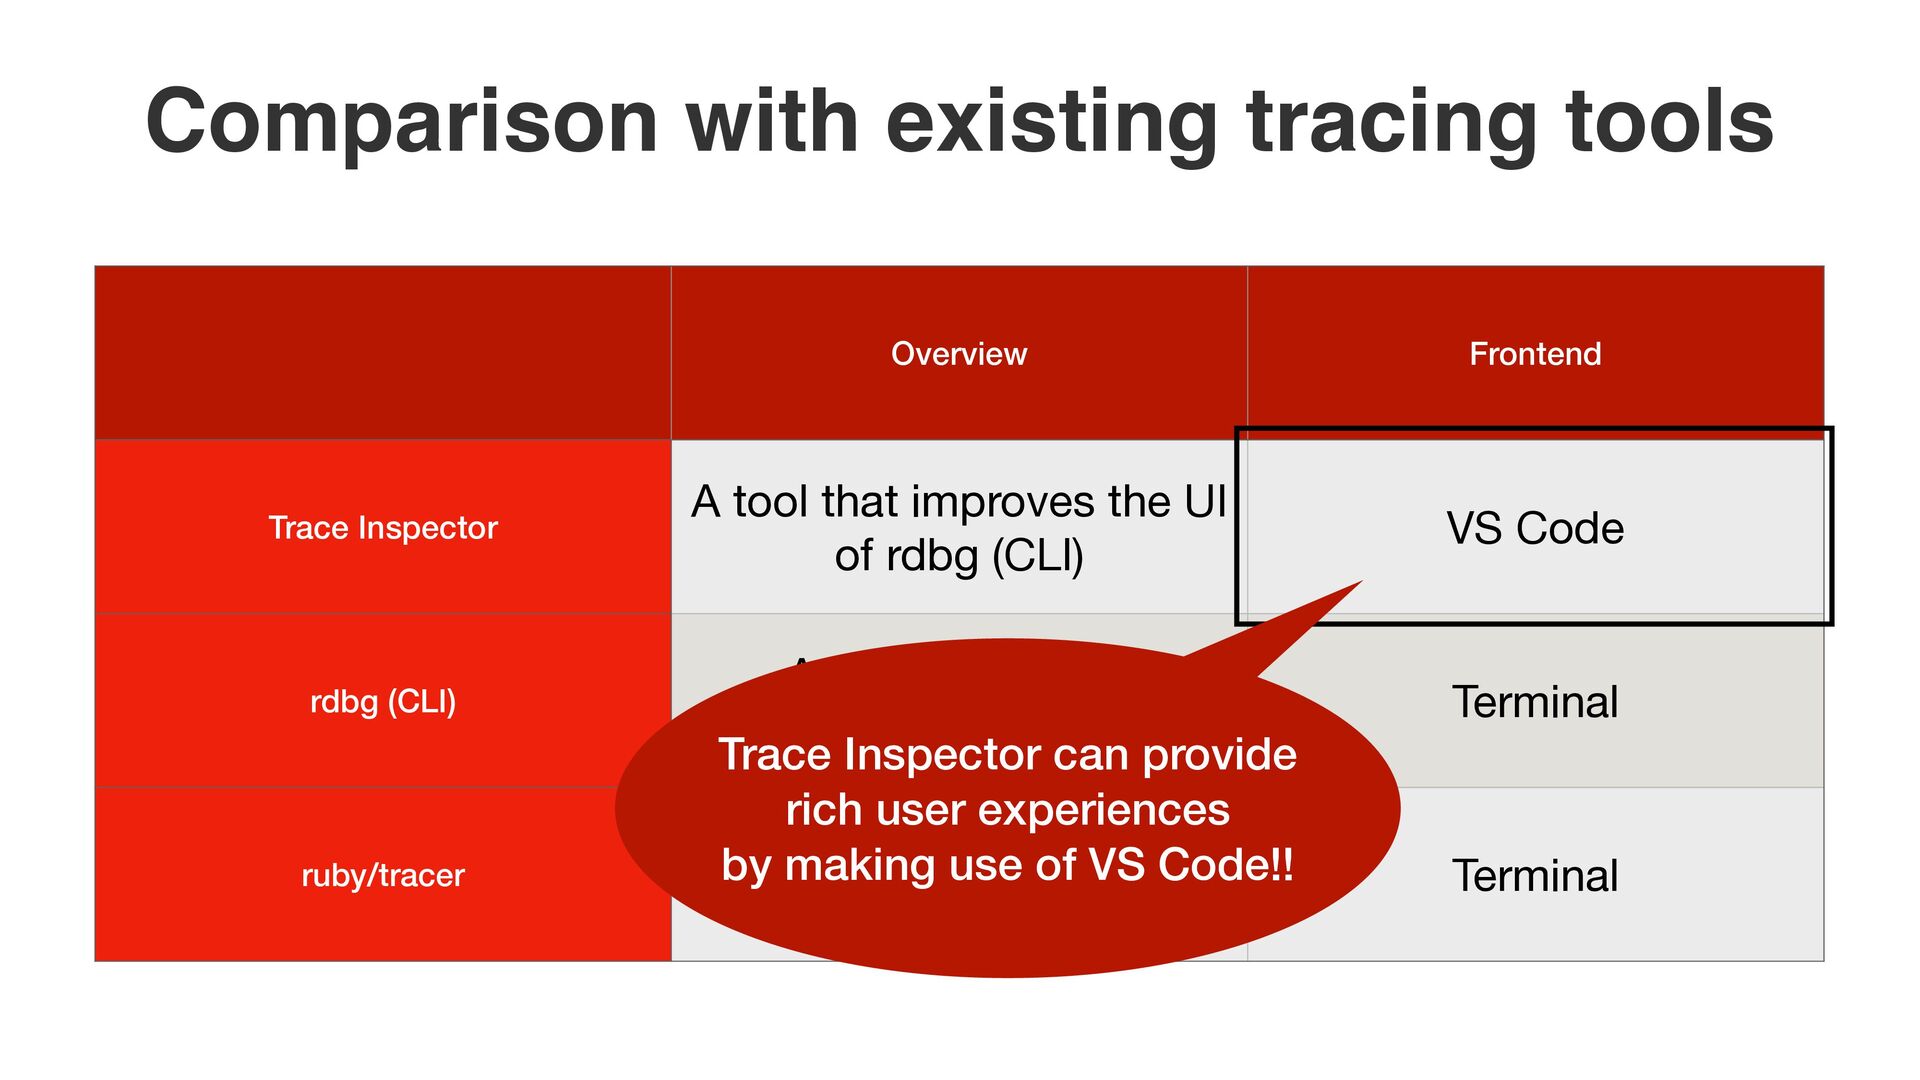
tool that improves the UI of rdbg (CLI) VS Code rdbg (CLI) A tool that traces debugging programs Terminal ruby/tracer A tool that traces executing programs Terminal Trace Inspector can provide rich user experiences by making use of VS Code!!
tool that improves the UI of rdbg (CLI). History Inspector is introduced in RubyKaigi 2022. Trace Inspector which improves History Inspector, is introduced now!
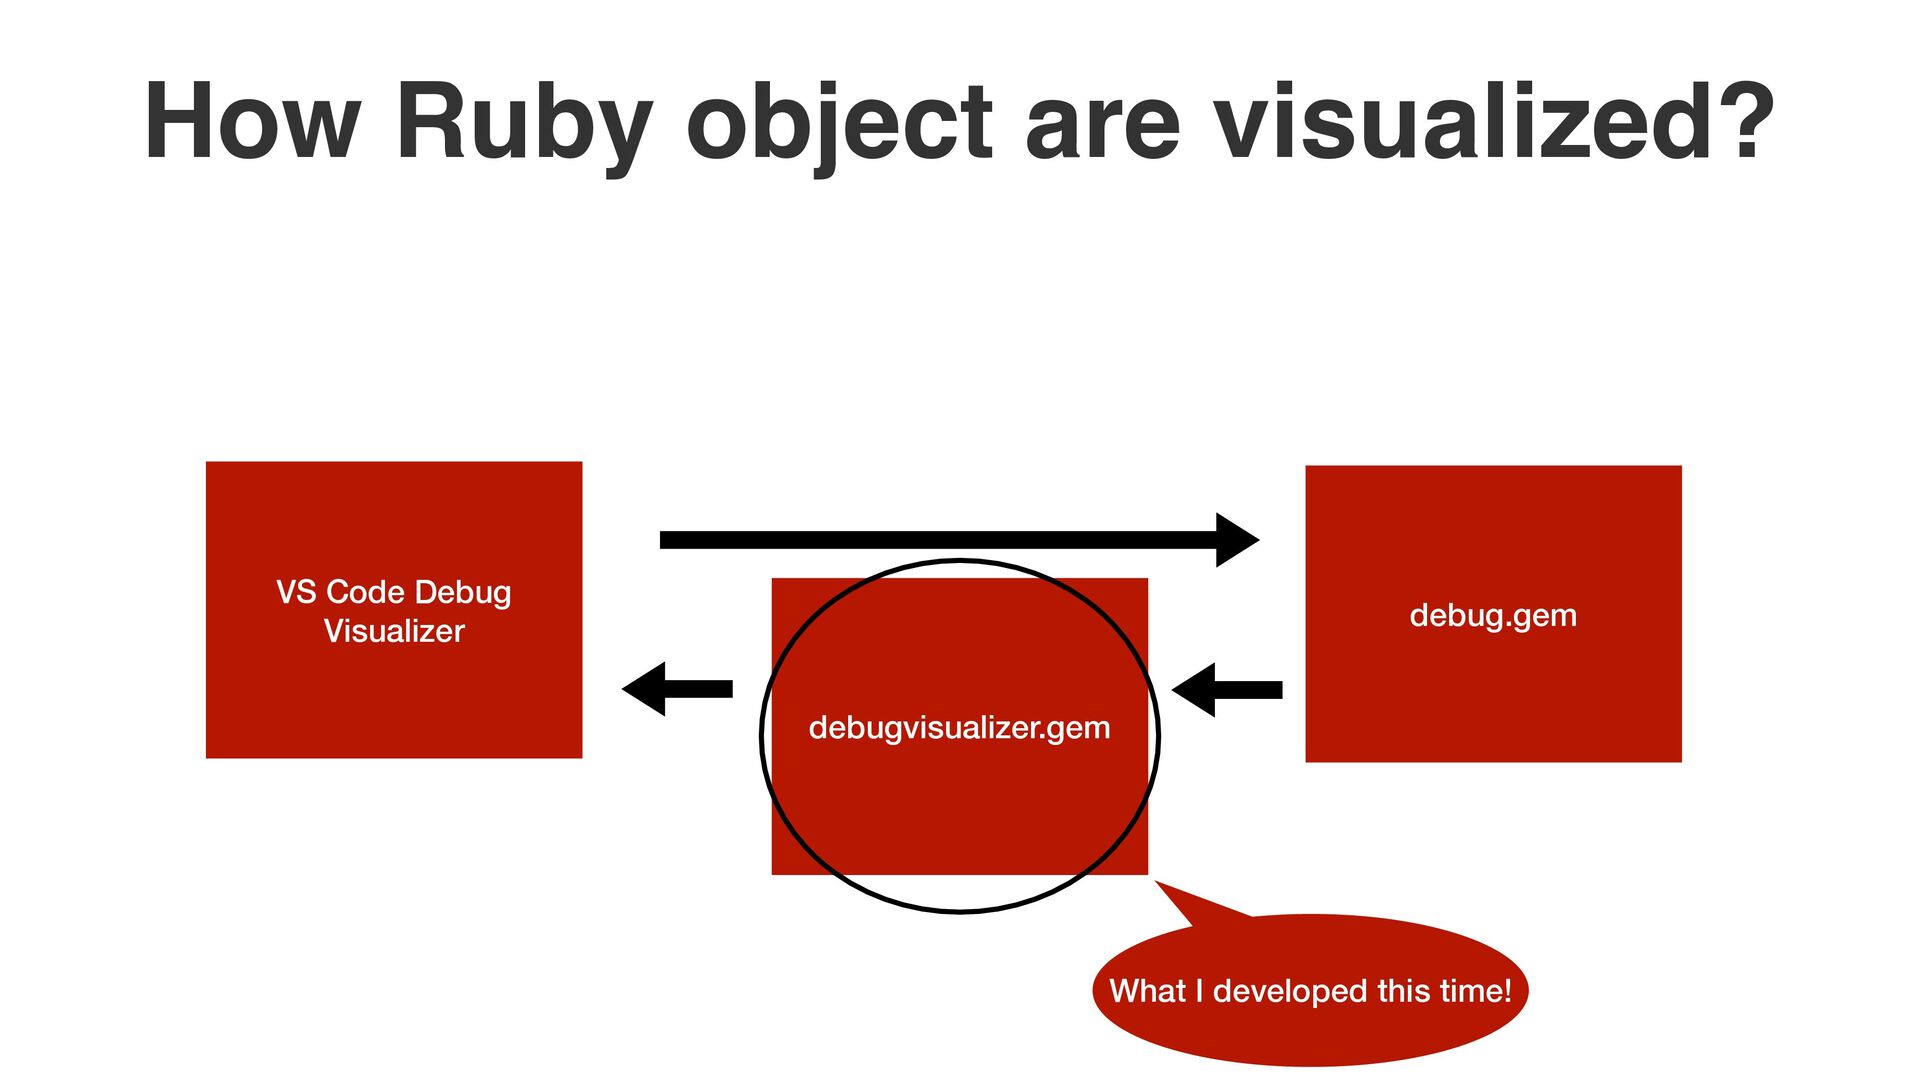
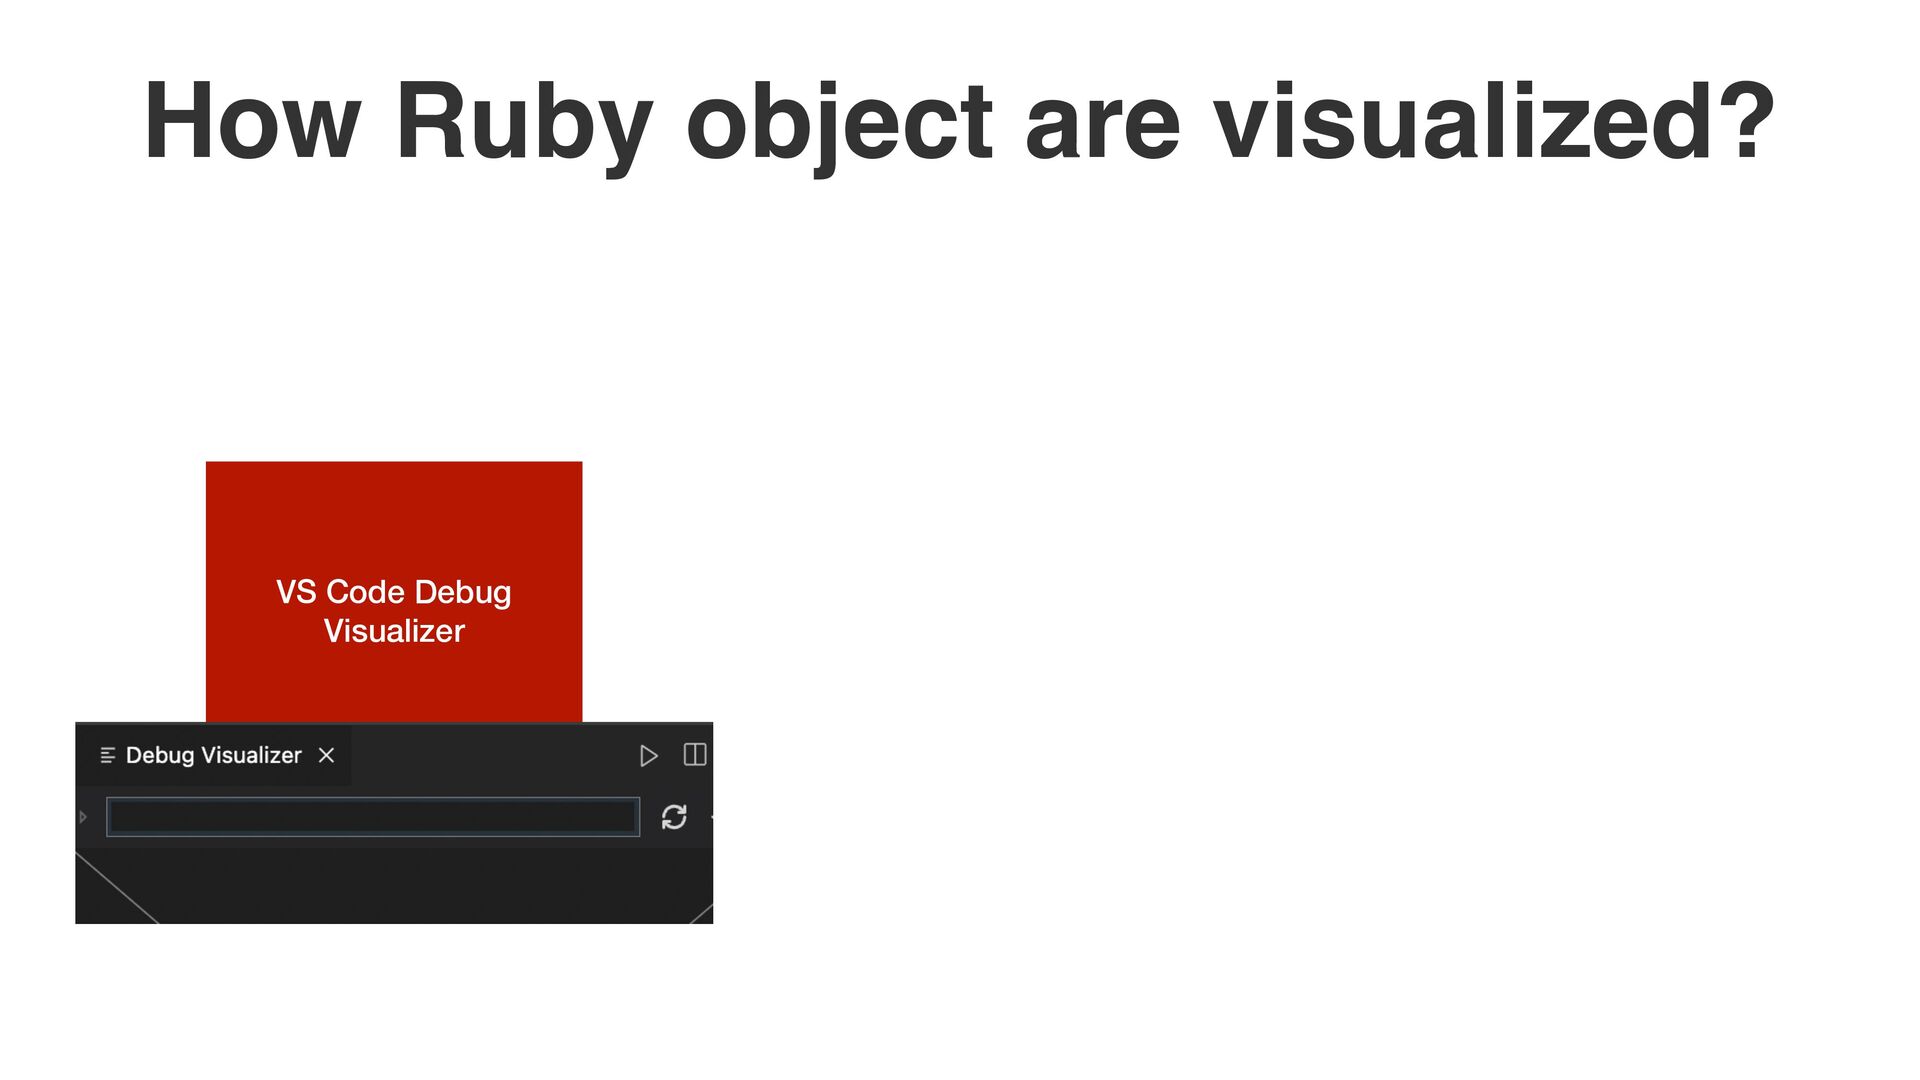
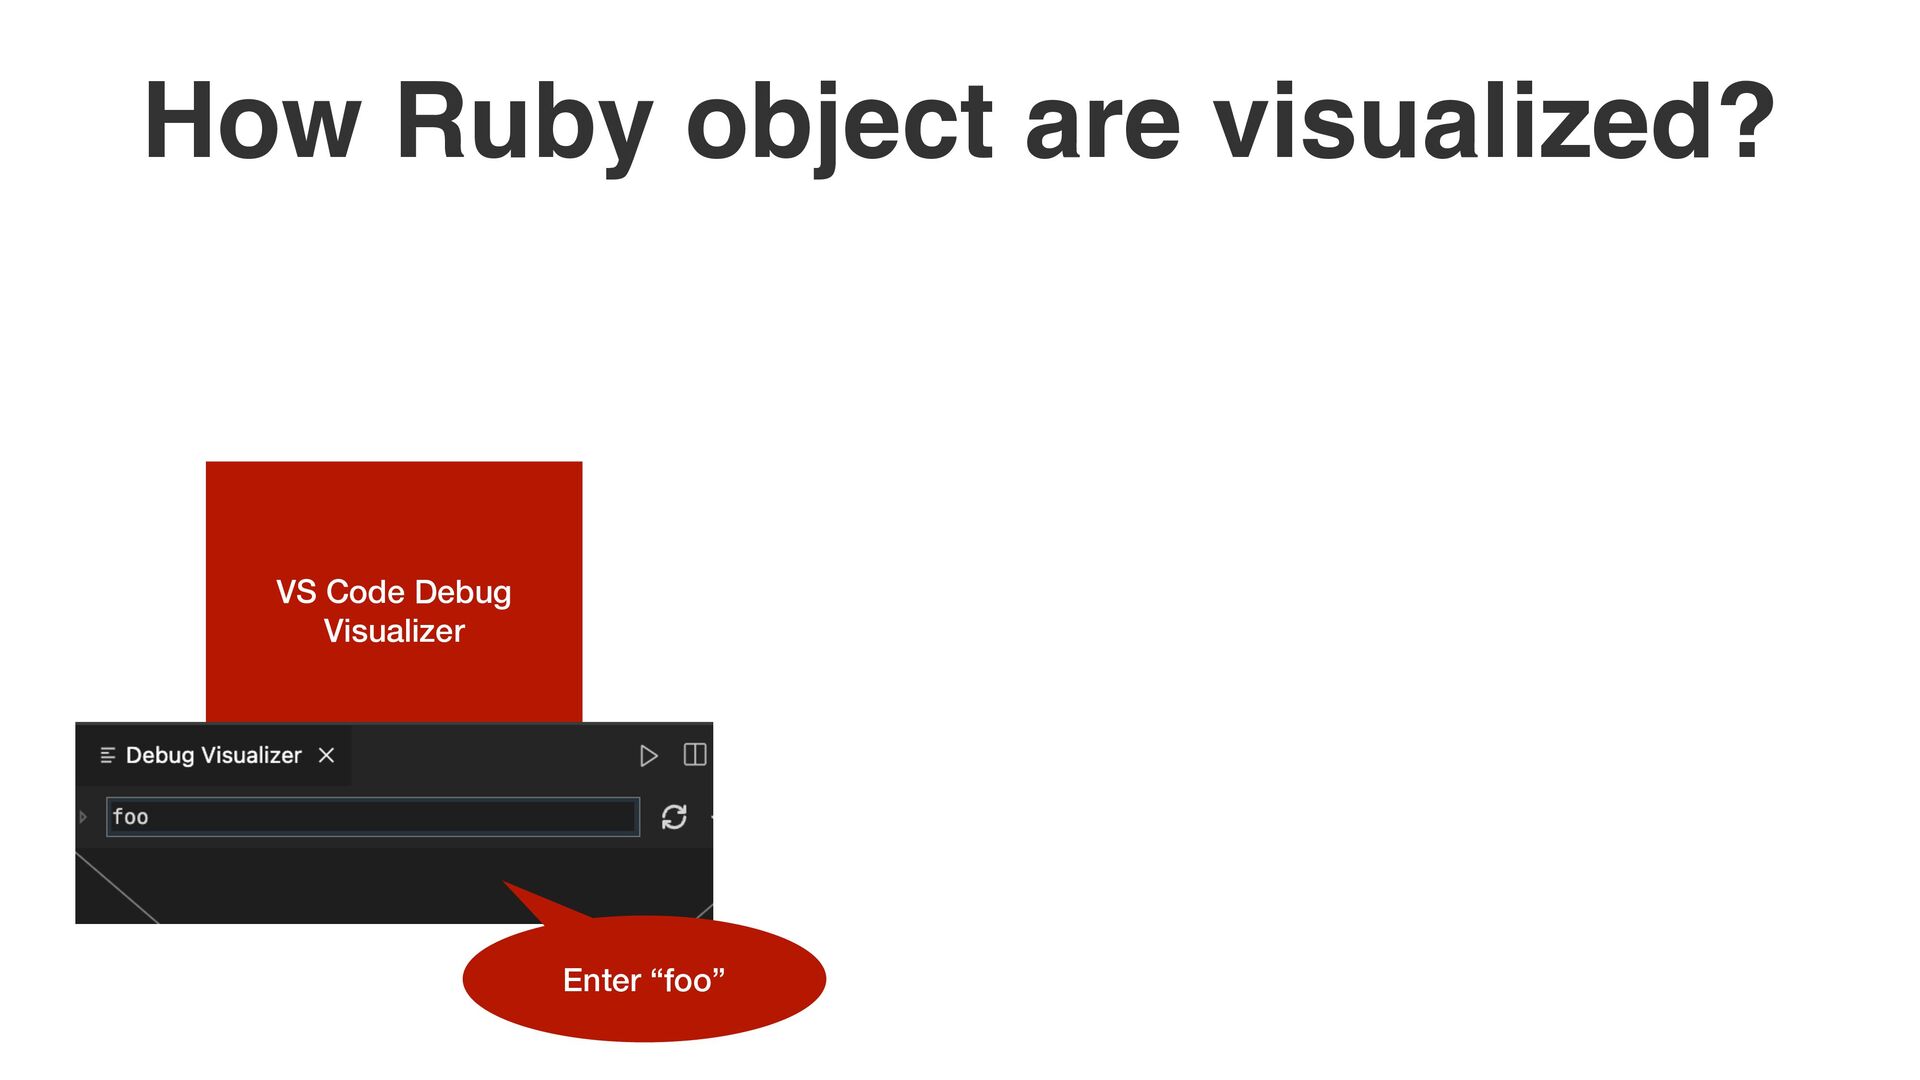
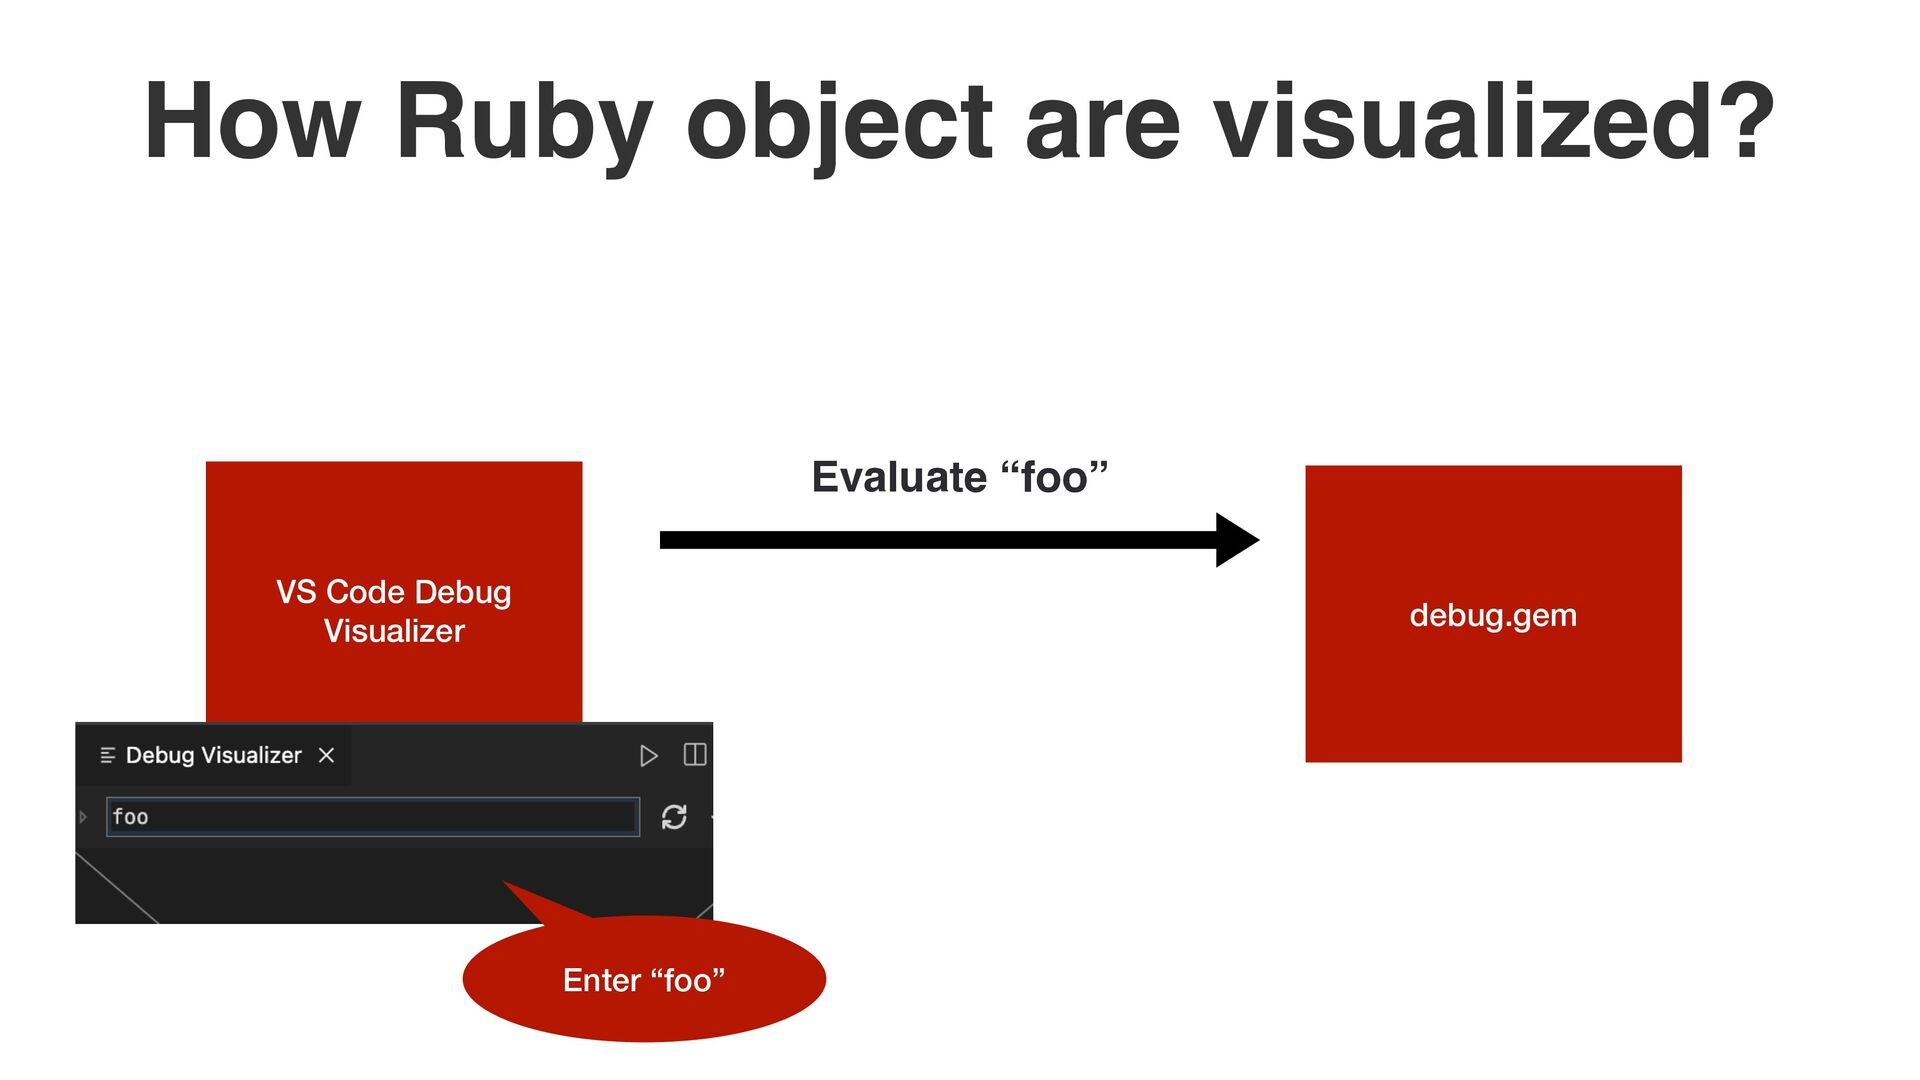
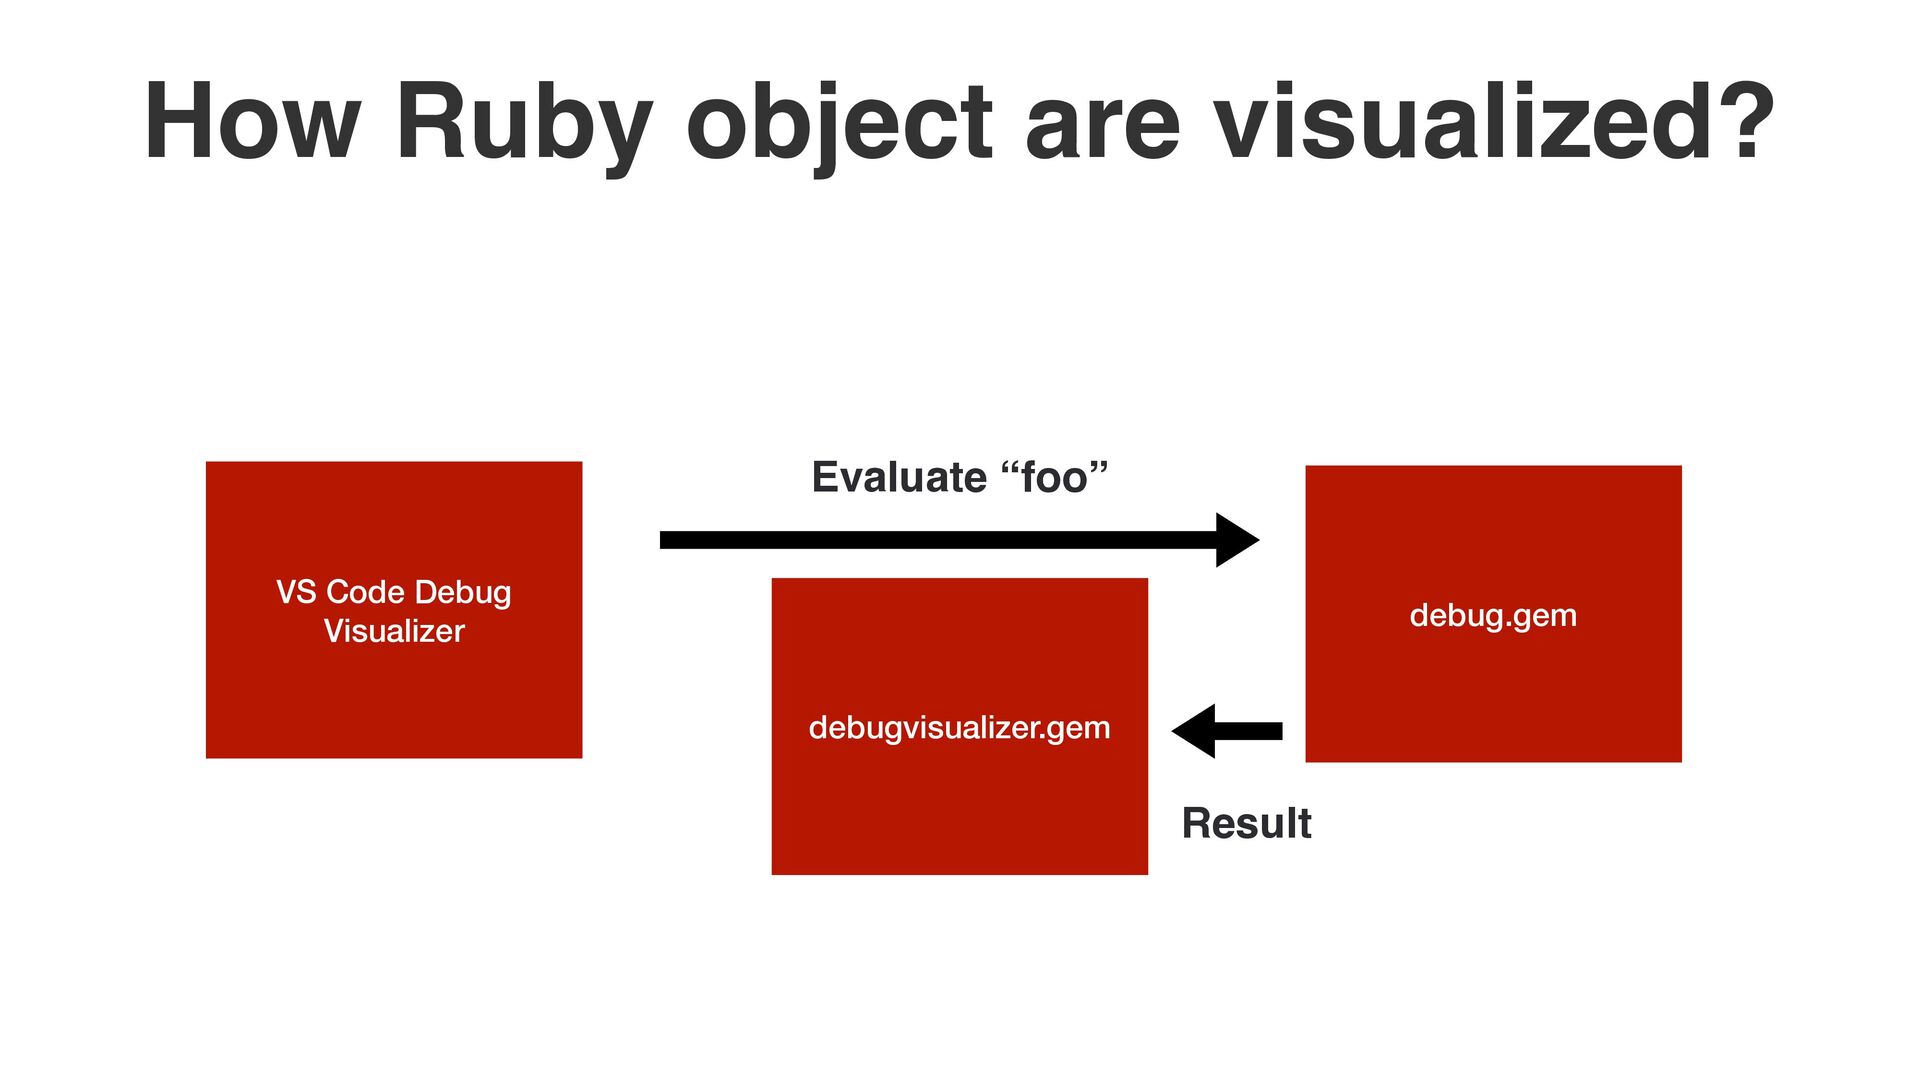
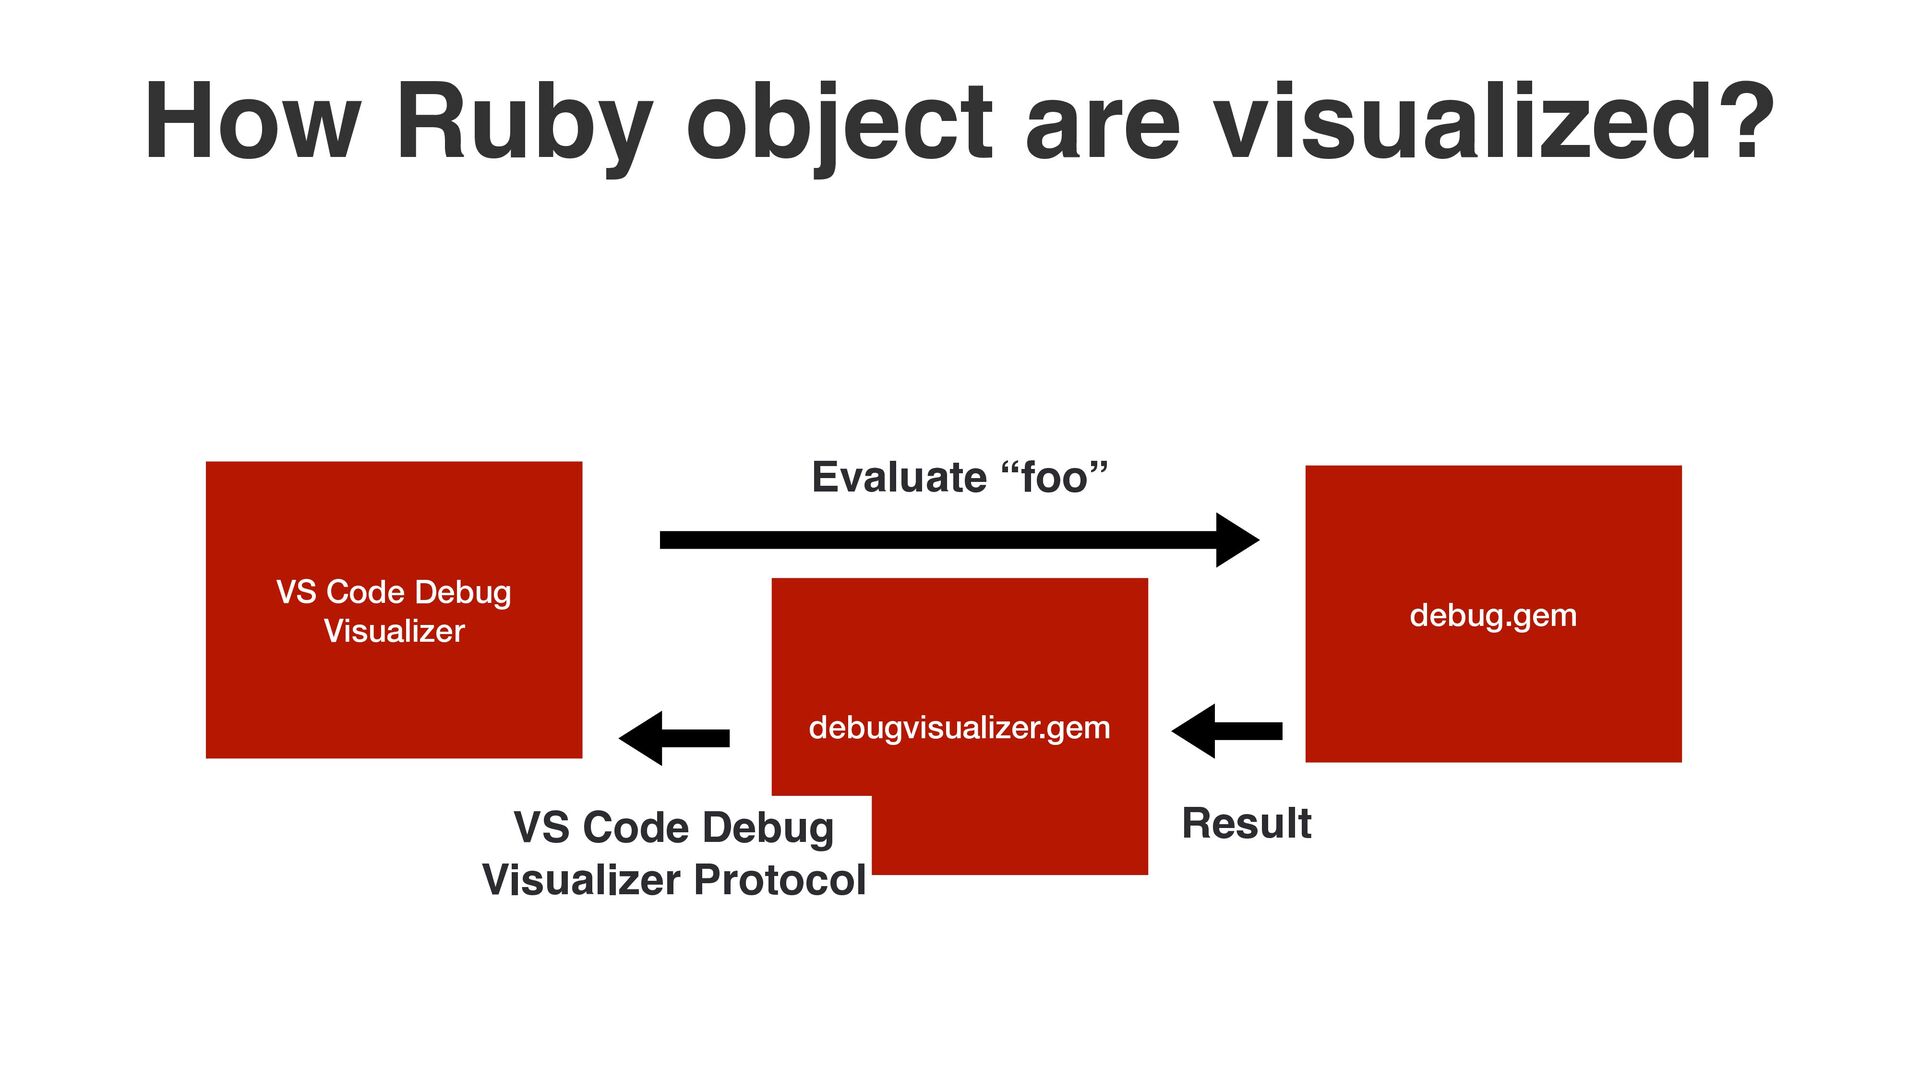
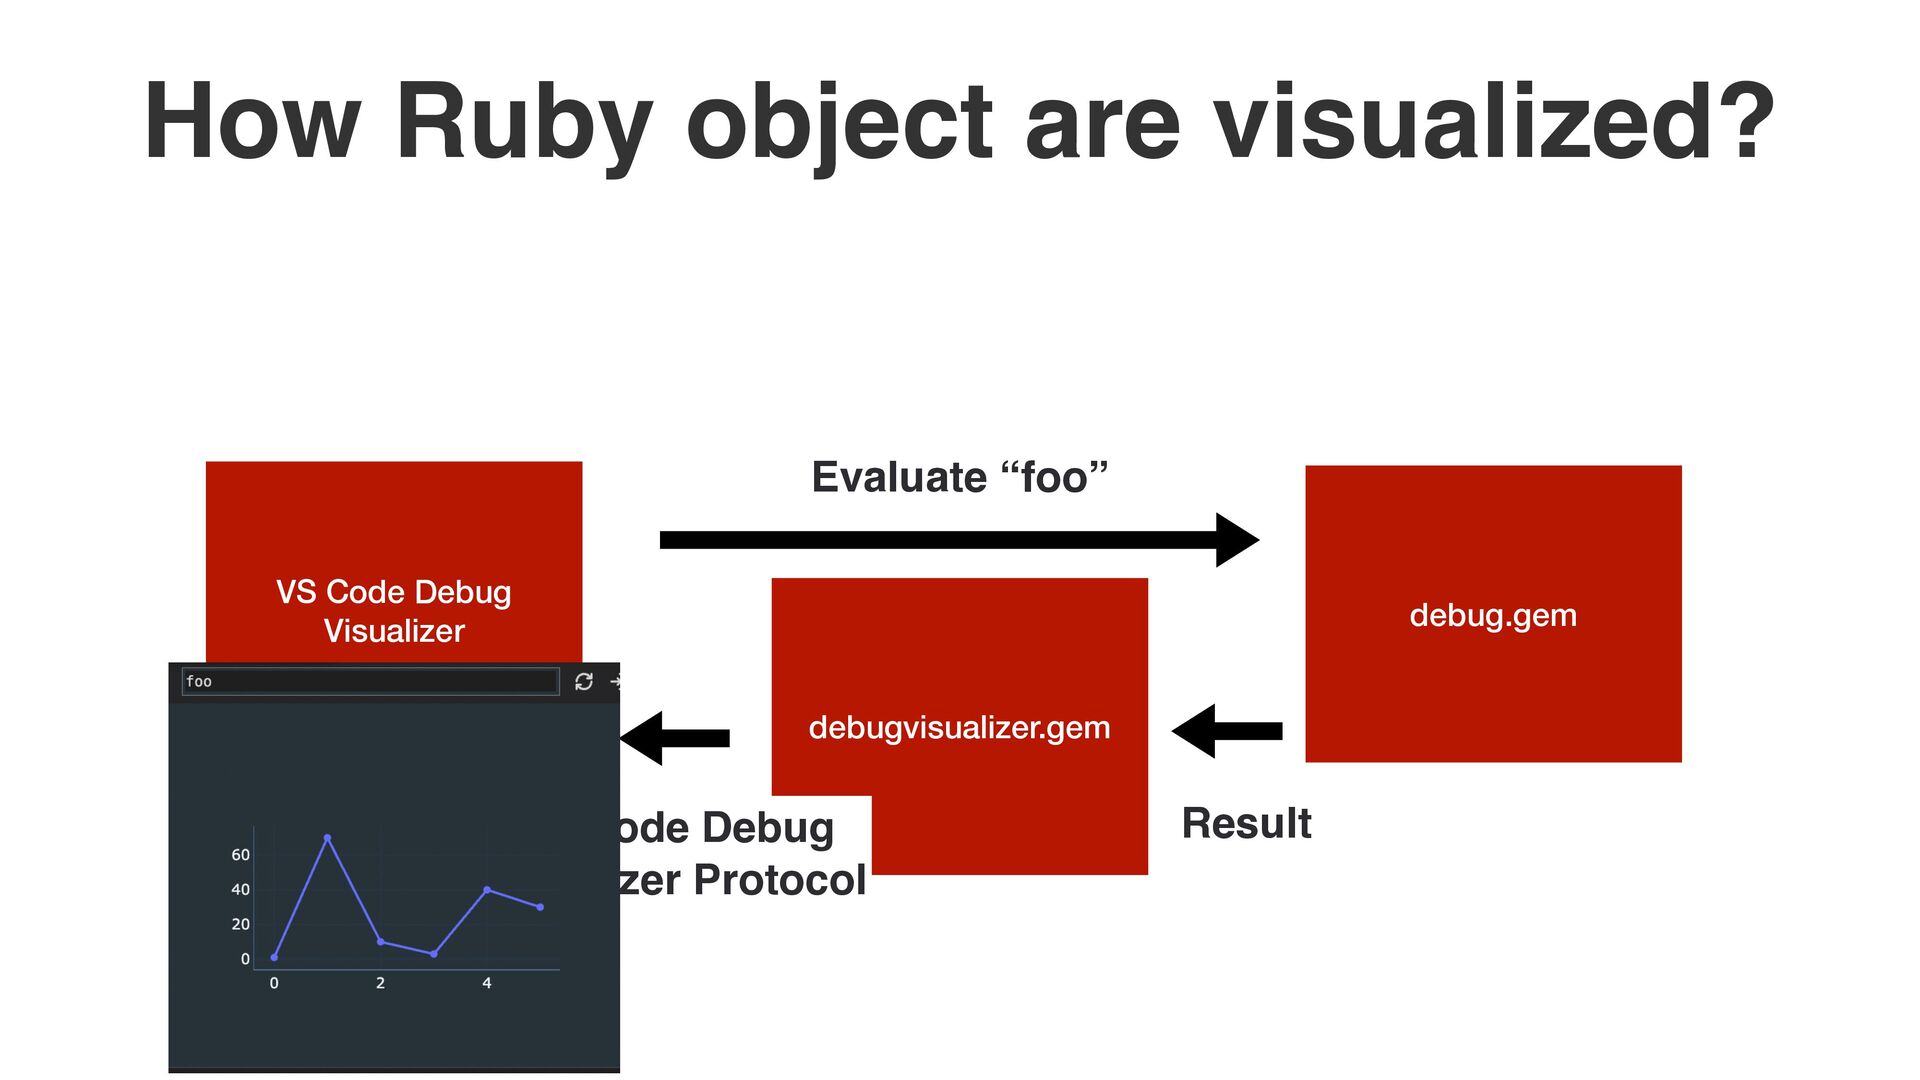
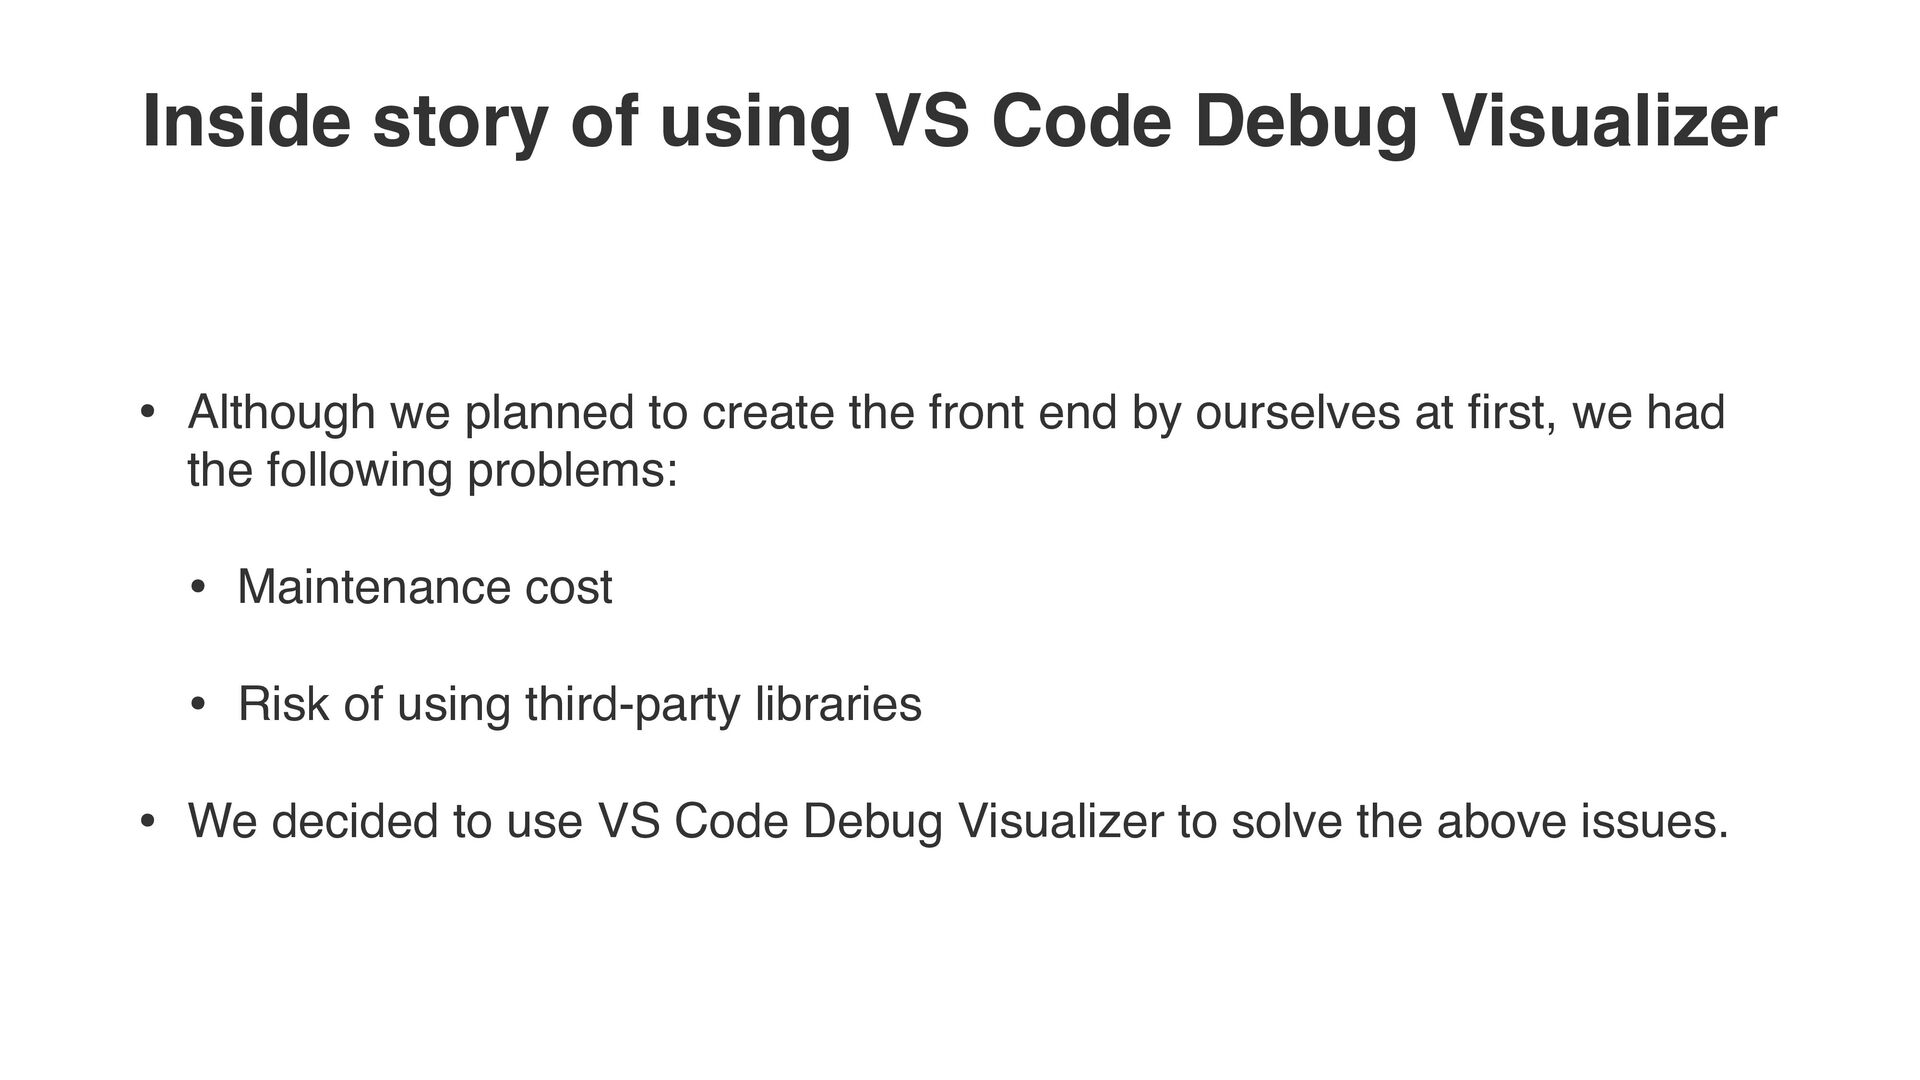
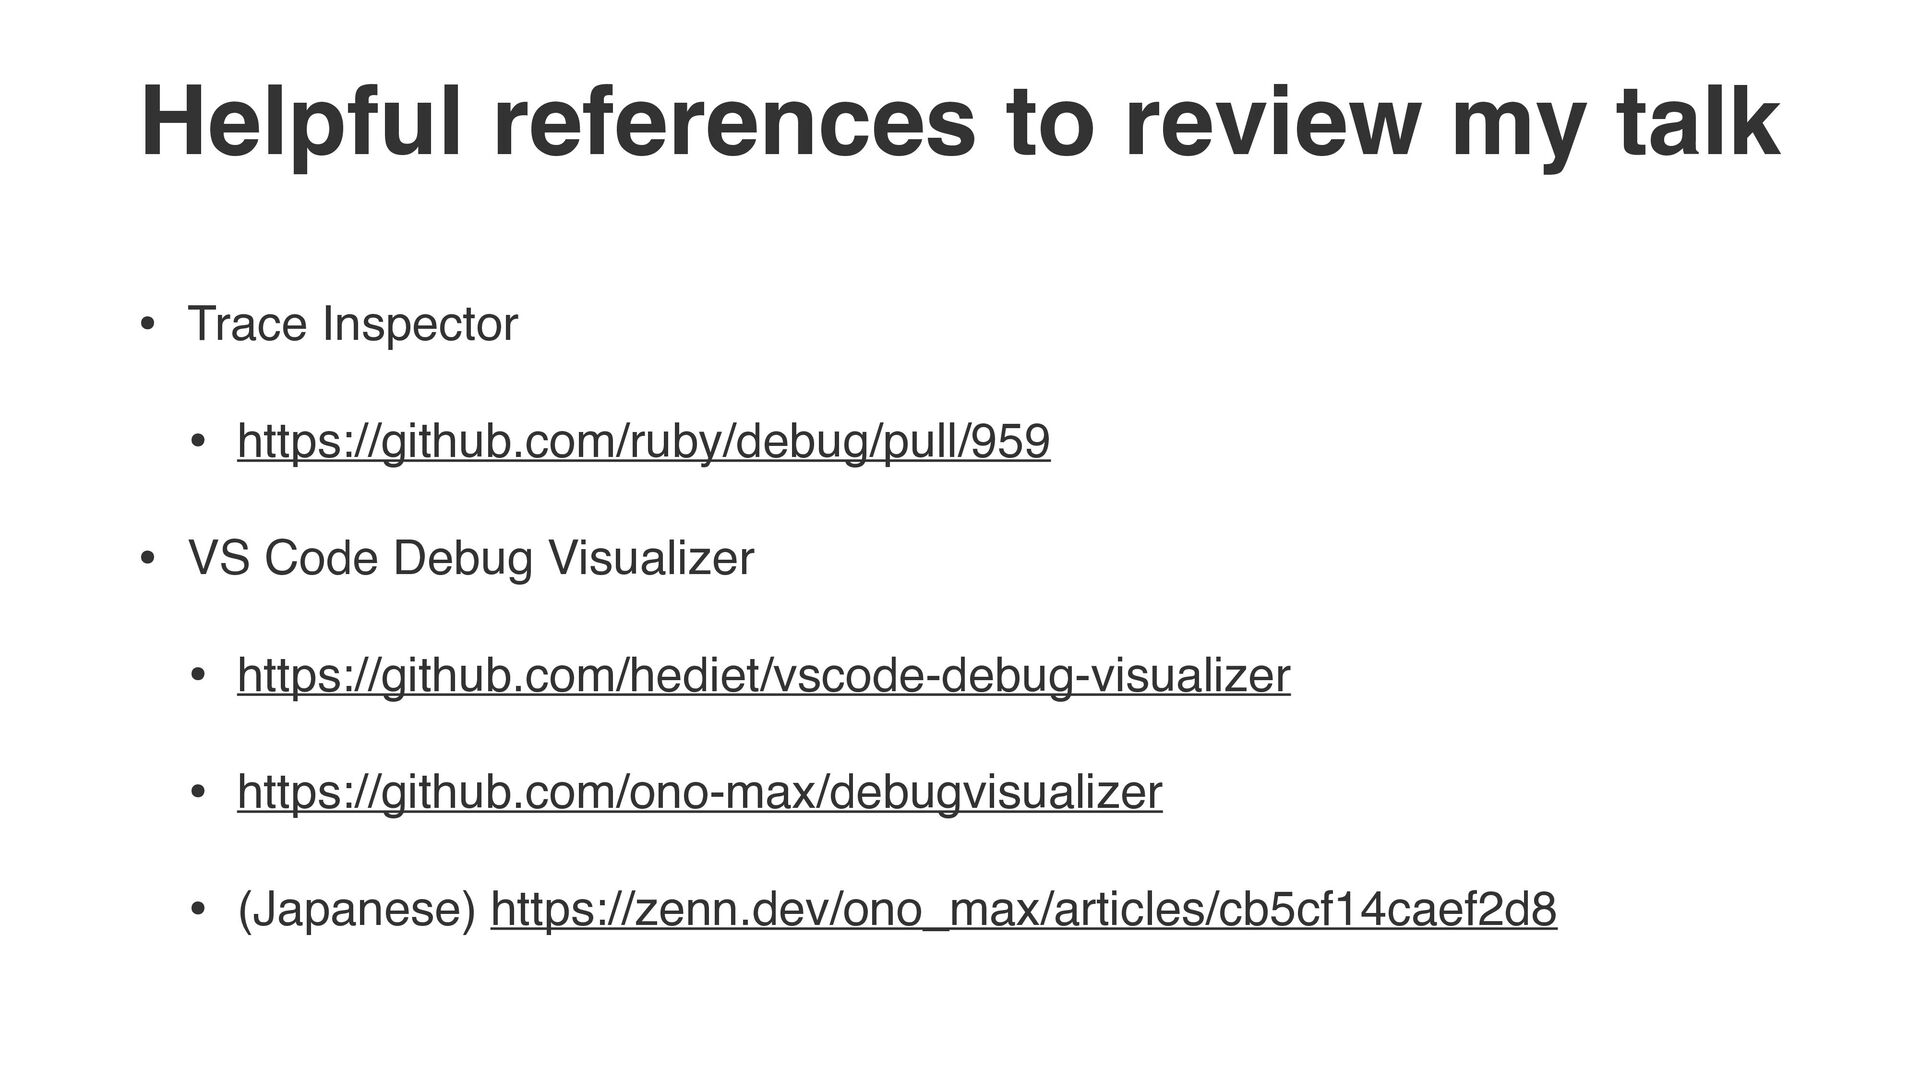
we planned to create the front end by ourselves at fi rst, we had the following problems: • Maintenance cost • Risk of using third-party libraries • We decided to use VS Code Debug Visualizer to solve the above issues.
to design Trace Inspector. • If it had not been for his help, I wouldn’t have been here! • Thank you for giving me much feedback about Trace Inspector! • Yusuke Endoh san (@mame) • Mari Imaizumi san (@ima1zumi) • Yuki Torii san (@yotii23)