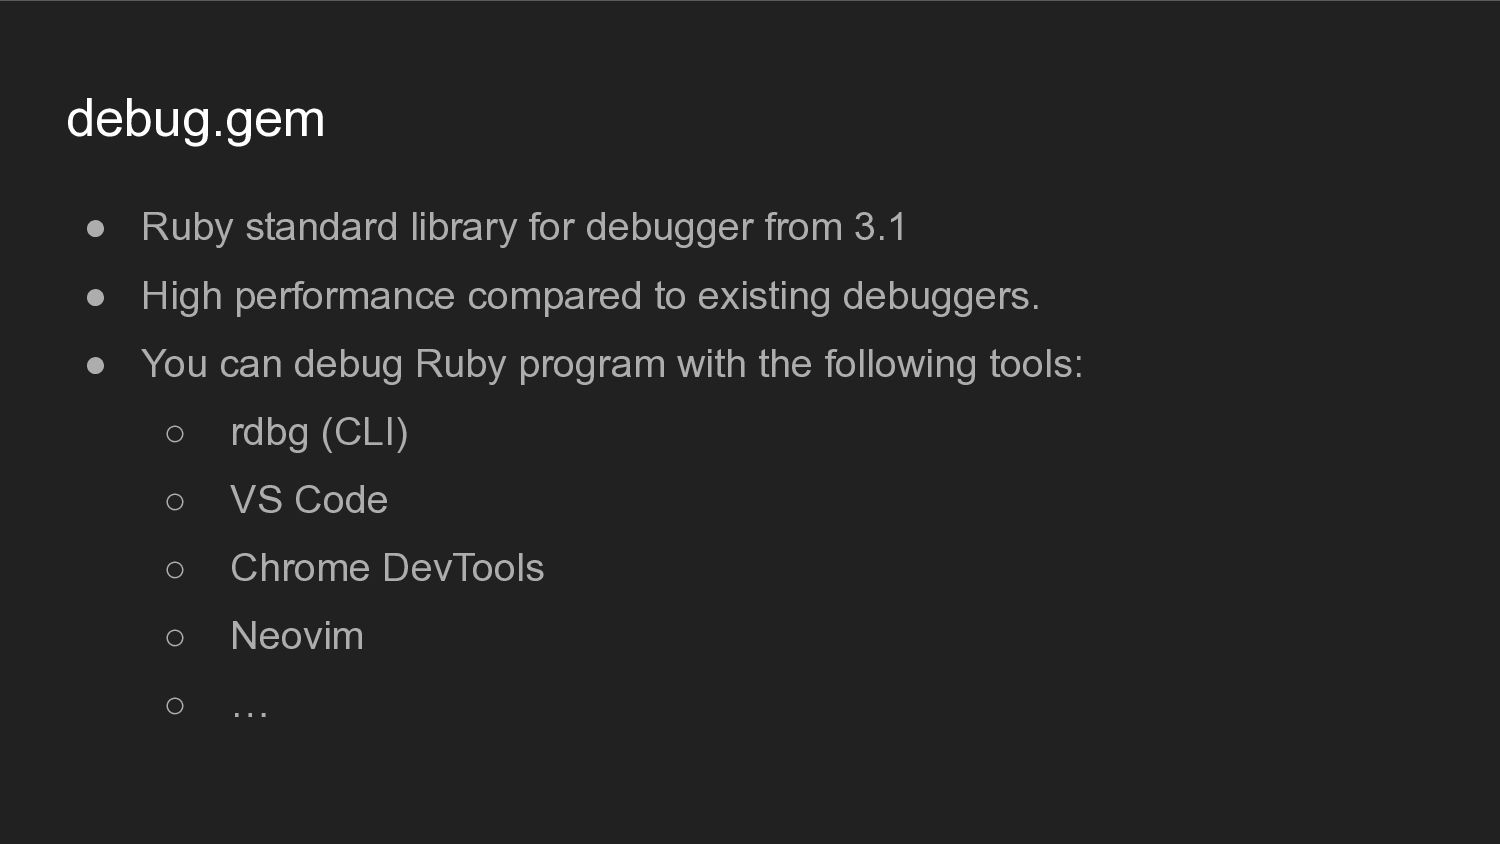
High performance compared to existing debuggers. • You can debug Ruby program with the following tools: ◦ rdbg (CLI) ◦ VS Code ◦ Chrome DevTools ◦ Neovim ◦ …
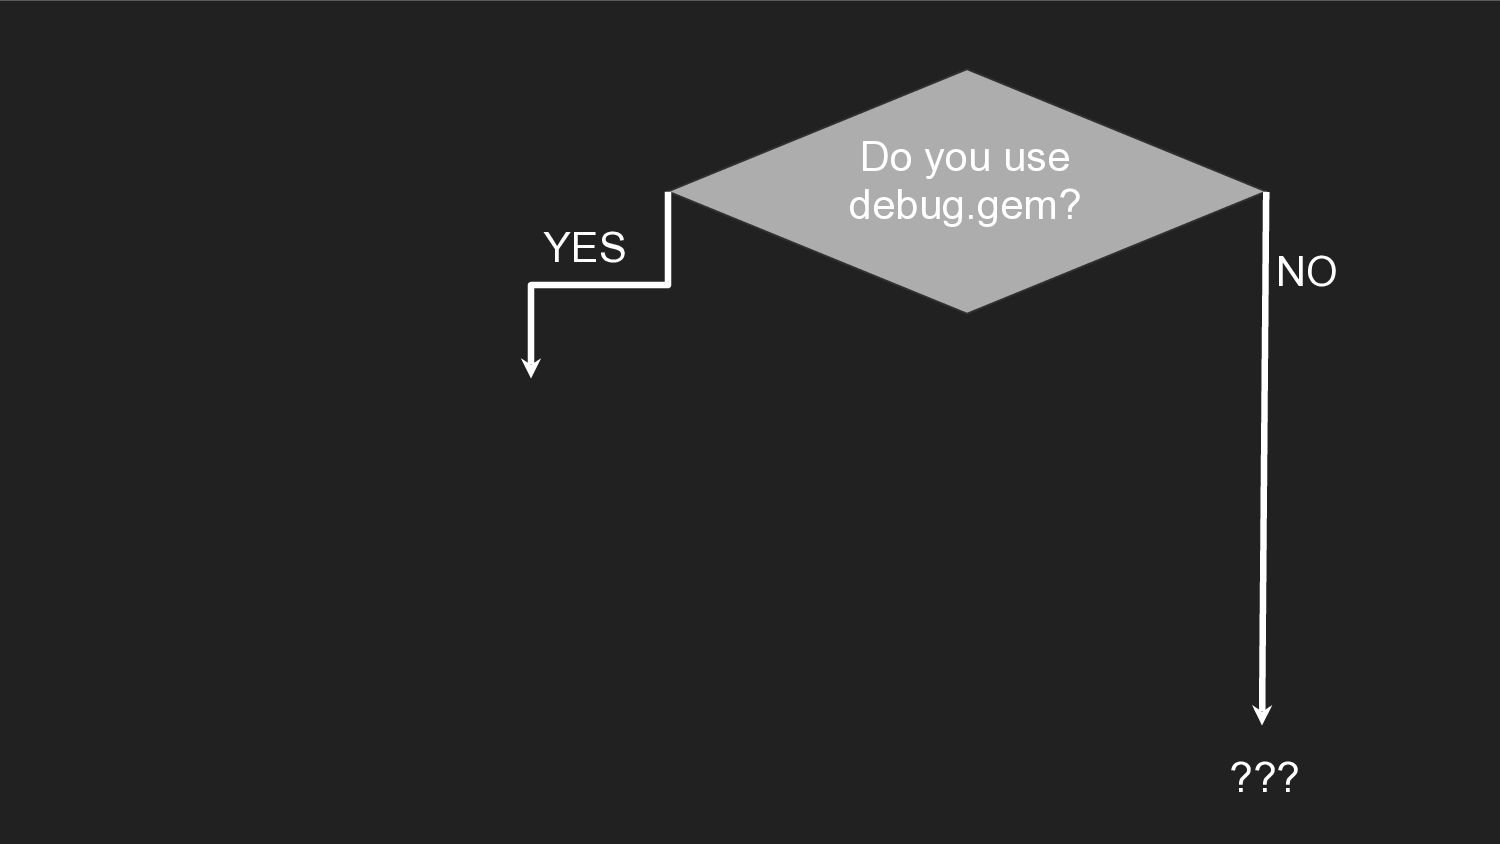
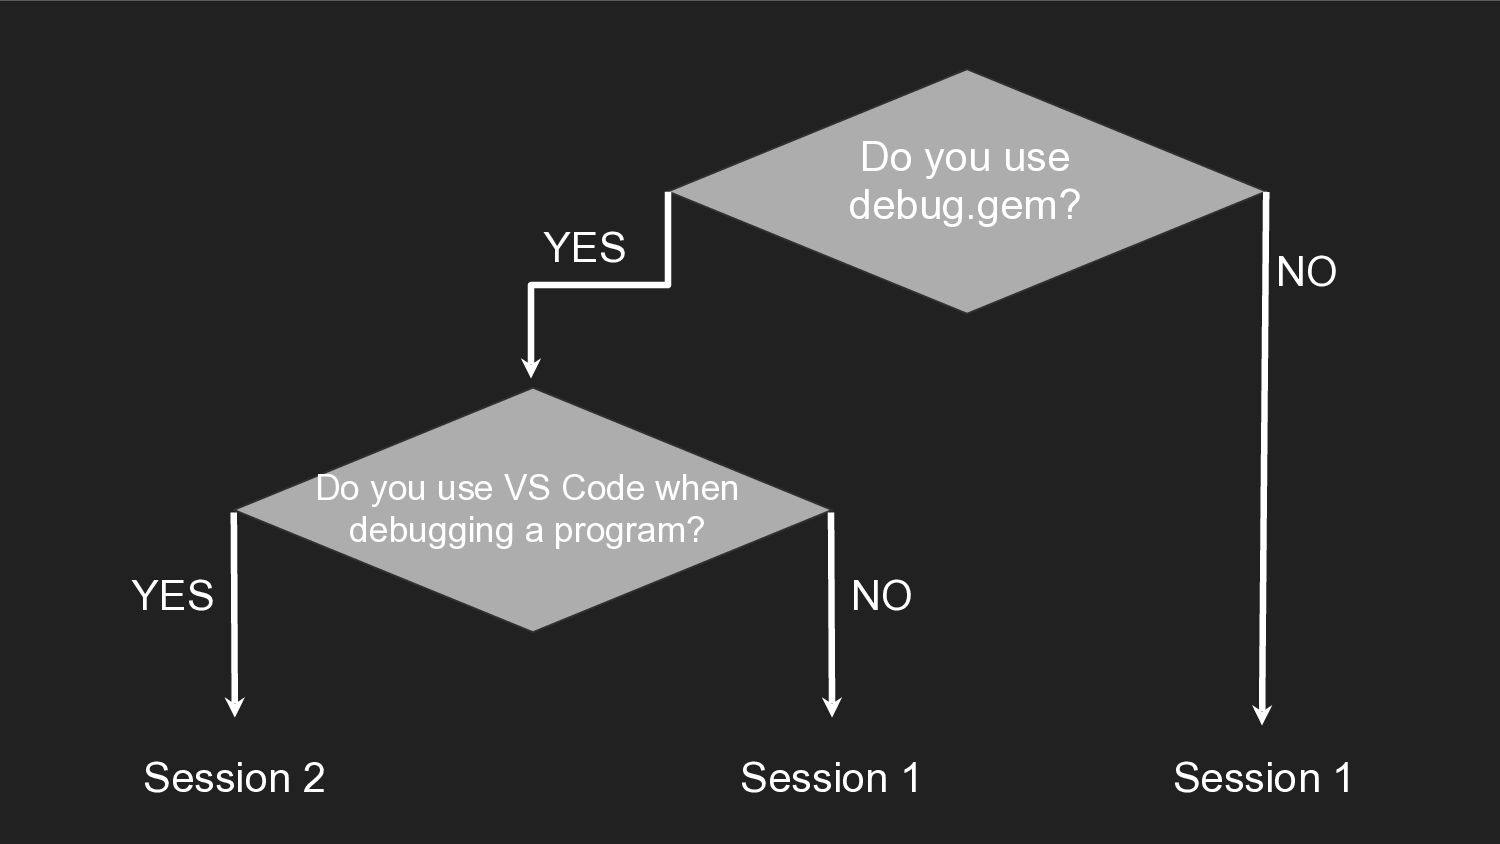
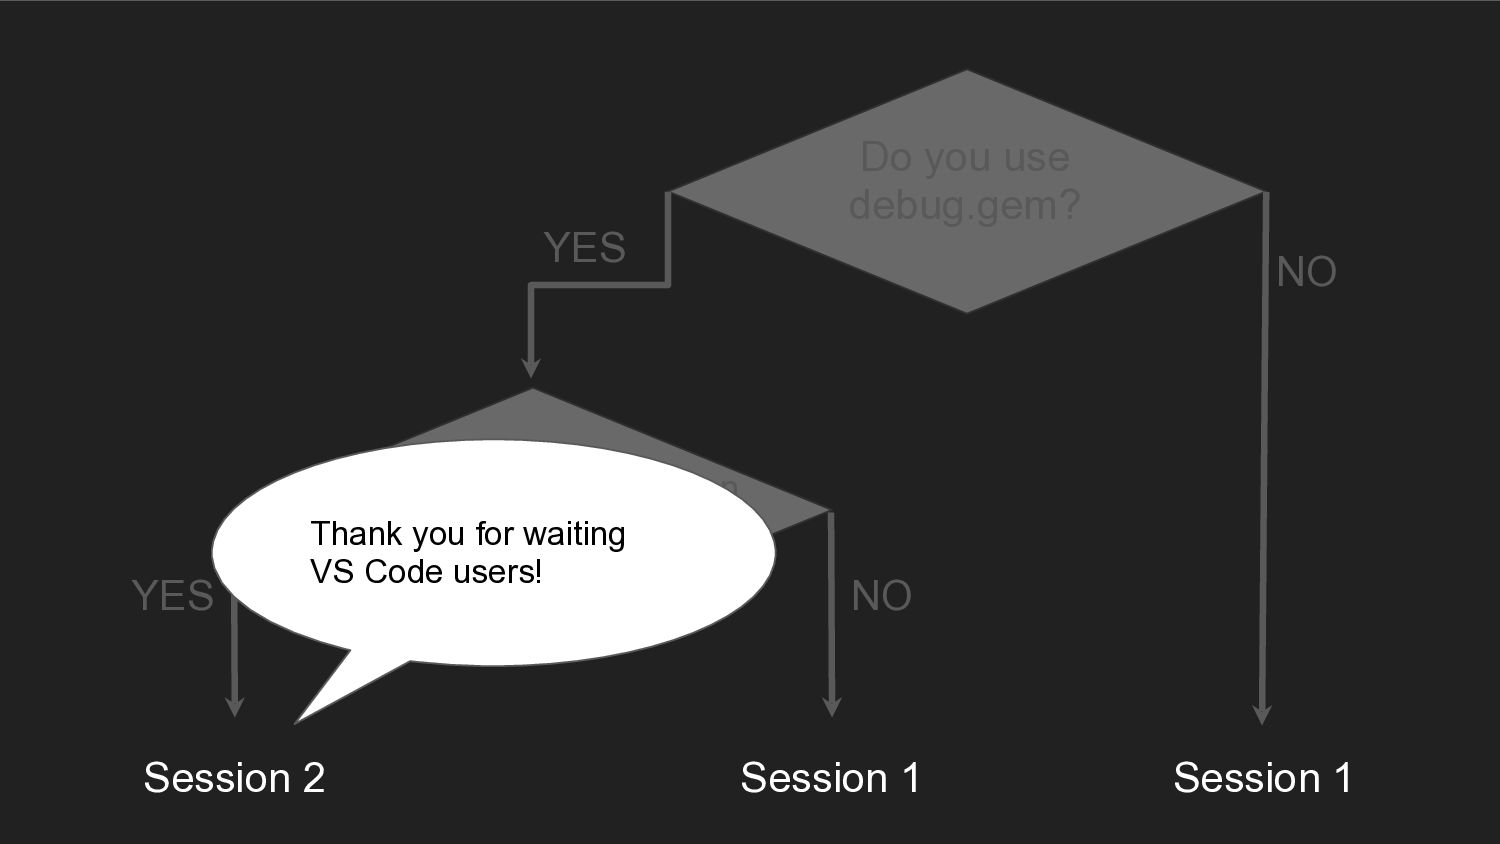
• This talk consists of two sessions • From now, you’ll answer some yes/no questions, then you’ll know which part to concentrate on the session 1, or session 2
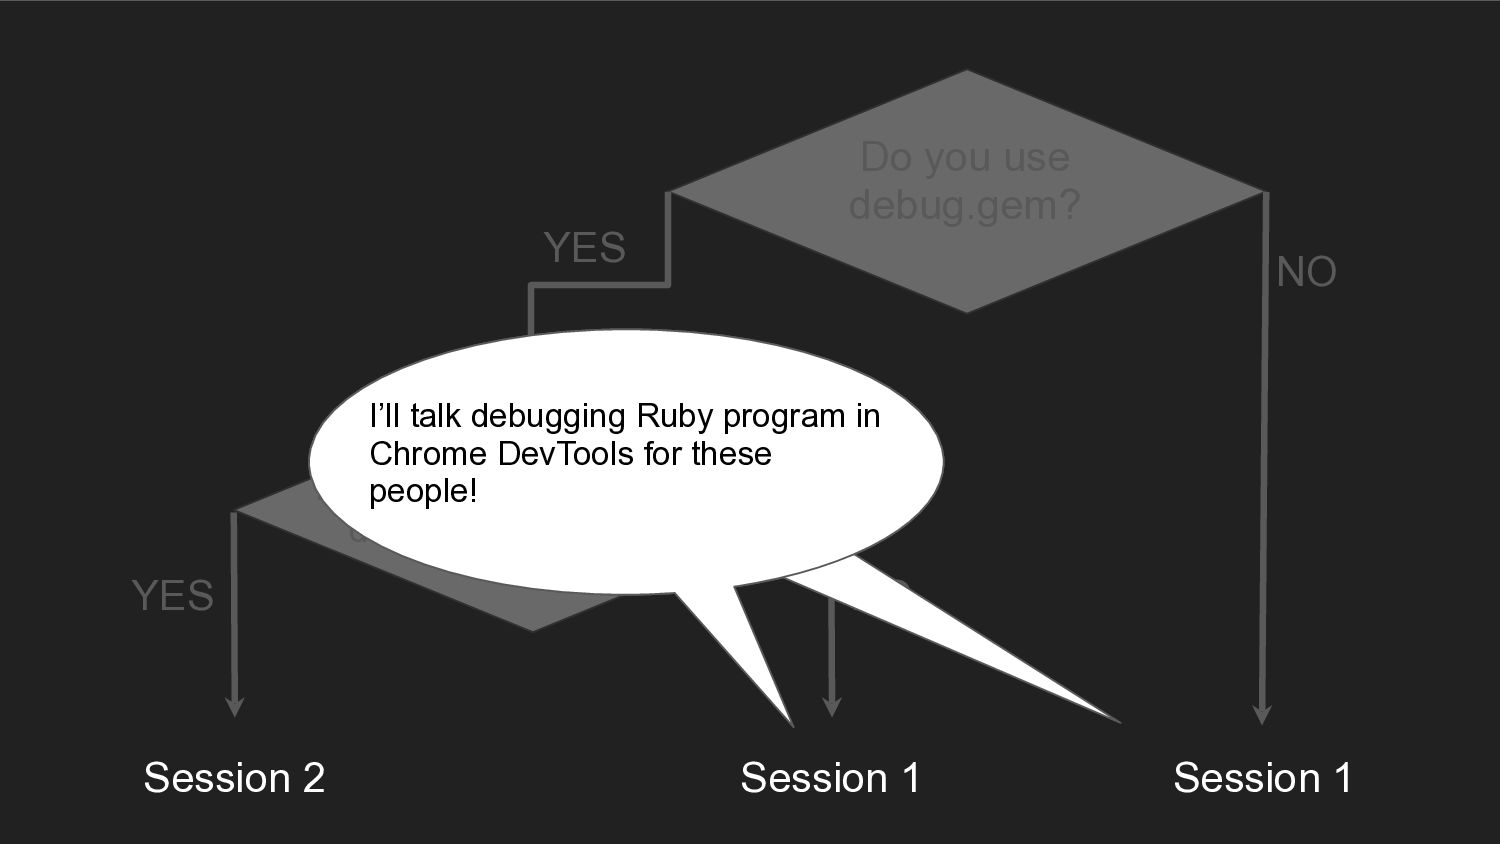
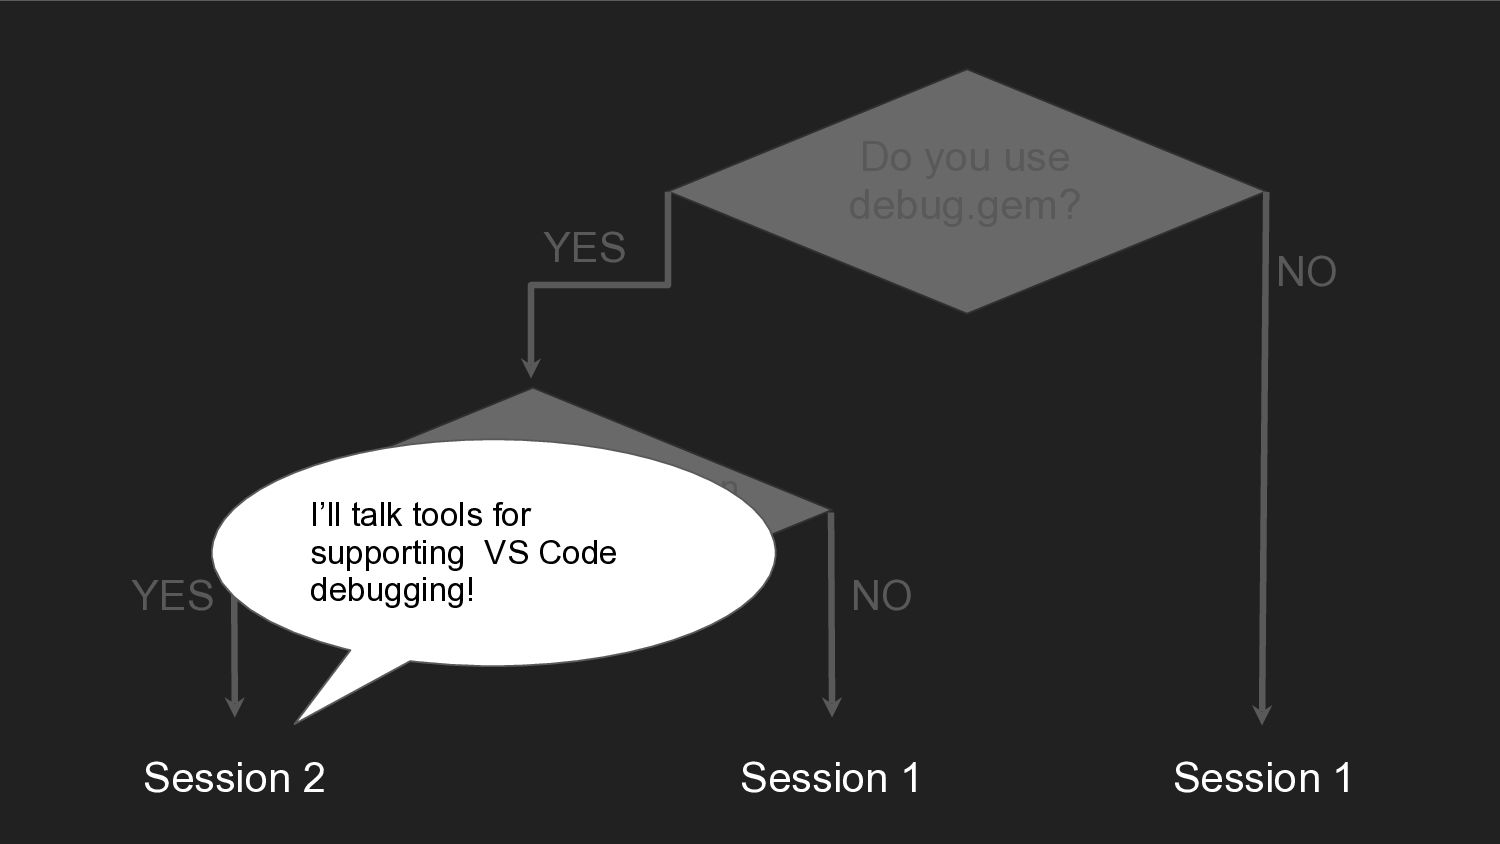
Code when debugging a program? YES NO YES NO Session 1 Session 1 I’ll talk debugging Ruby program in Chrome DevTools for these people! I’ll talk debugging Ruby program in Chrome DevTools for these people!
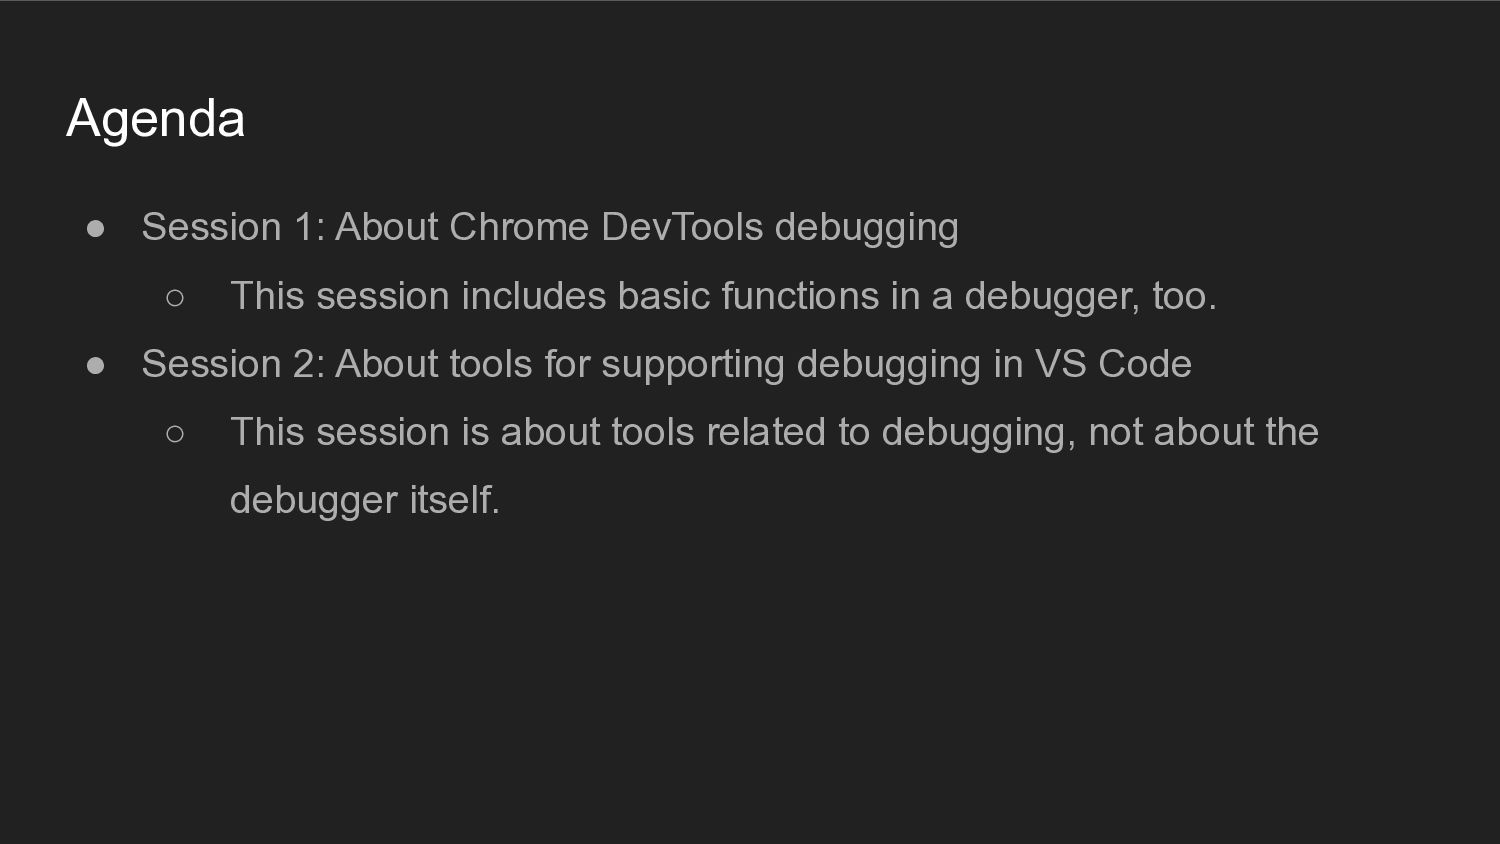
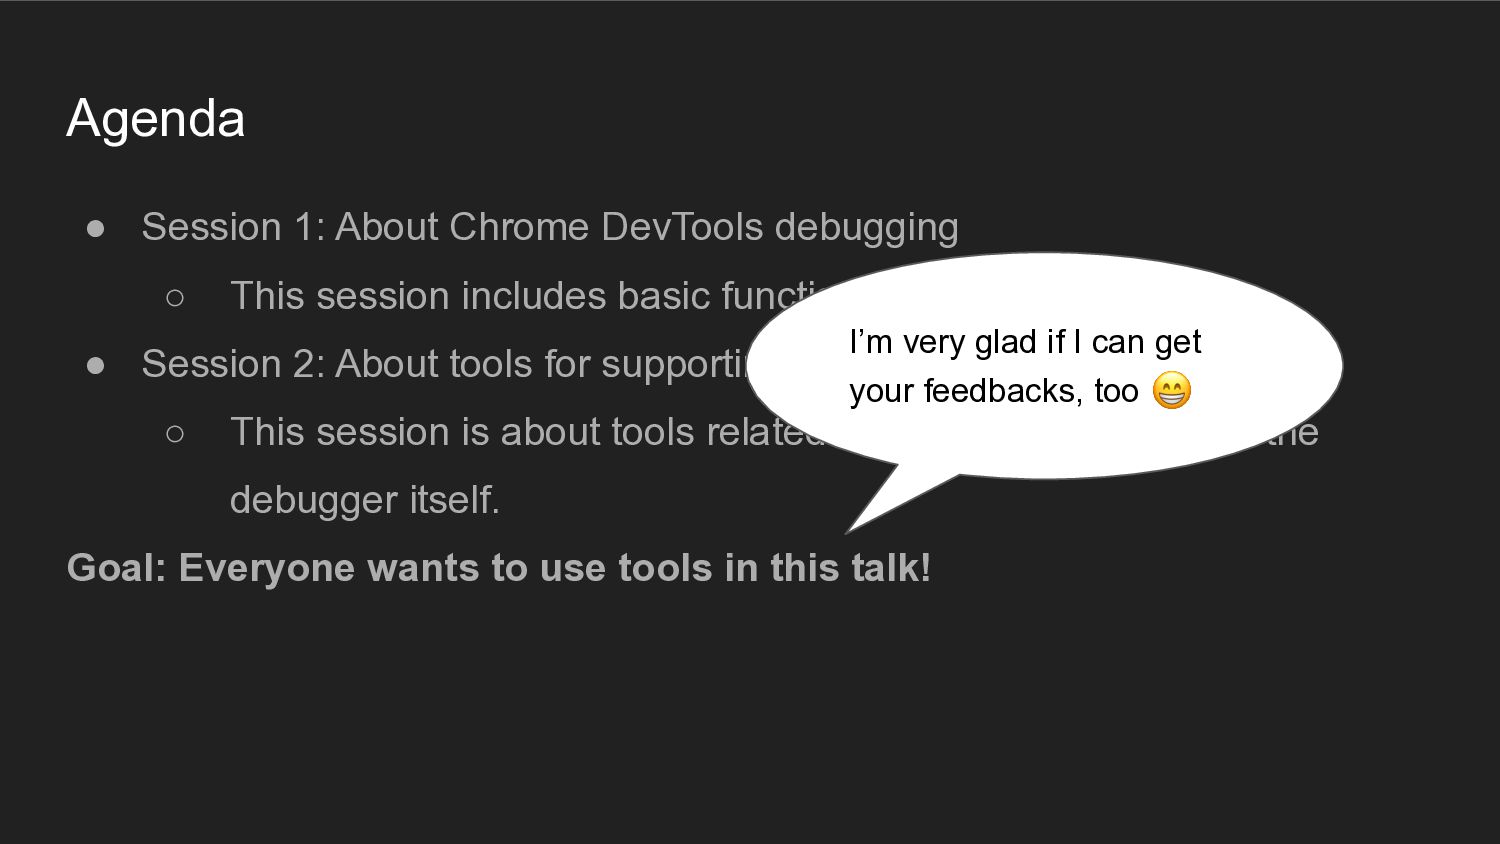
session includes basic functions in a debugger, too. • Session 2: About tools for supporting debugging in VS Code ◦ This session is about tools related to debugging, not about the debugger itself.
session includes basic functions in a debugger, too. • Session 2: About tools for supporting debugging in VS Code ◦ This session is about tools related to debugging, not about the debugger itself. Goal: Everyone wants to use tools in this talk! I’m very glad if I can get your feedbacks, too 😁
By supporting Chrome DevTools debugging, we can provide rich user experience to non-users of VS Code! • Project Goal: Implement functions in Chrome DevTools are comparable to those in VS Code
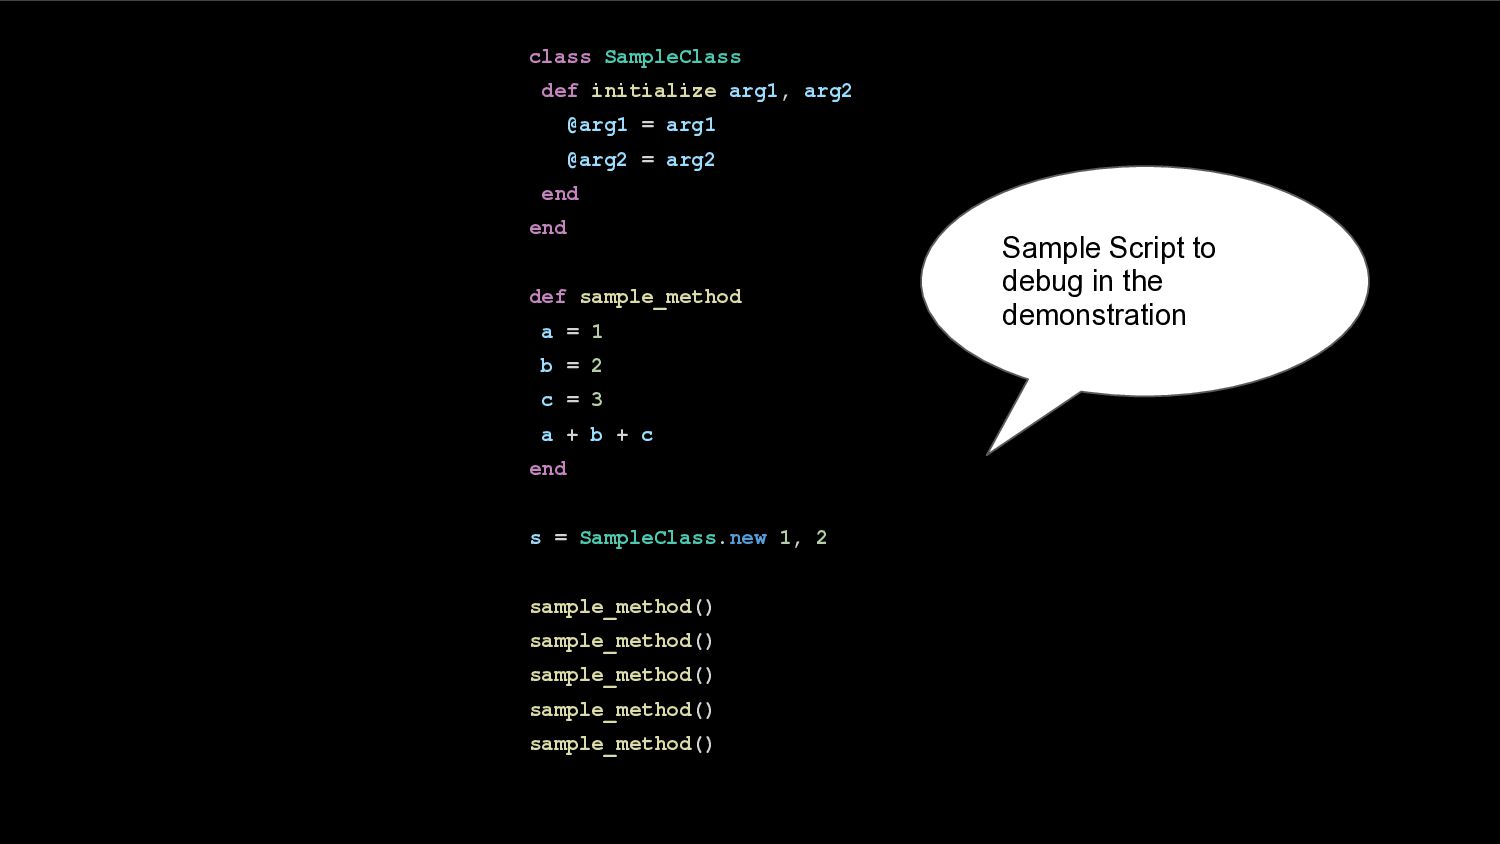
= arg2 end end def sample_method a = 1 b = 2 c = 3 a + b + c end s = SampleClass.new 1, 2 sample_method() sample_method() sample_method() sample_method() sample_method() Sample Script to debug in the demonstration
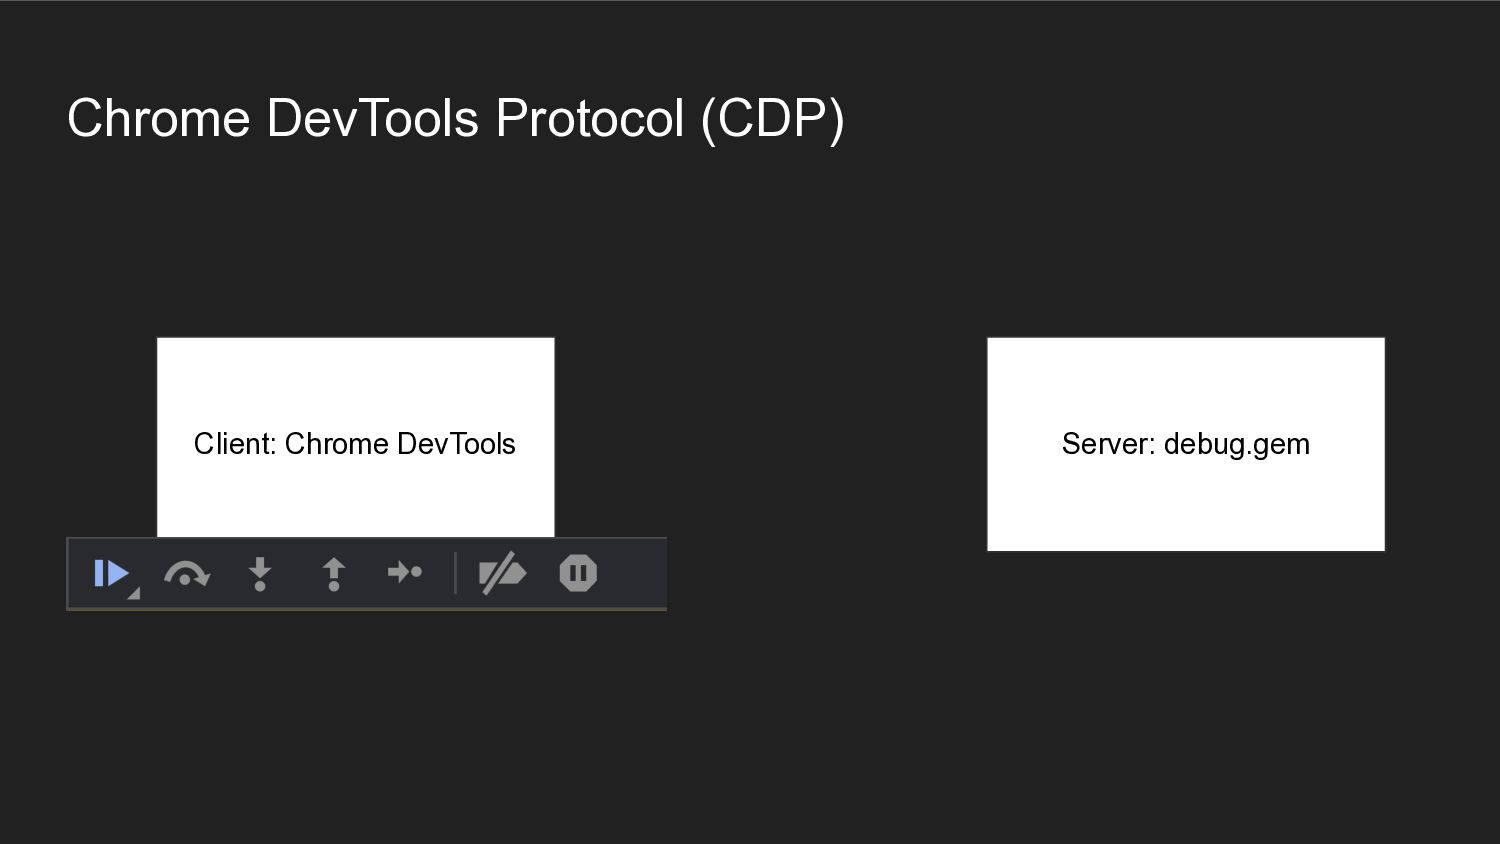
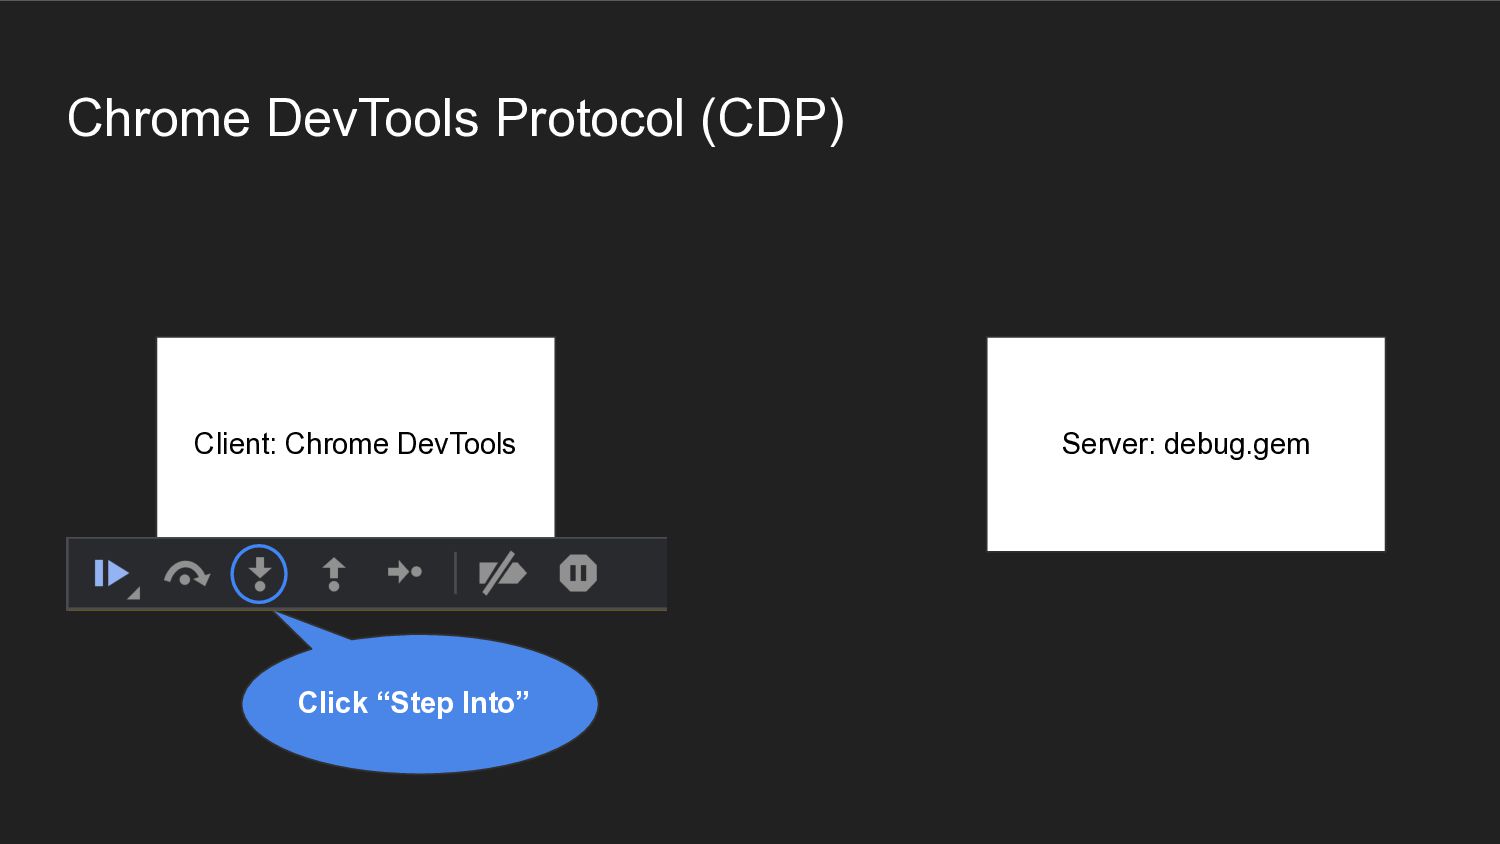
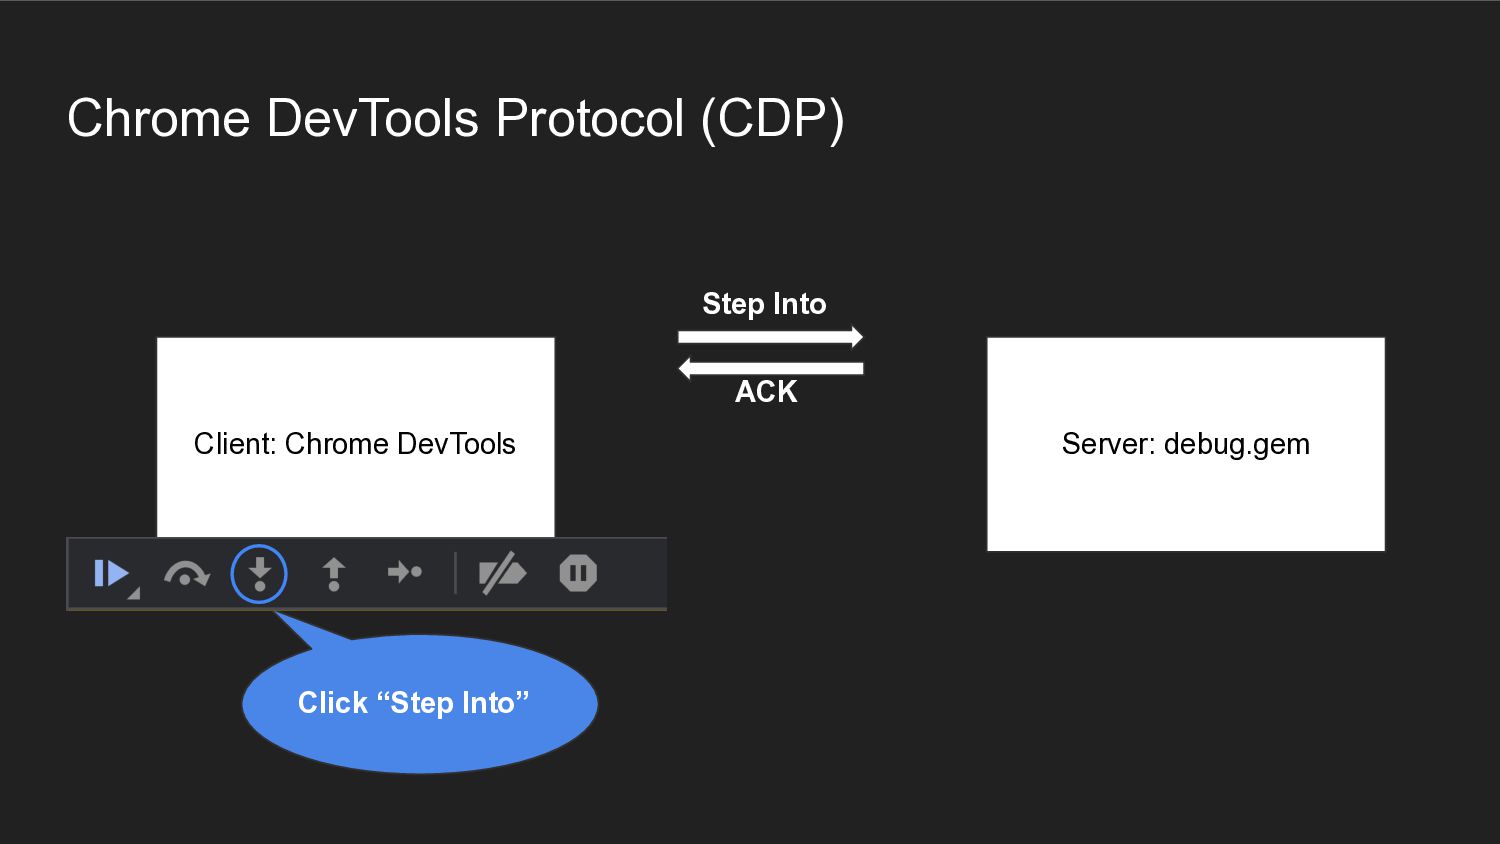
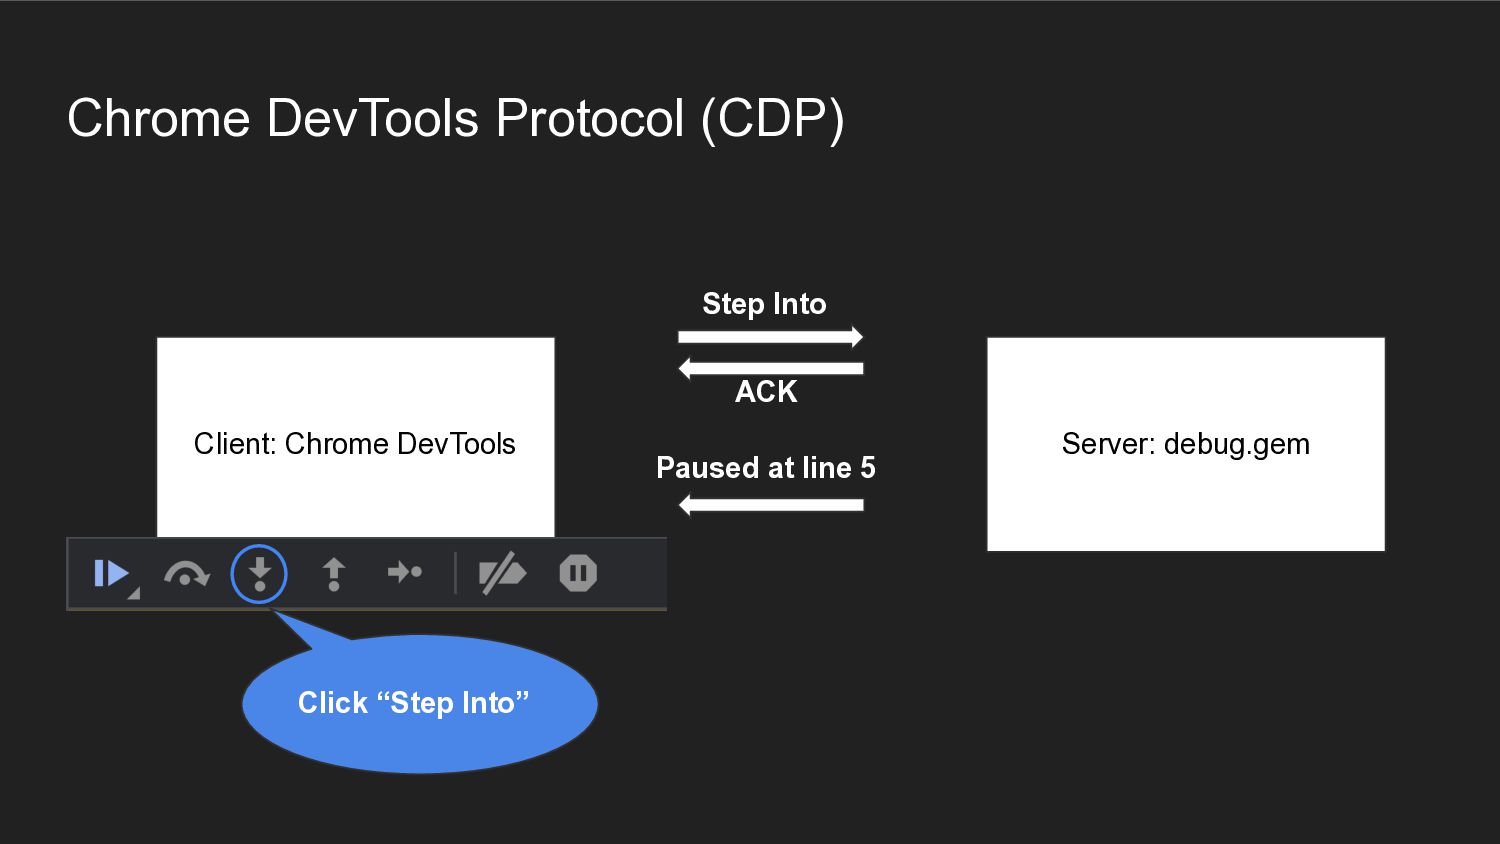
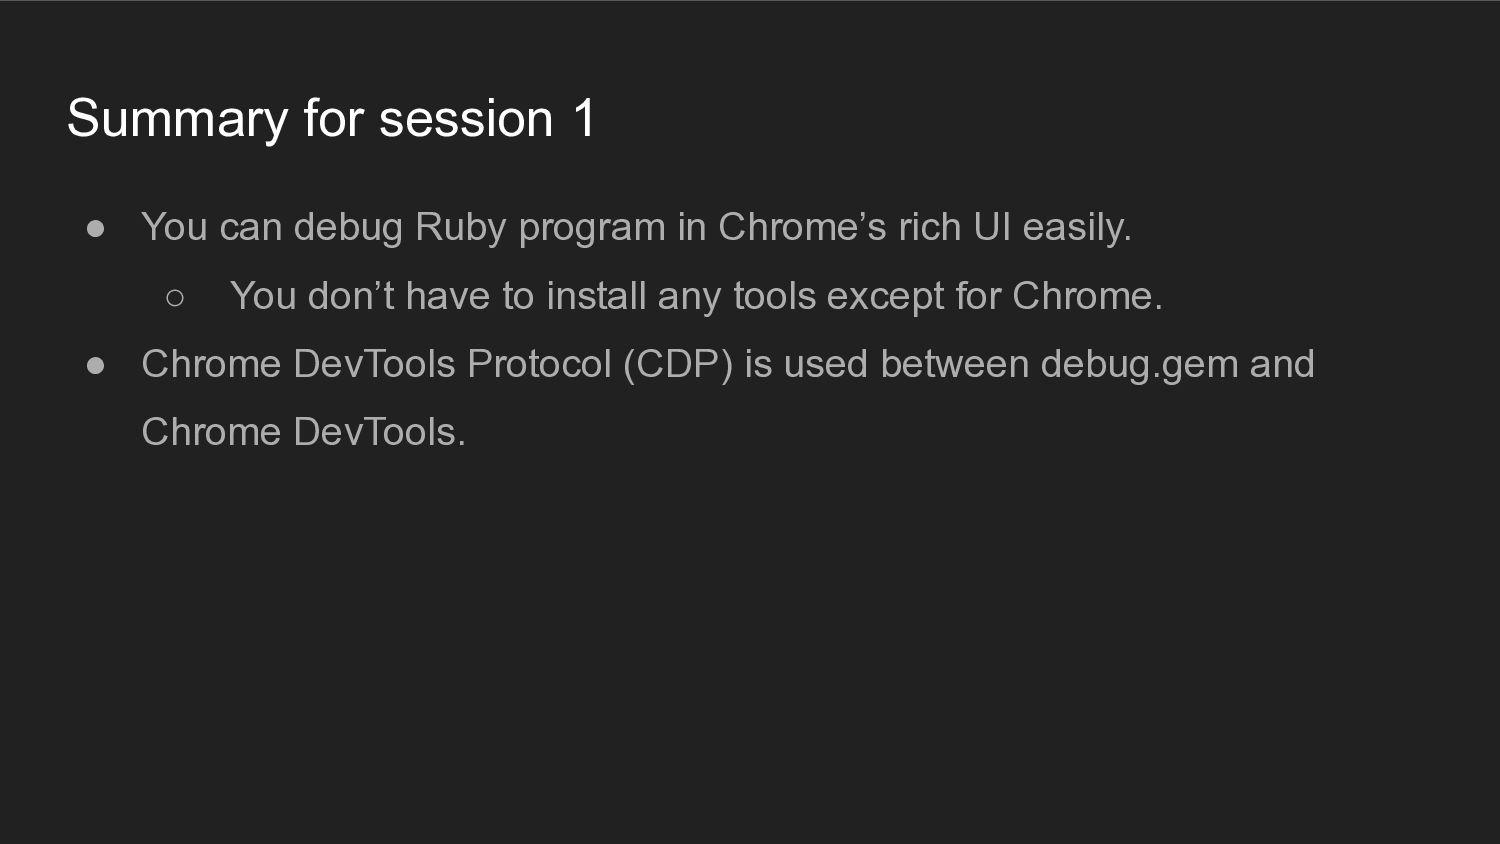
in Chrome’s rich UI easily. ◦ You don’t have to install any tools except for Chrome. • Chrome DevTools Protocol (CDP) is used between debug.gem and Chrome DevTools.
= arg2 end end def sample_method a = 1 b = 2 c = 3 a + b + c end s = SampleClass.new 1, 2 sample_method() sample_method() sample_method() sample_method() sample_method() Sample Script to debug in the demonstration
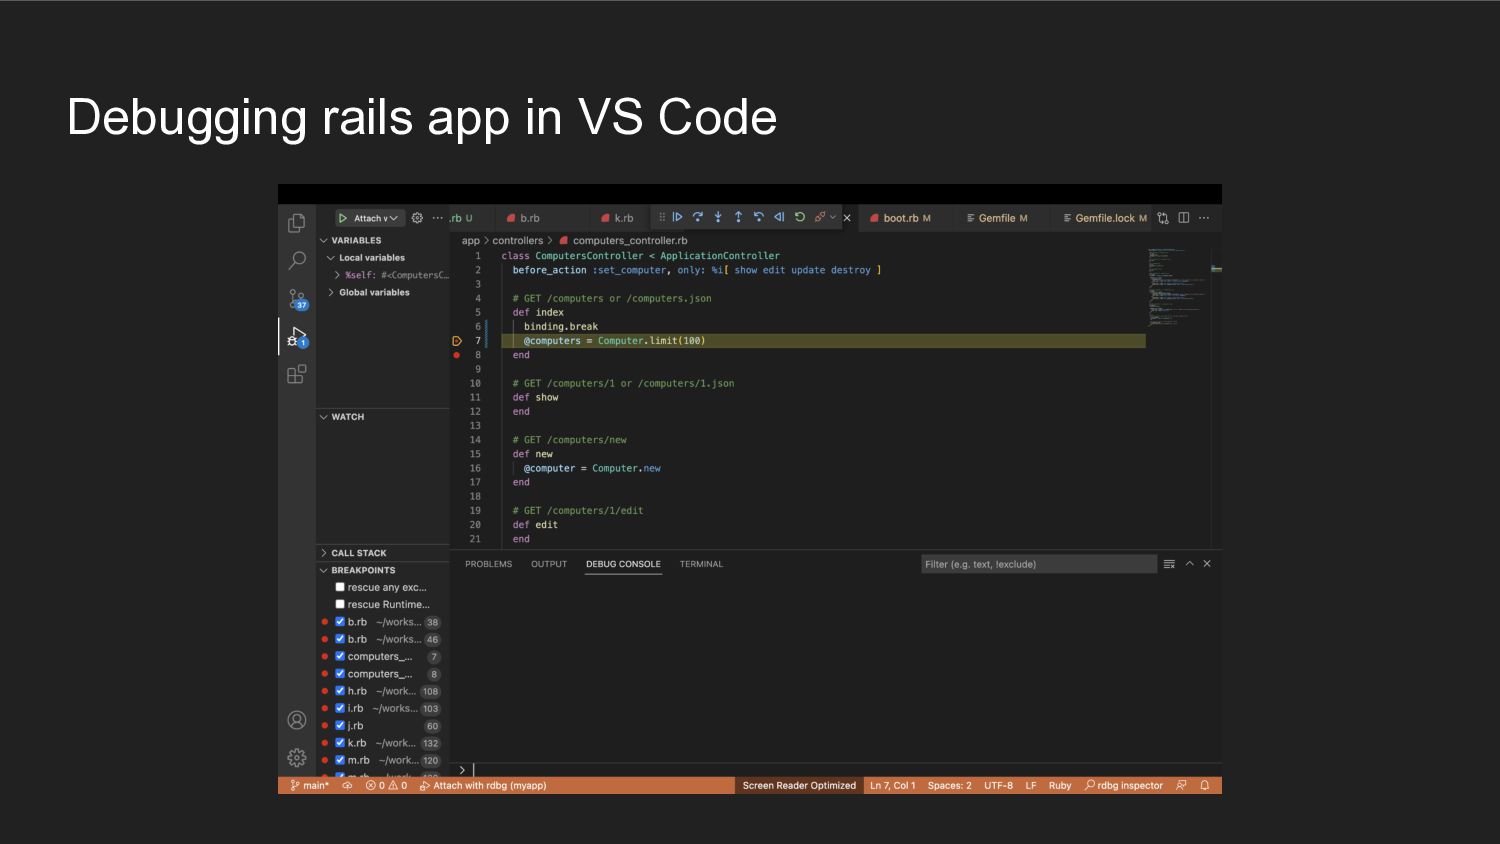
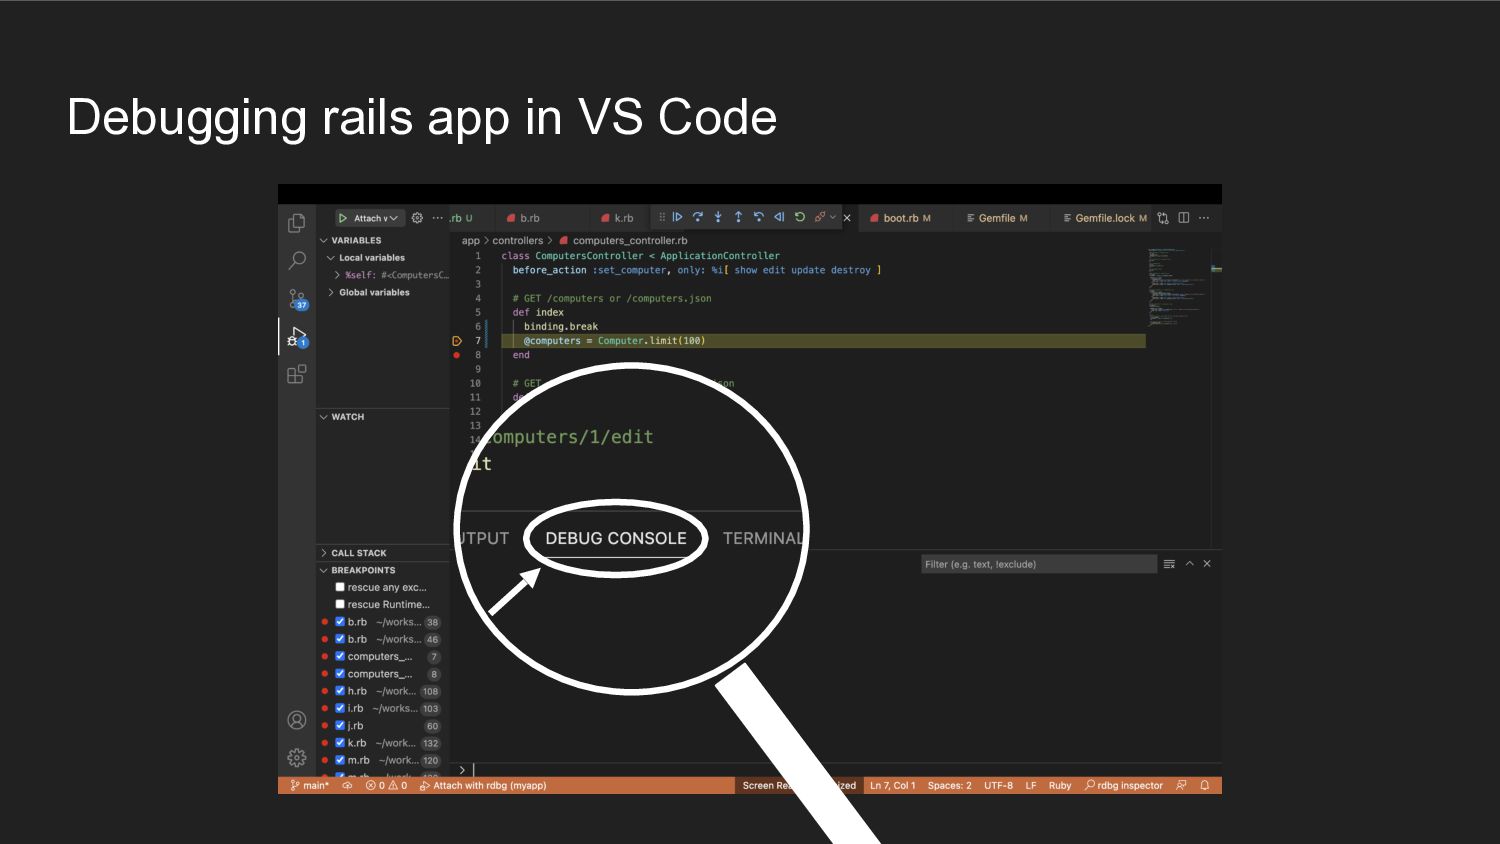
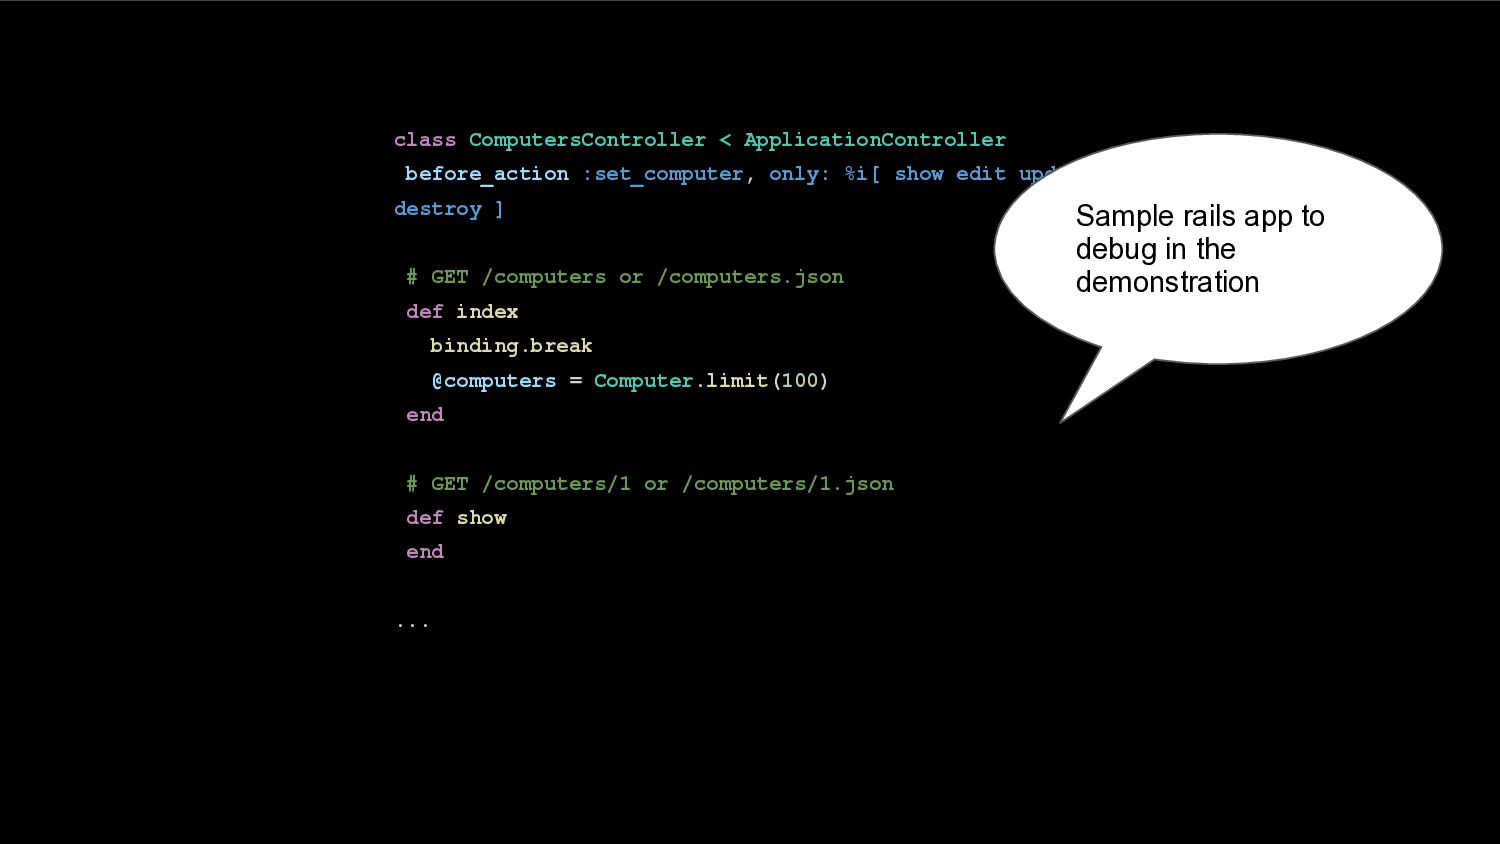
update destroy ] # GET /computers or /computers.json def index binding.break @computers = Computer.limit(100) end # GET /computers/1 or /computers/1.json def show end ... Sample rails app to debug in the demonstration
give us feedback! • If you want to learn how these tools work, ◦ https://chromedevtools.github.io/devtools-protocol/ ◦ https://microsoft.github.io/debug-adapter-protocol/ ◦ https://github.com/ruby/debug
of Chrome Integration and rdbg inspector ◦ If it had not been for his help, I wouldn’t have been here! • Thank you for helping me to implement Chrome Integration ◦ Andrea Cardaci (@cyrus-and) ▪ Author of chrome remote-interface ◦ Geoffrey Litt (@geoffreylitt) ▪ Author of ladybug • Thanks to the following organization, I can continue developing debugging tools ◦ Ruby Association ◦ Google Summer of Code Acknowledgement