$30 off During Our Annual Pro Sale. View Details »

Quantified Self Adventures at Wolfram

paul-jean
April 02, 2014

Quantified Self Adventures at Wolfram

My adventures analyzing personal data at Wolfram, as lead data analyst on the March 2012 quantified self blog post.

April 2014, Data Raves NYC: http://www.meetup.com/Data-Rave/events/170730922/

paul-jean

April 02, 2014
Tweet

More Decks by paul-jean

Other Decks in Programming

Transcript

  1. Slide 1 of 17
    Quantified Self Adventures at Wolfram
    Paul-Jean Letourneau
    Hacker School W’
    14
    0 100 200 300 400
    interval ms
    w o o l l f f r r a a m

    View Slide

  2. Stephen Wolfram’
    s blog post (March 2012)
    I was the lead data analyst for Stephen Wolfram’
    s quantified self blog post:
    2 data-rave-slides.nb

    View Slide

  3. email
    We had about 20 years worth of personal data!
    Each dot is a sent email on date X and time Y (“
    diurnal plot”
    ):
    data-rave-slides.nb 3

    View Slide

  4. keystrokes
    The diurnal plot of keystrokes is very similar to the email plot:
    4 data-rave-slides.nb

    View Slide

  5. phone calls and meetings
    Phone call spikes on the hour? 
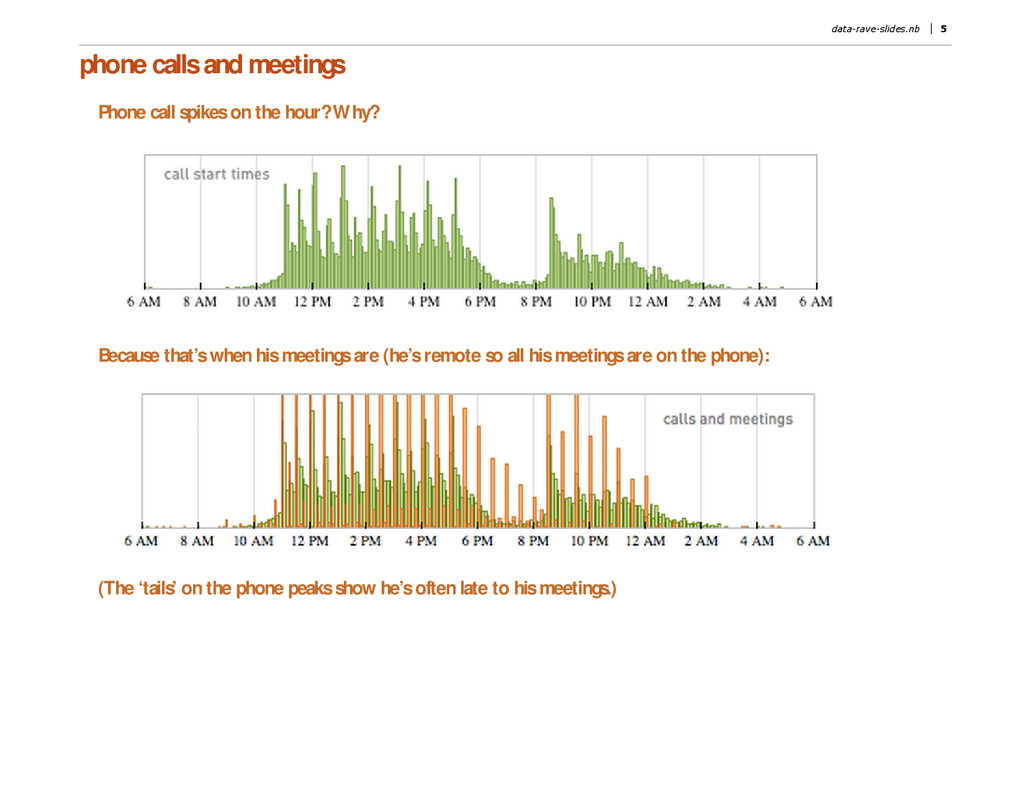
Why?
    Because that’
    s when his meetings are (he’
    s remote so all his meetings are on the phone):
    (The ‘
    tails’
    on the phone peaks show he’
    s often late to his meetings.)
    data-rave-slides.nb 5

    View Slide

  6. Awesome! Show me the code!
    6 data-rave-slides.nb

    View Slide

  7. follow-up blog posts
    We wrote several follow-up posts showing detailed code for analyzing email, keystrokes, and pedometer data:
    data-rave-slides.nb 7

    View Slide

  8. I wrote an interface for analyzing your keystrokes:
    8 data-rave-slides.nb

    View Slide

  9. data collection
    Type “
    wolfram” a bunch of times, then grab the data:
    data-rave-slides.nb 9

    View Slide

  10. my keystrokes
    Letter pair intervals when typing “
    wolfram” (after 
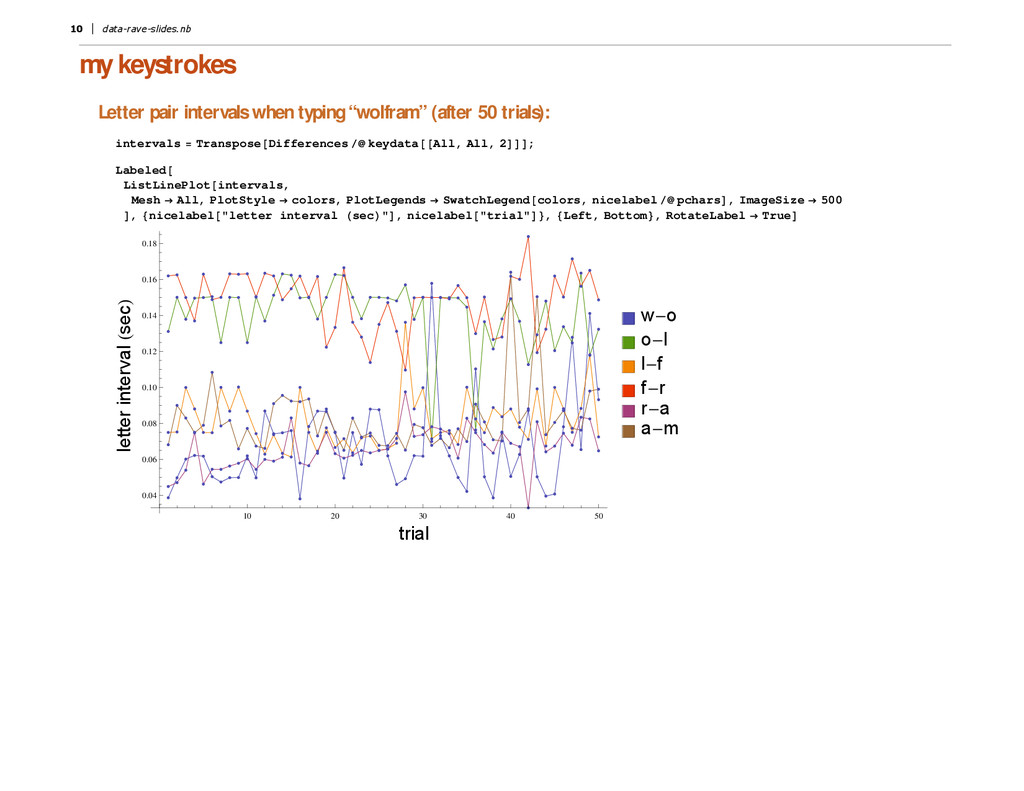
50 trials):
    intervals Transpose Differences keydata All, All, 2 ;
    Labeled
    ListLinePlot intervals,
    Mesh All, PlotStyle colors, PlotLegends SwatchLegend colors, nicelabel pchars , ImageSize 500
    , nicelabel "letter interval sec " , nicelabel "trial" , Left, Bottom , RotateLabel True
    letter interval sec
    10 20 30 40 50
    0.04
    0.06
    0.08
    0.10
    0.12
    0.14
    0.16
    0.18
    w o
    o l
    l f
    f r
    r a
    a m
    trial
    10 data-rave-slides.nb

    View Slide

  11. letter interval distribution
    My letter pair interval distribution is bimodal:
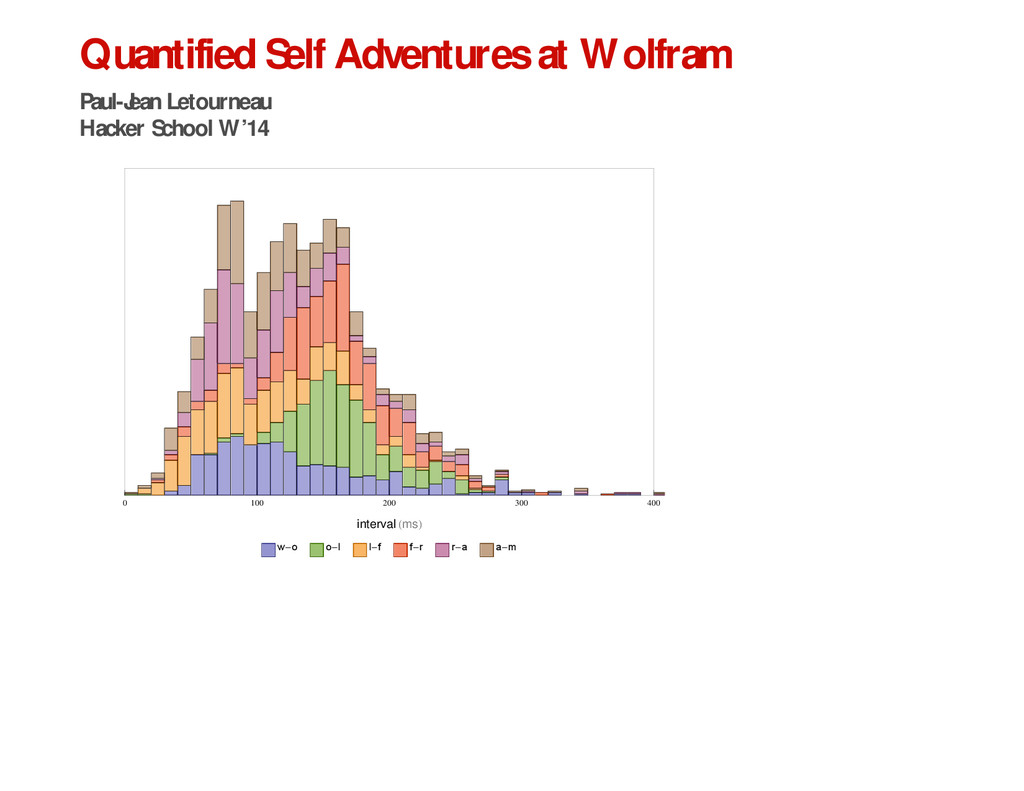
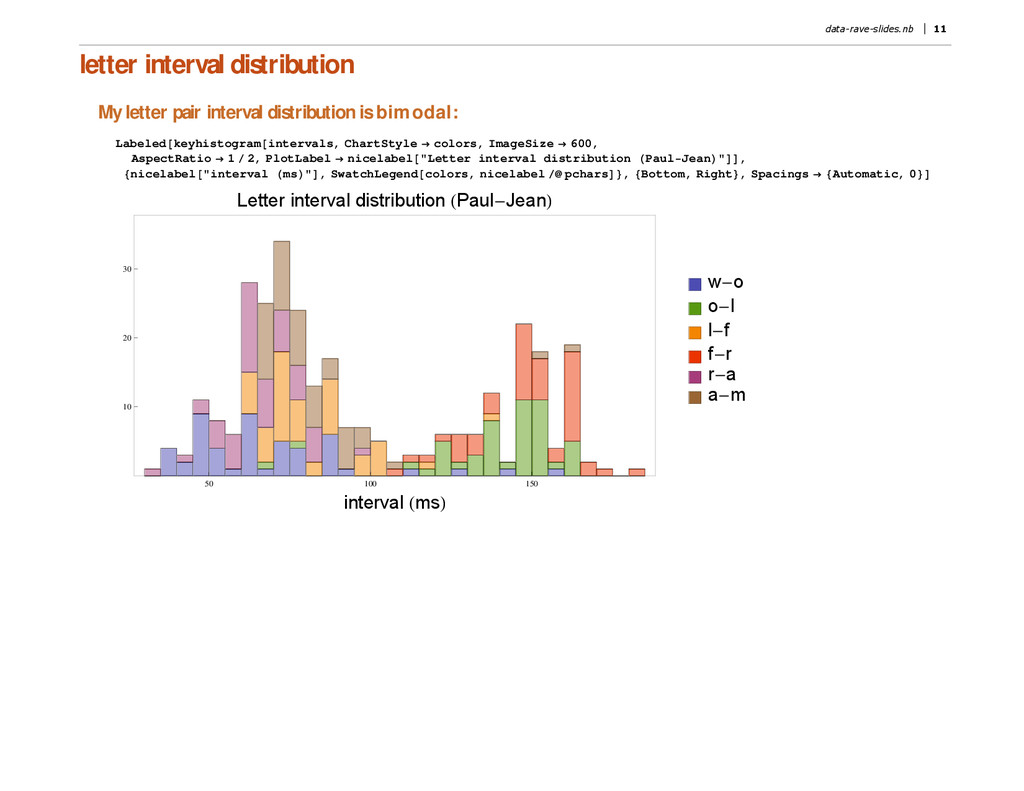
    Labeled keyhistogram intervals, ChartStyle colors, ImageSize 600,
    AspectRatio 1 2, PlotLabel nicelabel "Letter interval distribution Paul Jean " ,
    nicelabel "interval ms " , SwatchLegend colors, nicelabel pchars , Bottom, Right , Spacings Automatic, 0
    50 100 150
    10
    20
    30
    Letter interval distribution Paul Jean
    w o
    o l
    l f
    f r
    r a
    a m
    interval ms
    data-rave-slides.nb 11

    View Slide

  12. the “
    same finger” rule?
    Letter pairs on the same finger ~ 150 ms
    Letter pairs on different fingers ~ 75 ms
    Mean Flatten intervals 1, 3, 5, 6
    0.074238
    Mean Flatten intervals 2, 4
    0.144710
    Does it take about twice as long for other people too?
    12 data-rave-slides.nb

    View Slide

  13. company experiment
    I got keystroke data from 42 data nerds at Wolfram:
    meanswolfram Mean Transpose Differences & All, All, 2 & wolframdata;
    Legended
    Grid Partition keychart , ImageSize 100, ChartStyle Directive Opacity 0.6 , & colors & meanswolfram,
    7, 7, 1, , SwatchLegend colors, nicelabel pchars
    w o
    o l
    l f
    f r
    r a
    a m
    data-rave-slides.nb 13

    View Slide

  14. Wolfram nerds typing “
    wolfram”
    The Wolfram interval distribution was 
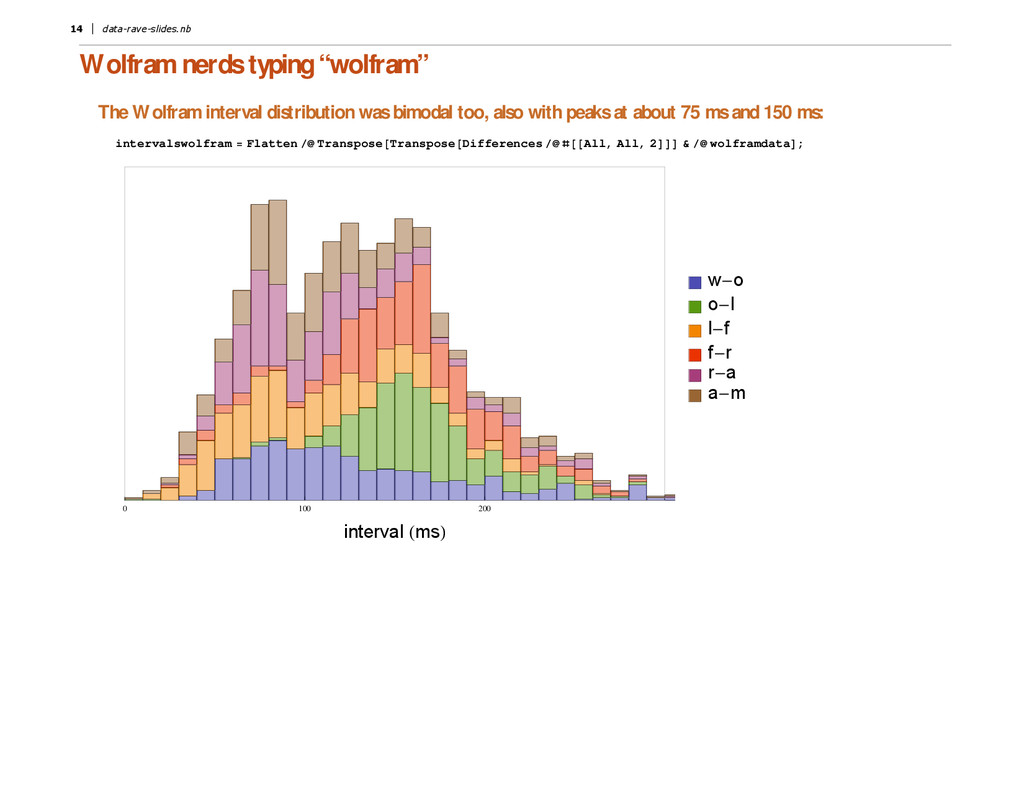
bimodal too, also with peaks at about 75 ms and 150 ms:
    intervalswolfram Flatten Transpose Transpose Differences All, All, 2 & wolframdata ;
    0 100 200
    w o
    o l
    l f
    f r
    r a
    a m
    interval ms
    14 data-rave-slides.nb

    View Slide

  15. linear model
    ... But it’
    s not just a 2x 
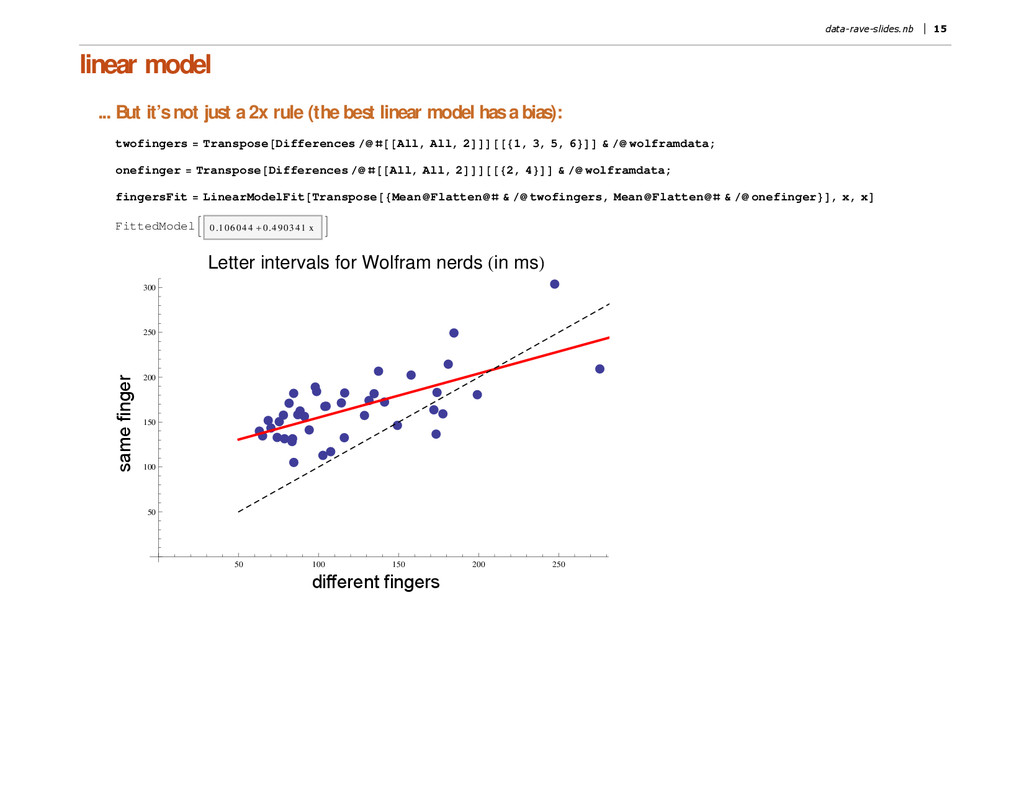
rule (the best linear model has a bias):
    twofingers Transpose Differences All, All, 2 1, 3, 5, 6 & wolframdata;
    onefinger Transpose Differences All, All, 2 2, 4 & wolframdata;
    fingersFit LinearModelFit Transpose Mean Flatten & twofingers, Mean Flatten & onefinger , x, x
    FittedModel
    0.106044 0.490341 x
    Letter intervals for Wolfram nerds in ms
    same finger
    50 100 150 200 250
    50
    100
    150
    200
    250
    300
    different fingers
    data-rave-slides.nb 15

    View Slide

  16. conclusions
    Stephen Wolfram’
    s quantified self blog made a splash.
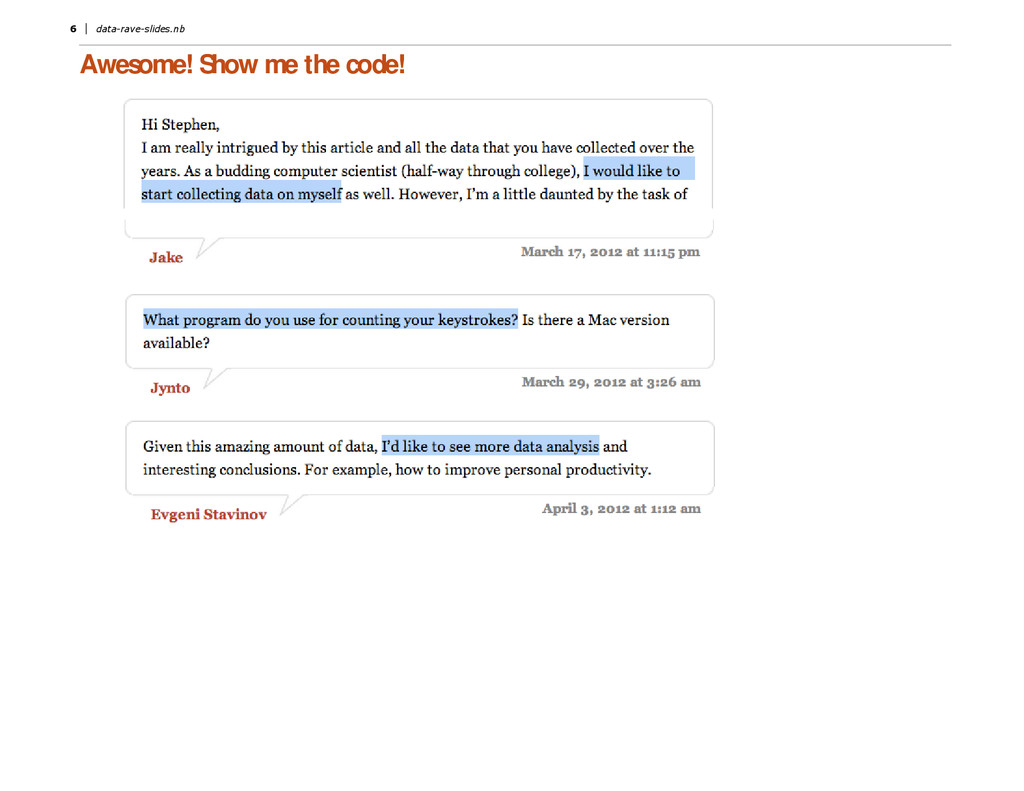
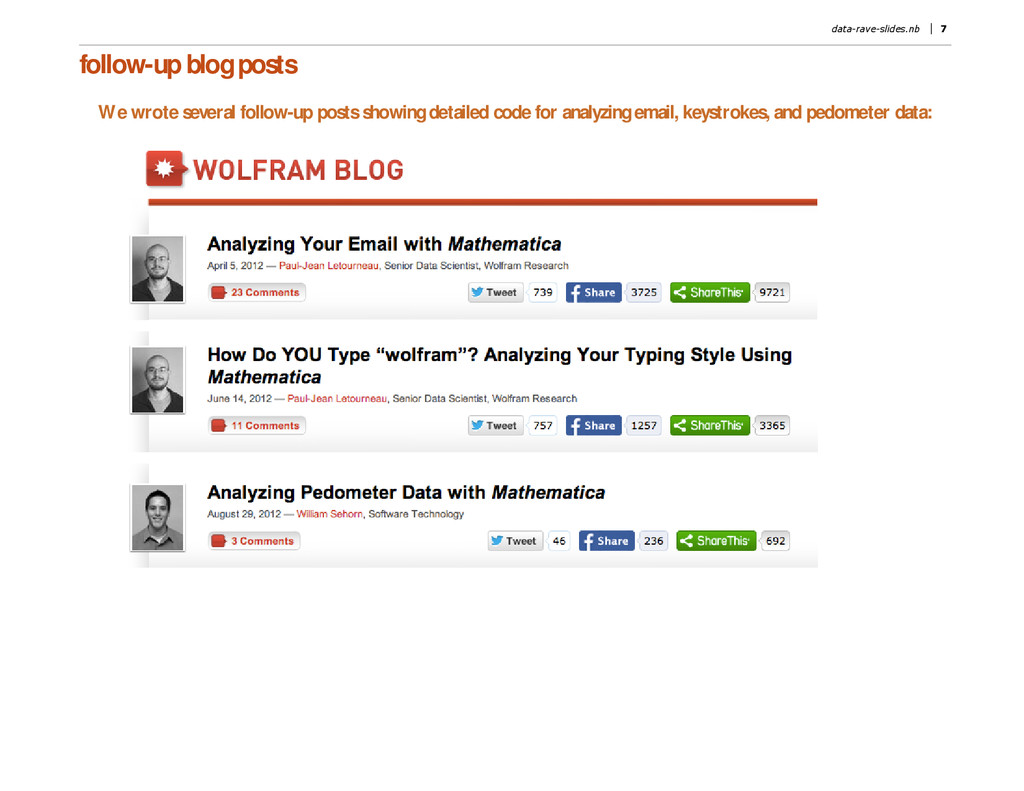
    But people said: show me the code!
    Our follow-up posts showed people how to analyze their own data.
    Fun modeling keystrokes times with Mathematica.
    16 data-rave-slides.nb

    View Slide

  17. thanks!
    @rule146
    data-rave-slides.nb 17

    View Slide