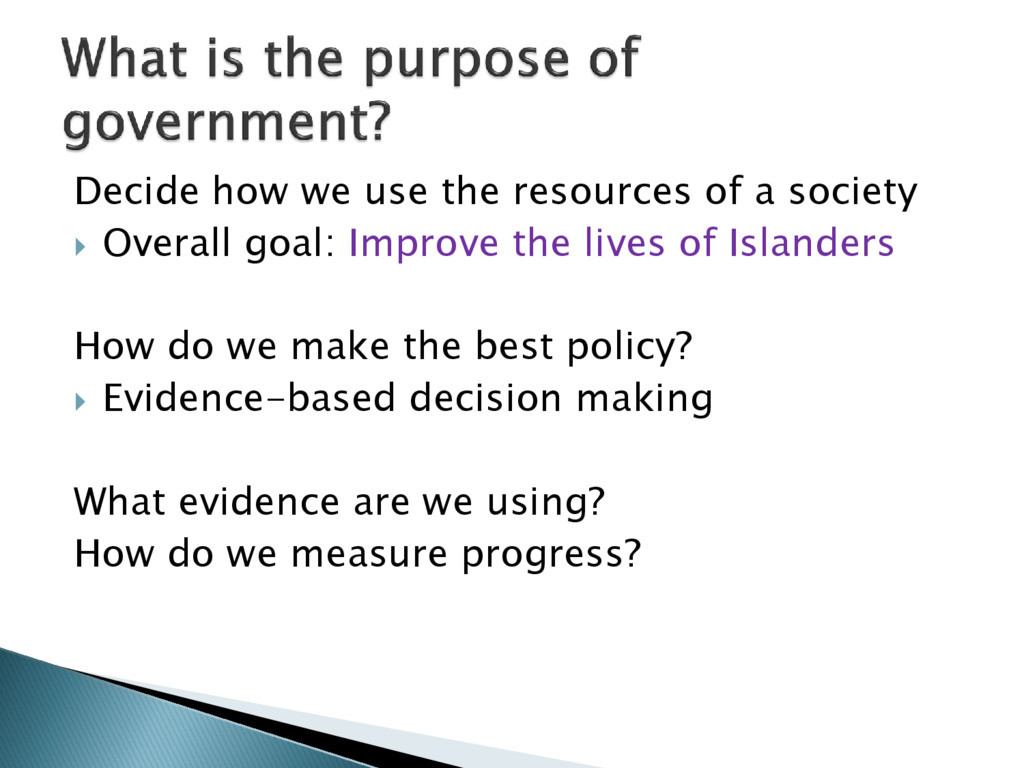
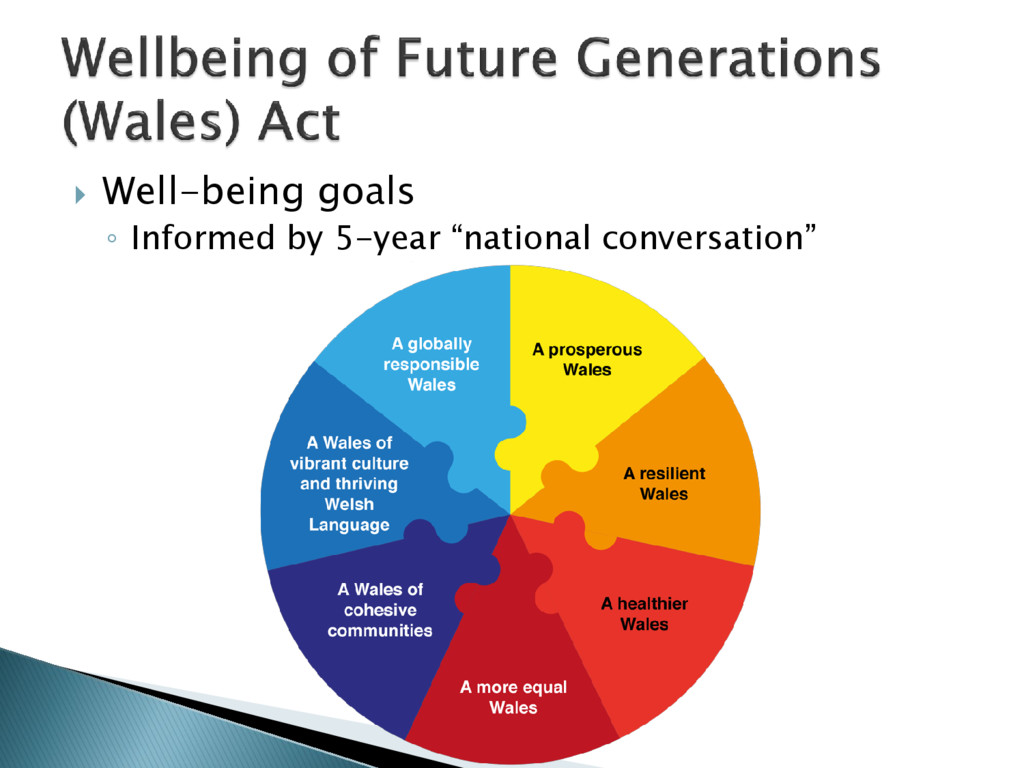
Overall goal: Improve the lives of Islanders How do we make the best policy? Evidence-based decision making What evidence are we using? How do we measure progress?
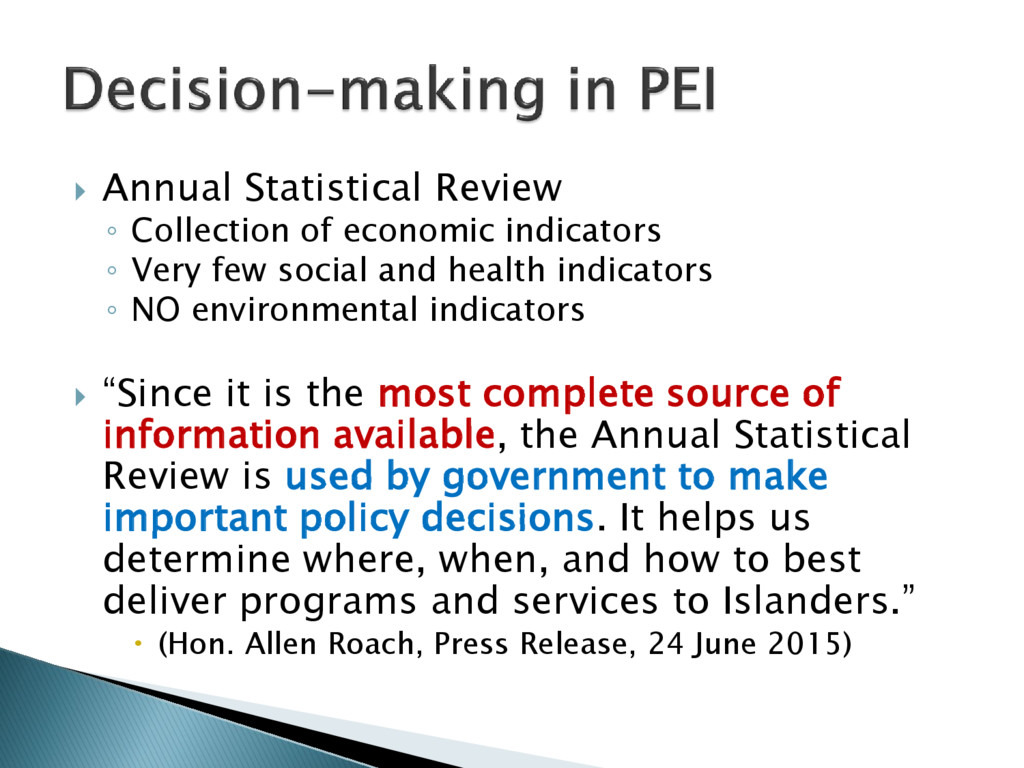
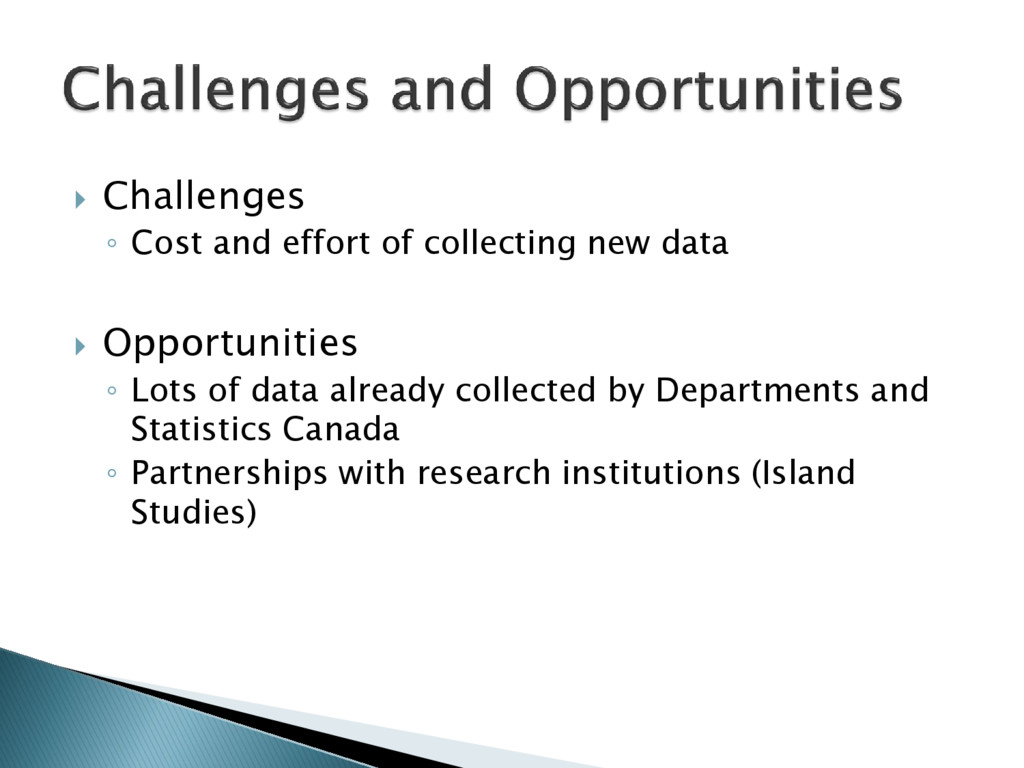
Very few social and health indicators ◦ NO environmental indicators “Since it is the most complete source of information available, the Annual Statistical Review is used by government to make important policy decisions. It helps us determine where, when, and how to best deliver programs and services to Islanders.” (Hon. Allen Roach, Press Release, 24 June 2015)
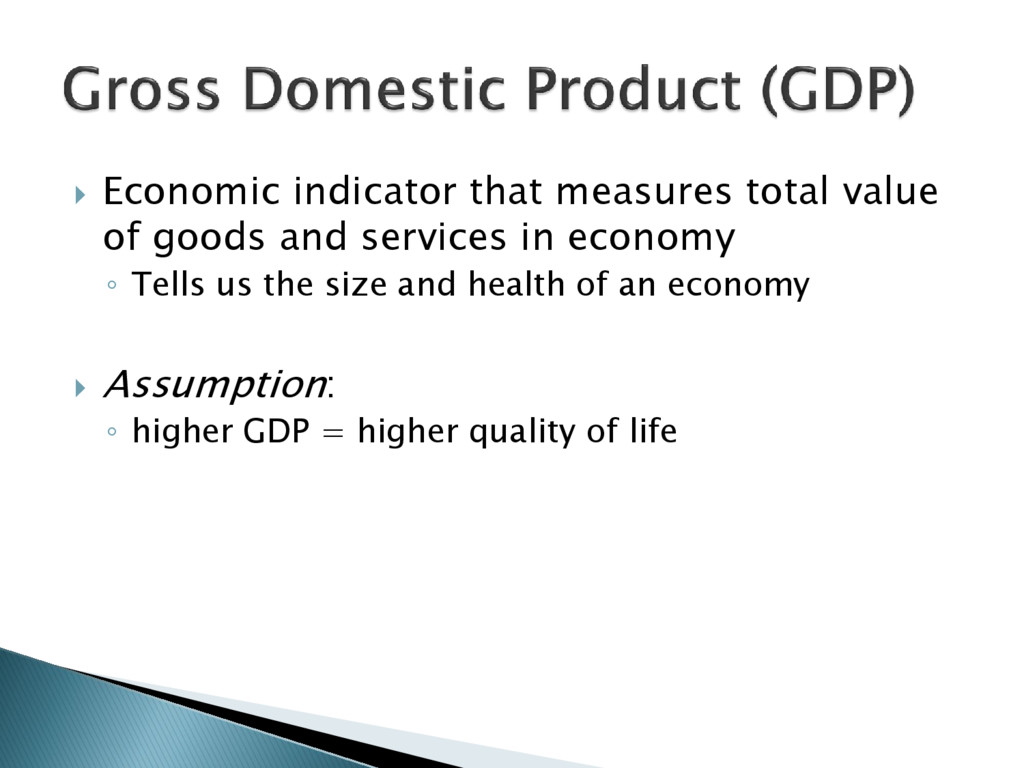
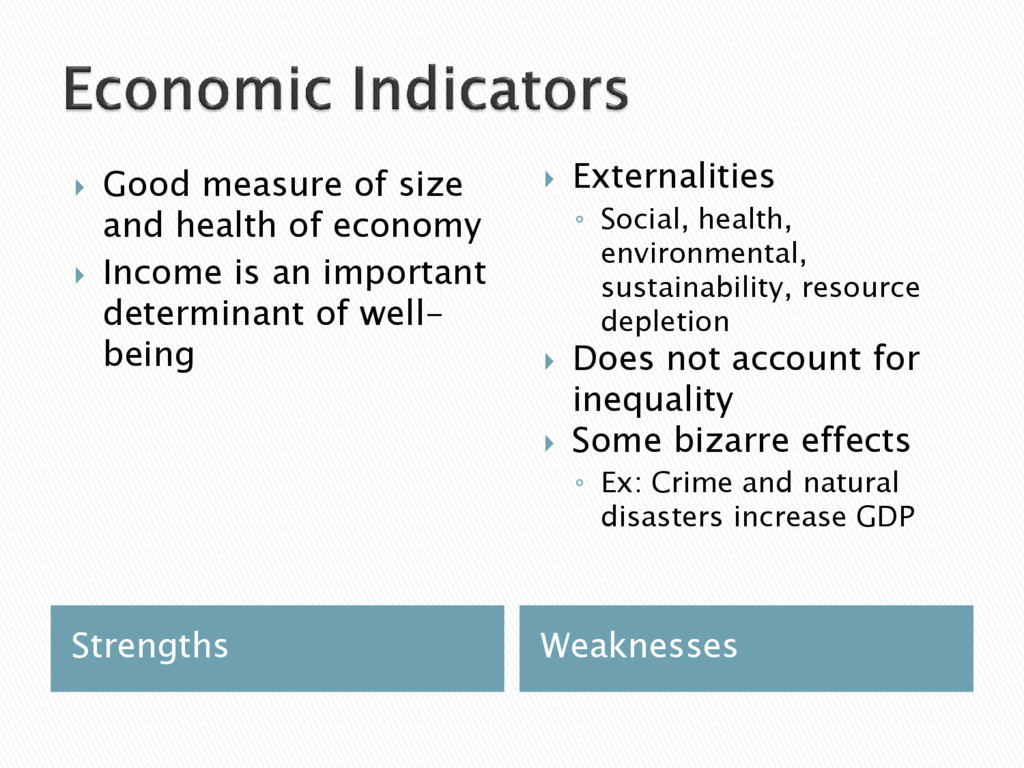
economy Income is an important determinant of well- being Externalities ◦ Social, health, environmental, sustainability, resource depletion Does not account for inequality Some bizarre effects ◦ Ex: Crime and natural disasters increase GDP
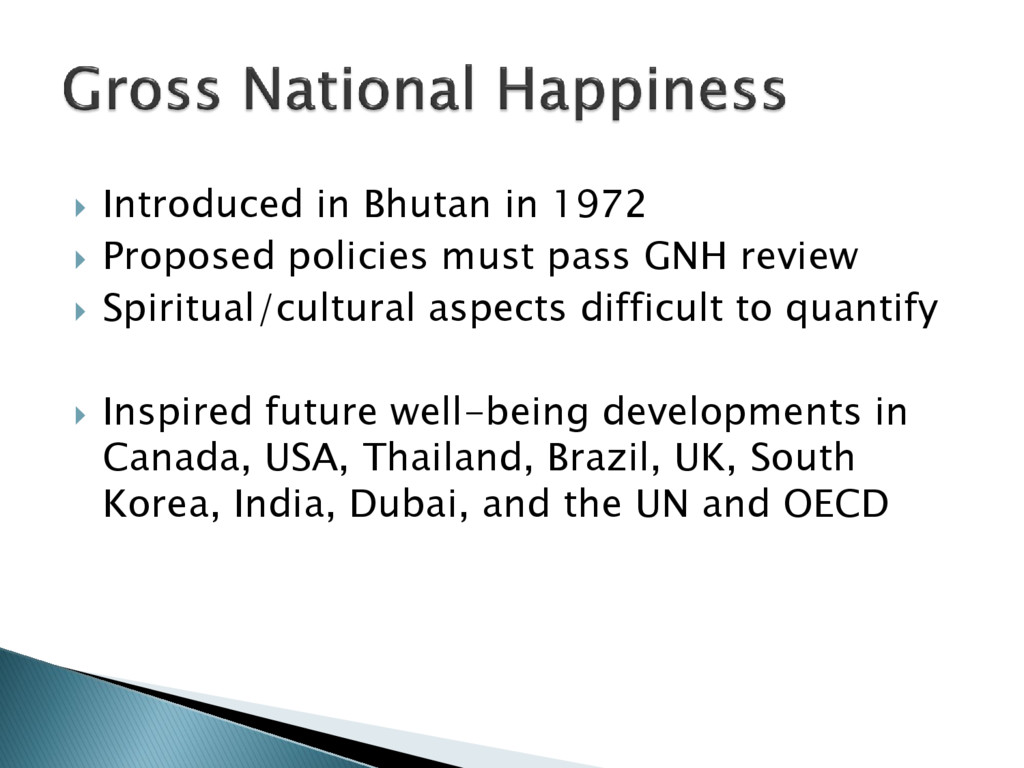
pass GNH review Spiritual/cultural aspects difficult to quantify Inspired future well-being developments in Canada, USA, Thailand, Brazil, UK, South Korea, India, Dubai, and the UN and OECD
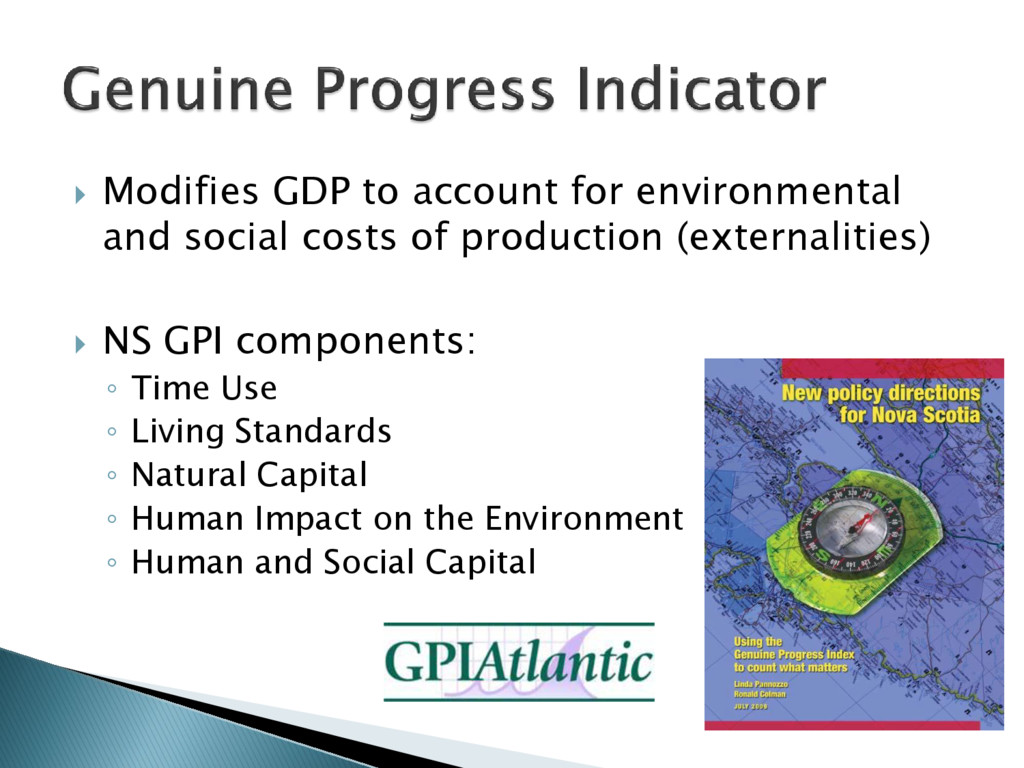
of production (externalities) NS GPI components: ◦ Time Use ◦ Living Standards ◦ Natural Capital ◦ Human Impact on the Environment ◦ Human and Social Capital
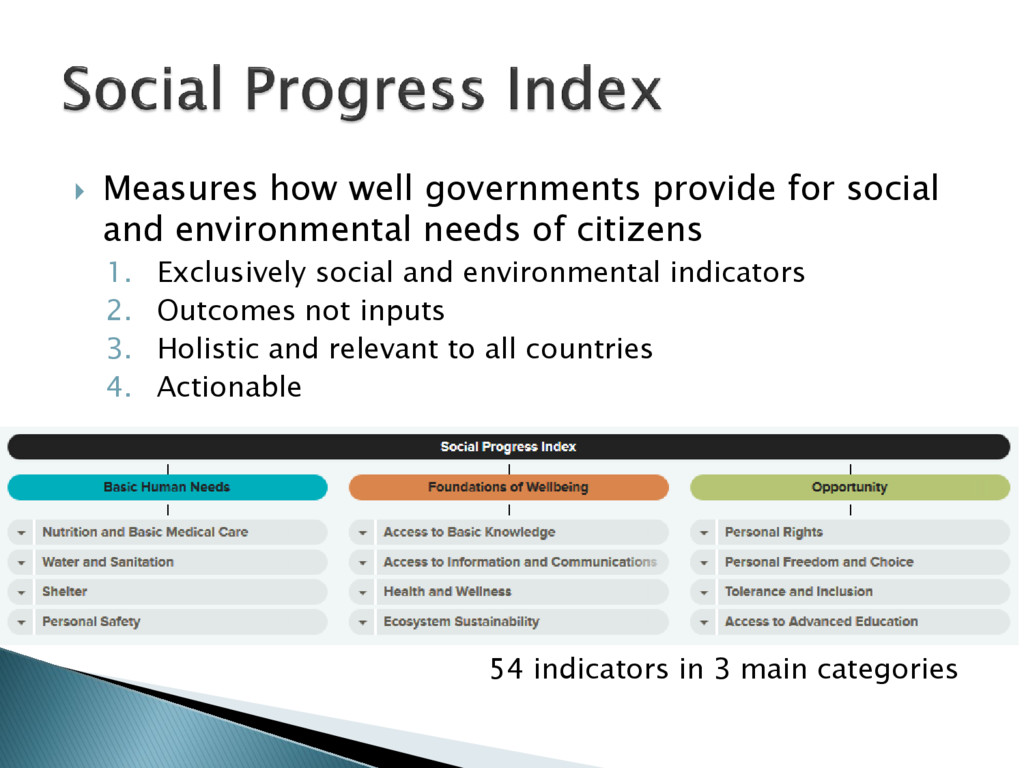
needs of citizens 1. Exclusively social and environmental indicators 2. Outcomes not inputs 3. Holistic and relevant to all countries 4. Actionable 54 indicators in 3 main categories
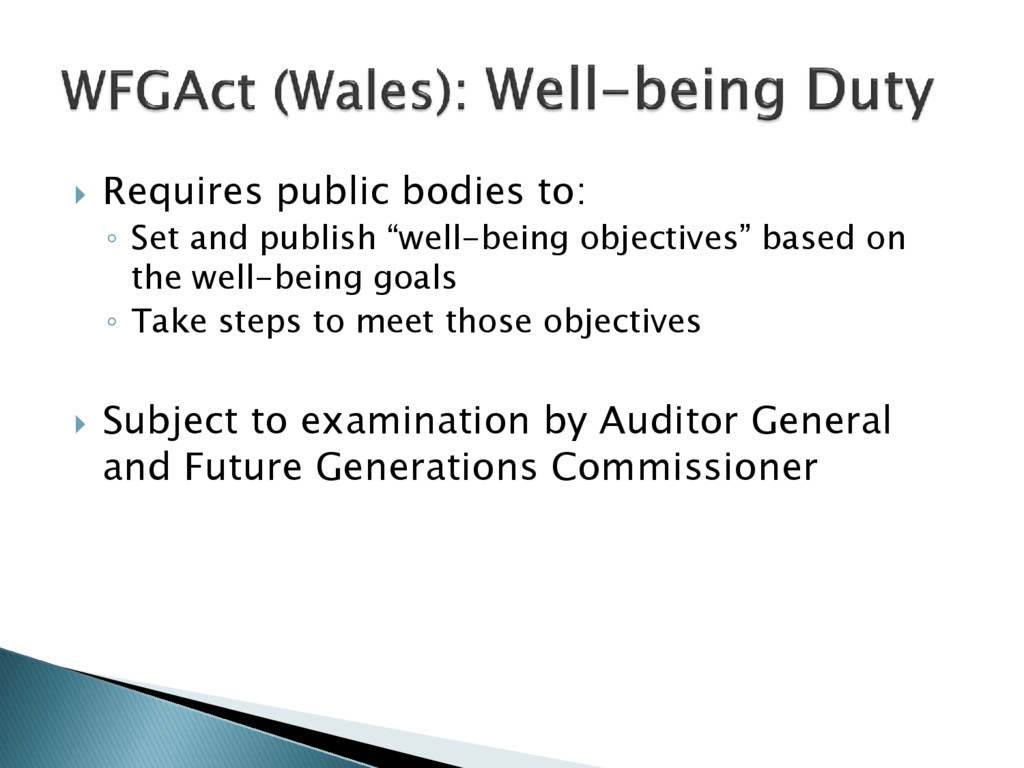
objectives” based on the well-being goals ◦ Take steps to meet those objectives Subject to examination by Auditor General and Future Generations Commissioner
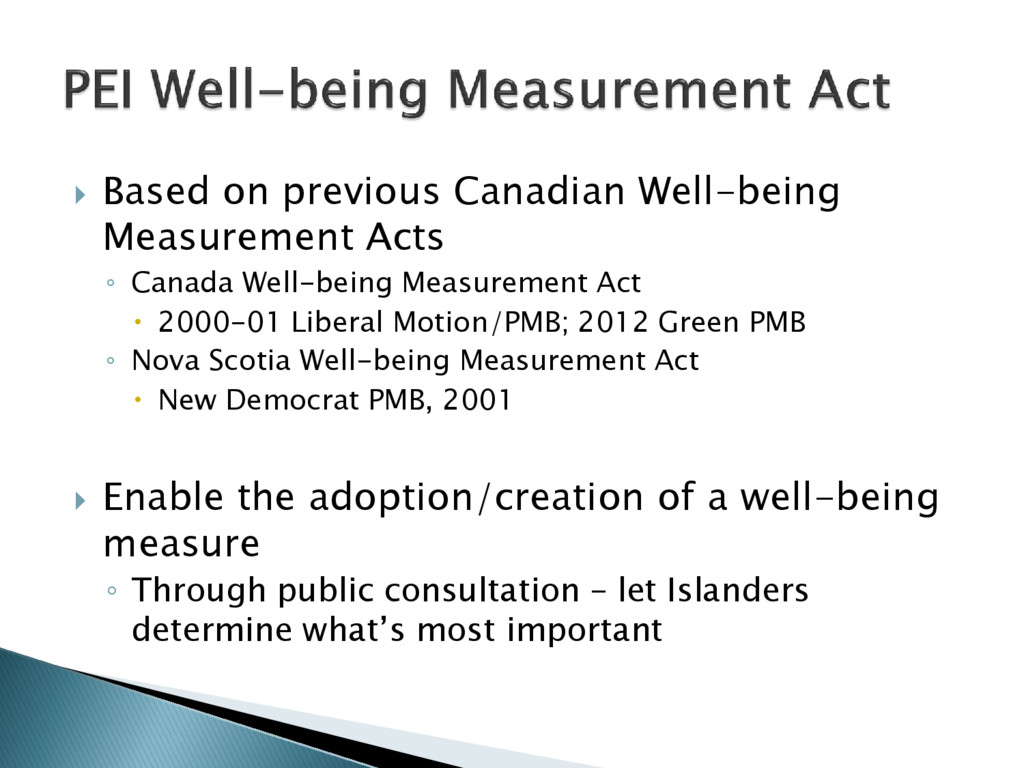
Well-being Measurement Act 2000-01 Liberal Motion/PMB; 2012 Green PMB ◦ Nova Scotia Well-being Measurement Act New Democrat PMB, 2001 Enable the adoption/creation of a well-being measure ◦ Through public consultation – let Islanders determine what’s most important
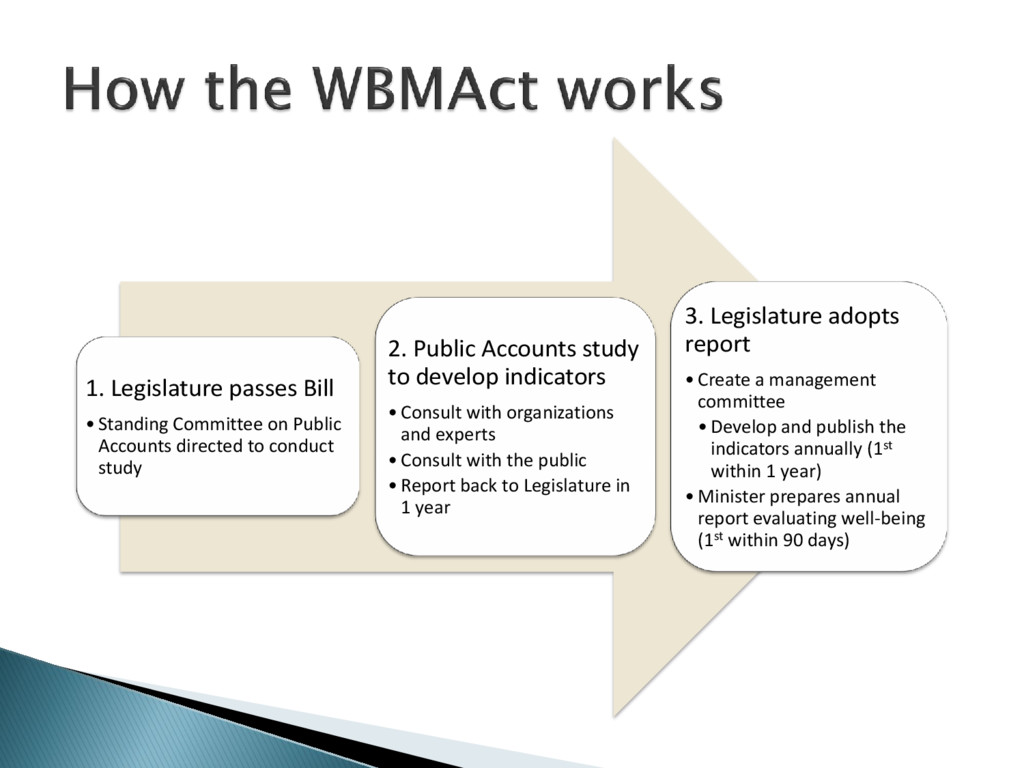
to conduct study 2. Public Accounts study to develop indicators •Consult with organizations and experts •Consult with the public •Report back to Legislature in 1 year 3. Legislature adopts report •Create a management committee •Develop and publish the indicators annually (1st within 1 year) •Minister prepares annual report evaluating well-being (1st within 90 days)
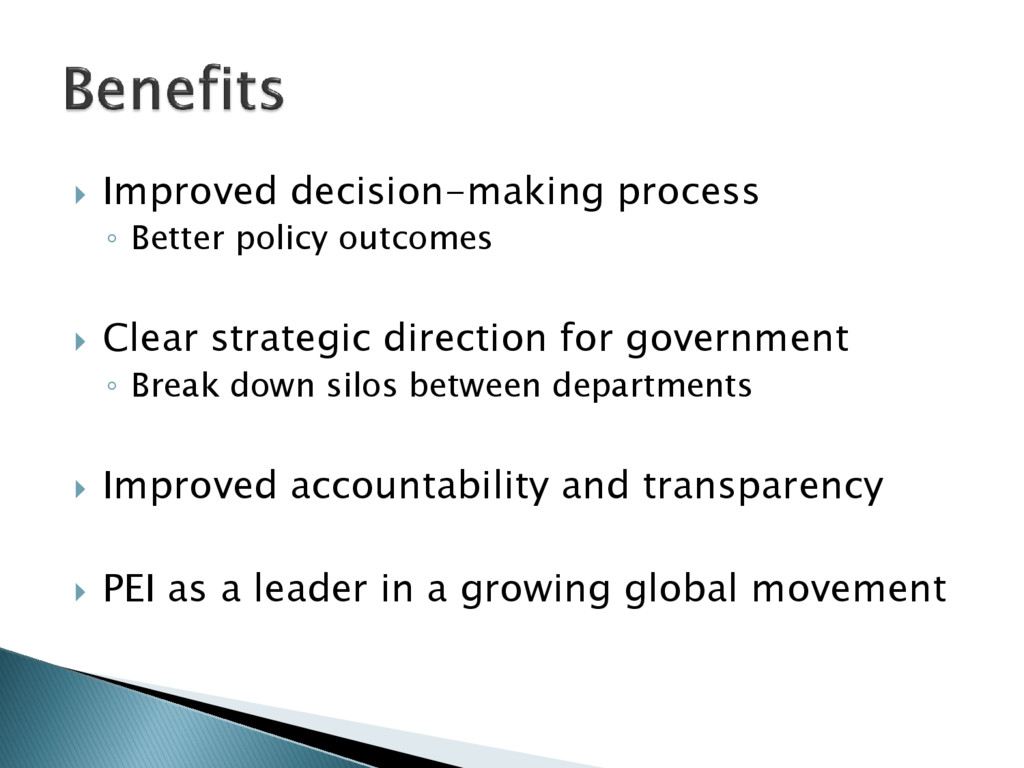
strategic direction for government ◦ Break down silos between departments Improved accountability and transparency PEI as a leader in a growing global movement
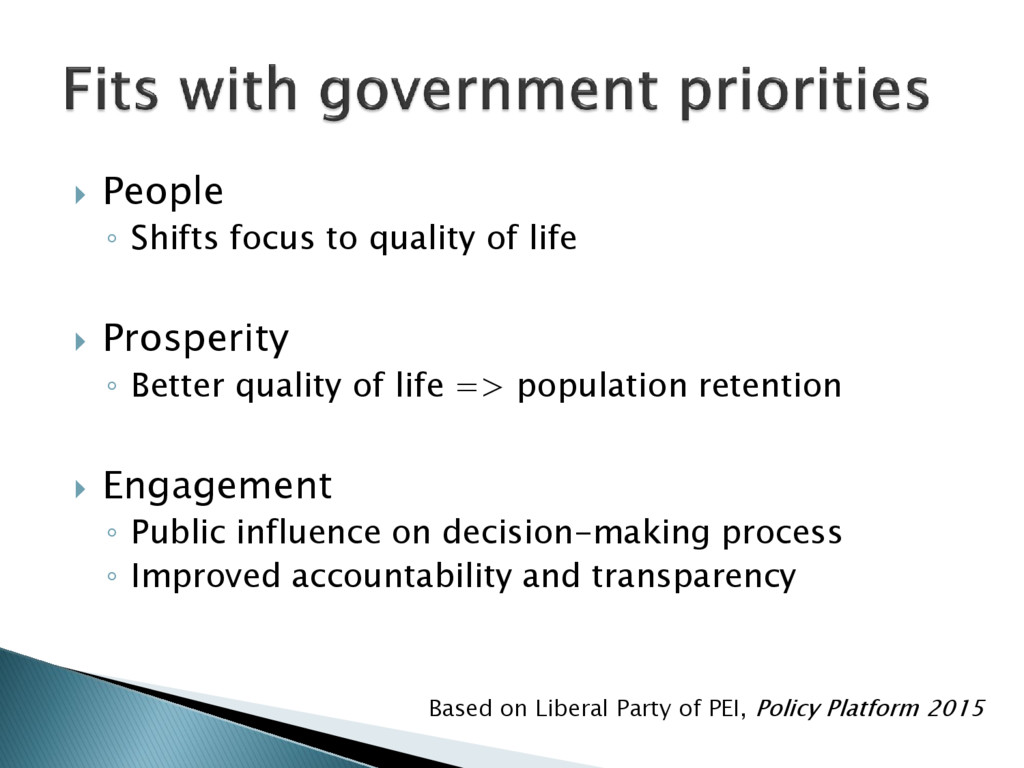
Prosperity ◦ Better quality of life => population retention Engagement ◦ Public influence on decision-making process ◦ Improved accountability and transparency Based on Liberal Party of PEI, Policy Platform 2015
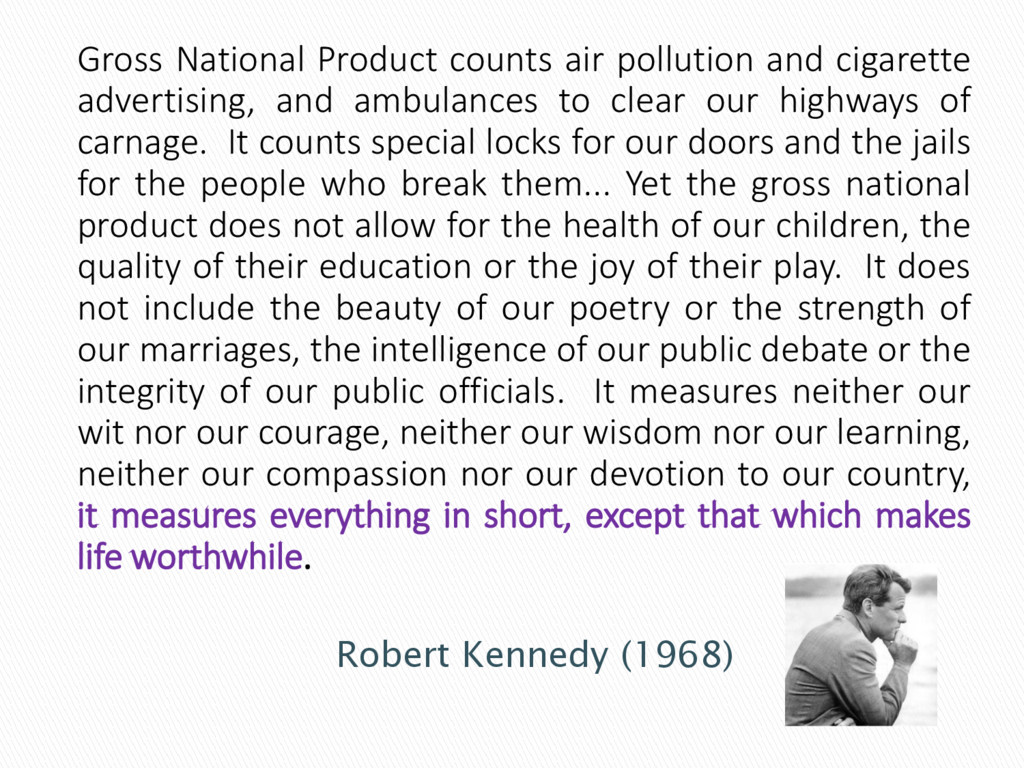
cigarette advertising, and ambulances to clear our highways of carnage. It counts special locks for our doors and the jails for the people who break them... Yet the gross national product does not allow for the health of our children, the quality of their education or the joy of their play. It does not include the beauty of our poetry or the strength of our marriages, the intelligence of our public debate or the integrity of our public officials. It measures neither our wit nor our courage, neither our wisdom nor our learning, neither our compassion nor our devotion to our country, it measures everything in short, except that which makes life worthwhile.