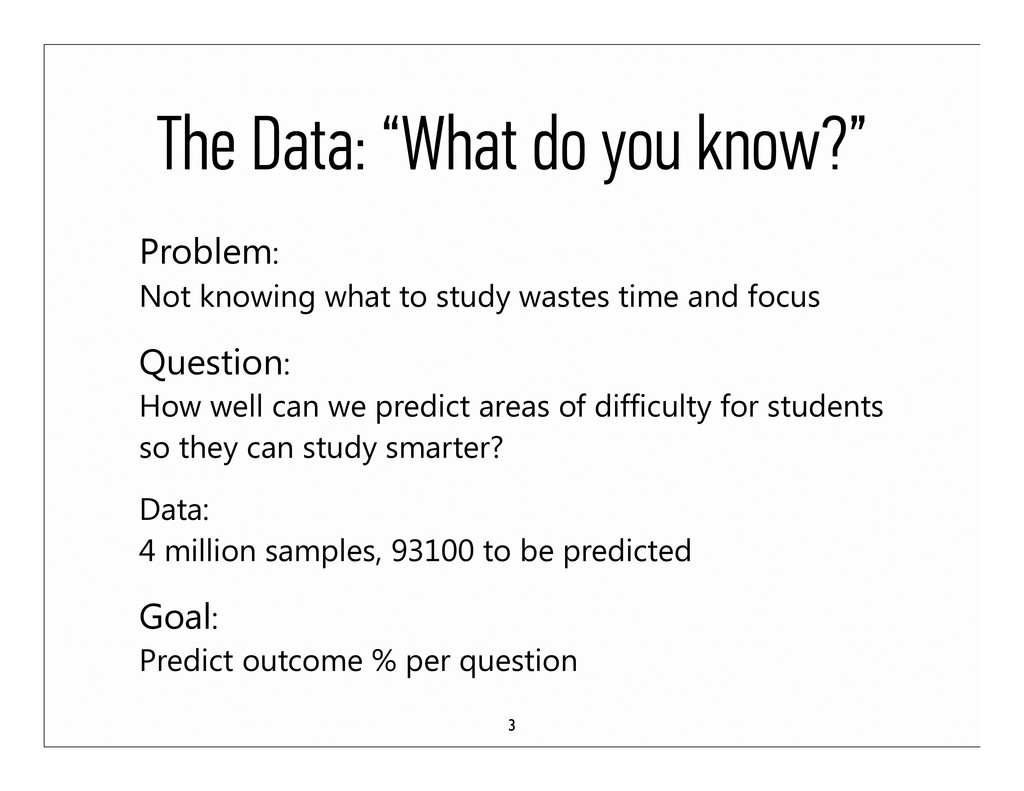
to study wastes time and focus Question: How well can we predict areas of difficulty for students so they can study smarter? Data: 4 million samples, 93100 to be predicted Goal: Predict outcome % per question 3
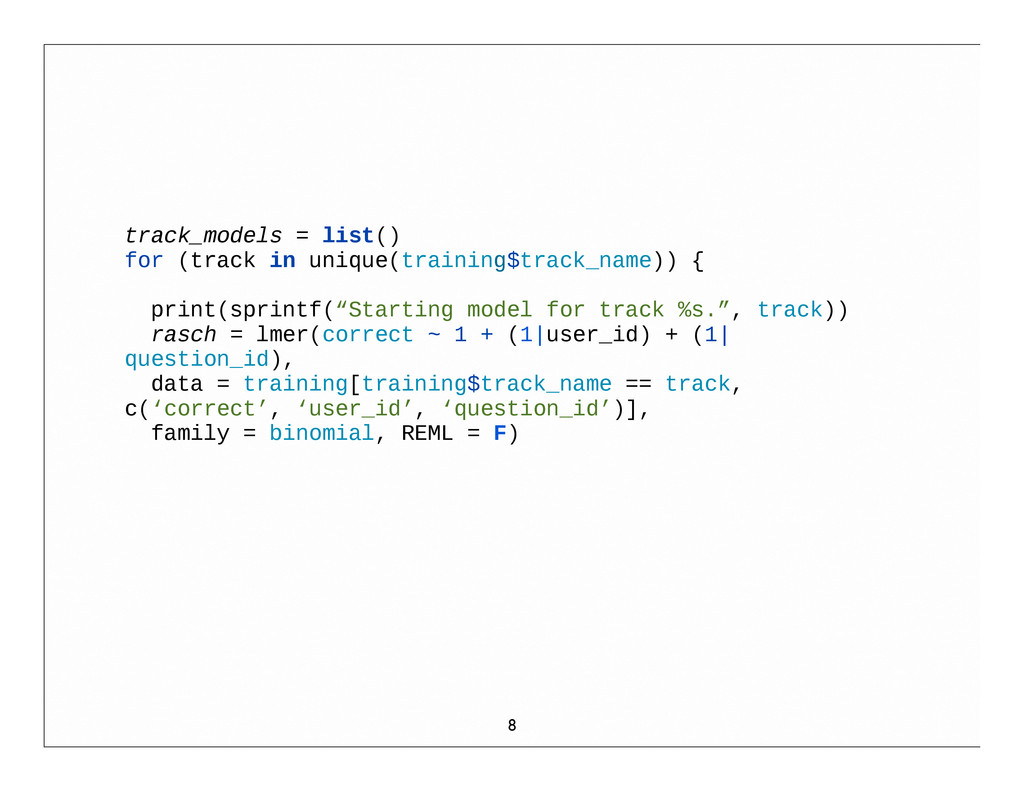
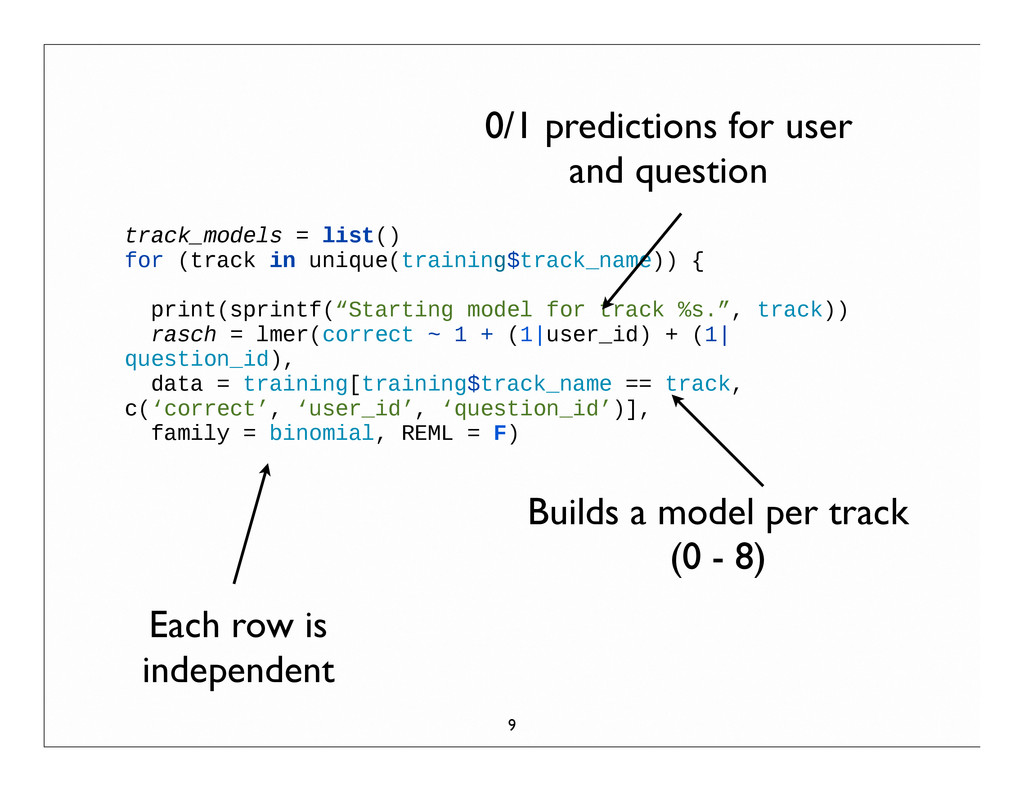
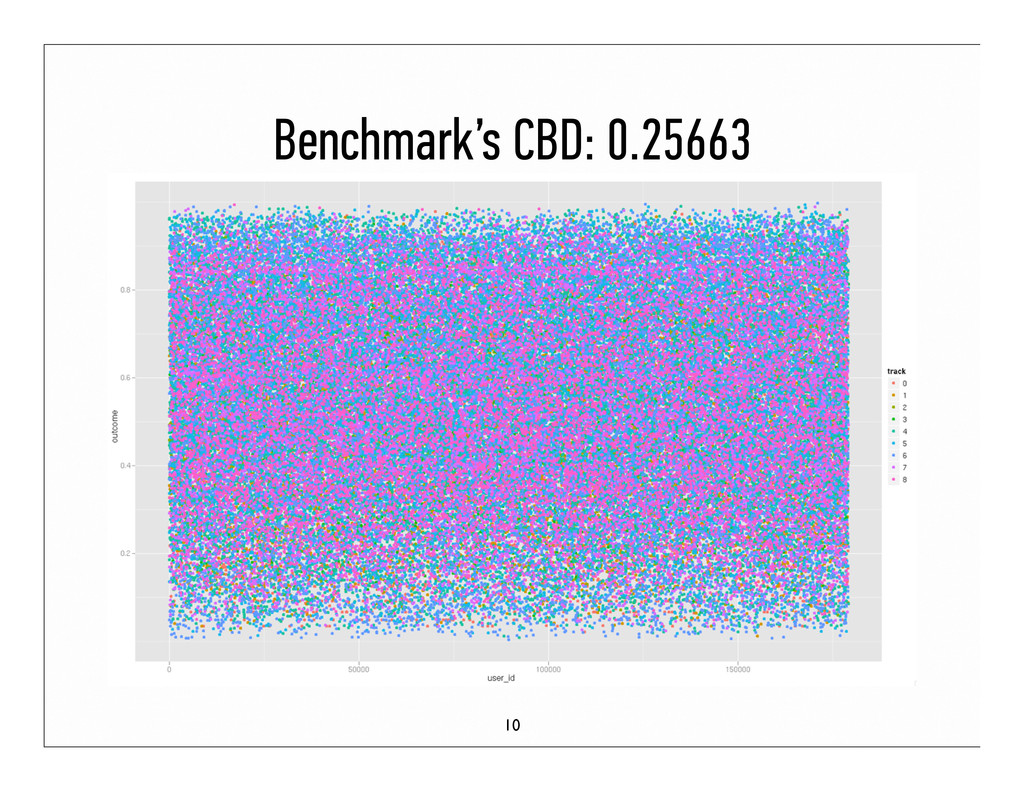
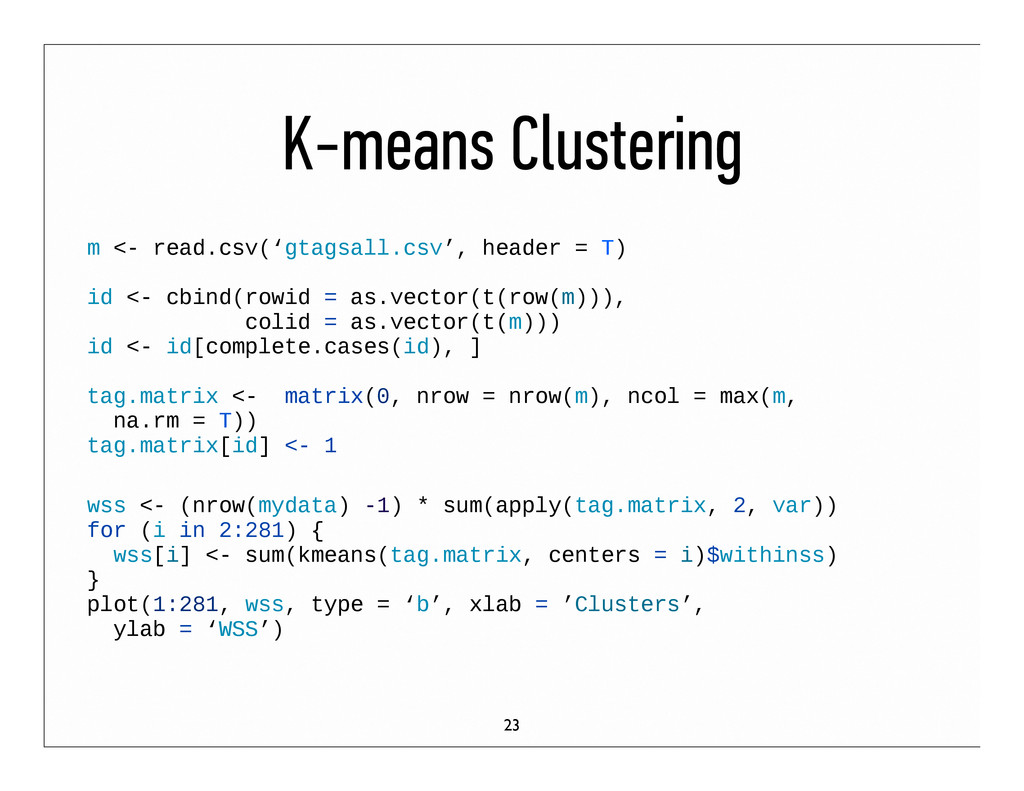
for track %s.”, track)) rasch = lmer(correct ~ 1 + (1|user_id) + (1| question_id), data = training[training$track_name == track, c(‘correct’, ‘user_id’, ‘question_id’)], family = binomial, REML = F) 0/1 predictions for user and question Builds a model per track (0 - 8) Each row is independent 9