Upgrade to Pro — share decks privately, control downloads, hide ads and more …

Vibrations ambiantes et mouvements forts dans les structures. Le rôle des réseaux dans la recherche sur la vulnérabilité sismique

Vibrations ambiantes et mouvements forts dans les structures. Le rôle des réseaux dans la recherche sur la vulnérabilité sismique

Présentation de Clotaire Michel (SED/ETH, Zürich) aux 2èmes Rencontres Scientifiques et Techniques Résif | 12-14 octobre 2015, La Grande Motte

@Résif & Epos-France

October 13, 2015
Tweet

More Decks by @Résif & Epos-France

Other Decks in Science

Transcript

  1. 13.10.2015 Vibrations ambiantes et mouvements forts dans les structures Le

    rôle des réseaux dans la 
 recherche sur la vulnérabilité sismique Clotaire MICHEL
  2. 13.10.2015 A l’origine des réseaux accélérométriques • Besoin des ingénieurs

    structure d’estimer les valeurs des forces à prendre en compte pour le dimensionnement • Premiers enregistrements accélérométriques : 1933 Long Beach (3 stations) 2 Long Beach, 1933 • Aujourd’hui : développement rapide de ces réseaux car moyen le plus efficace pour comprendre et modéliser les mouvements forts (réponse linéaire et non-linéaire) • Nécessité de comprendre le mouvement sismique à plus petite échelle → « sensor arrays » • Un séisme sans enregistrements est un séisme « pour rien » • De même pour le microzonage: « Pas de microzonage sans station pour le valider » 0s 100s
  3. 13.10.2015 Réseau accélérométrique suisse: 138 stations en 2019 3 Other&strong&mo,on&sta,ons&(37)&

    Phase&1&of&renewal&project&(30)& Phase&2:&installed&un,l&09/2015&(18)& Phase&2:&Site&defined&(8)& Phase&2:&Area&defined&(22)& Phase&2:&further&sites&(18)& Other&projects:&Borehole&sta,on&(1)& Phase&2:&Borehole&sta,ons&planned&(4)&
  4. 13.10.2015 Instrumentation de structures 4 USGS NSMP 94 « building

    arrays », 14 ponts, 69 barrages CSMIP 200 bâtiments, 66 ponts, 27 barrages BRI : 74 bâtiments Protezione Civile OSS : 127 bâtiments, 7 ponts, 1 barrage (Dolce et al., 2015) CWB TSMIP : 58 « building arrays » GeoNet BIP : 11 bâtiments, 3 ponts RAP-RESIF : 5 « building arrays » U. Chili: >5 bâtiments, 1 pont SSMNet : 5 barrages NIEP : 2 bâtiments Mexique Moldavie Instrumentation permanente au Japon dès 1957, California SMIP dès 1972 Pour enregistrer des mouvements forts, des faibles séismes et des vibrations ambiantes. Turquie : 3 bâtiments Grèce Chine Corée Macédoine
  5. 13.10.2015 Structures de génie civil et structures géologiques • Même

    problématique : connaître la réponse des structures aux mouvements forts Modèles pas suffisamment bons et/ou besoin de nombreuses données de base • Problématique supplémentaire: Structural Health Monitoring (sécurité de la structure) • Paramètres: • Rigidité (K / EI / Vs) • Amortissement (ξ / Q) • Effets géométriques 2D / 3D (flexion, cisaillement, interaction sol-structure) • Modélisation numériques des structures: tout aussi incertaines que celles du sol (matériaux complexes - BA, maçonnerie -, géométrie complexe - interaction sol-structure -, amortissement inconnu, non-linéarité mal contrôlée) 5
  6. 13.10.2015 Incertitude des modèles numériques de structures 6 6 Accélération

    maximale Déplacement maximal Prédiction à l’aveugle du Pacific Earthquake Engineering Center NEES@PEER (2010) 41 participants
  7. 13.10.2015 Bâtiments en béton armé sous comportement linéaire, le cas

    presque simple 7 Michel et al., EQE, 2010 ui ug Hôtel de ville de Grenoble (RAP-RESIF), séisme de Vallorcine ML =4.9 (08/09/05) - Michel et al. (2010) C. MICHEL ET AL. 0 2 4 6 x 10⁻⁵ 0 5 10 15 20 25 30 35 40 45 Inter storey drift – m/m Building height – m 1D L–direction 1D T–direction Model T–direction Model L–direction mparison of the maximum inter-story drift along the height of the structure during the aute-Savoie, France) ML =4.9, September 8th 2005 earthquake using the base motion as lumped-mass model extracted from ambient vibrations (black line) and the multifiber beam (gray line) in the longitudinal L (continuous) and transverse T (dashed) directions. ed on ambient vibrations, the modal response of buildings can be understood and order to predict building behaviour under weak motion. The study is focused on City Hall building that has the advantage of being permanently monitored. The dings, supplemented with full-scale ambient vibration measurements, have enabled erstanding of the dynamic behaviour of the structure, for small range of vibra- roof acceleration up to 0.01 g). This behaviour is largely dominated by the first e in each direction, including nevertheless slight torsion components. During recorded
  8. 13.10.2015 Barrages en béton armé sous comportement linéaire, ça se

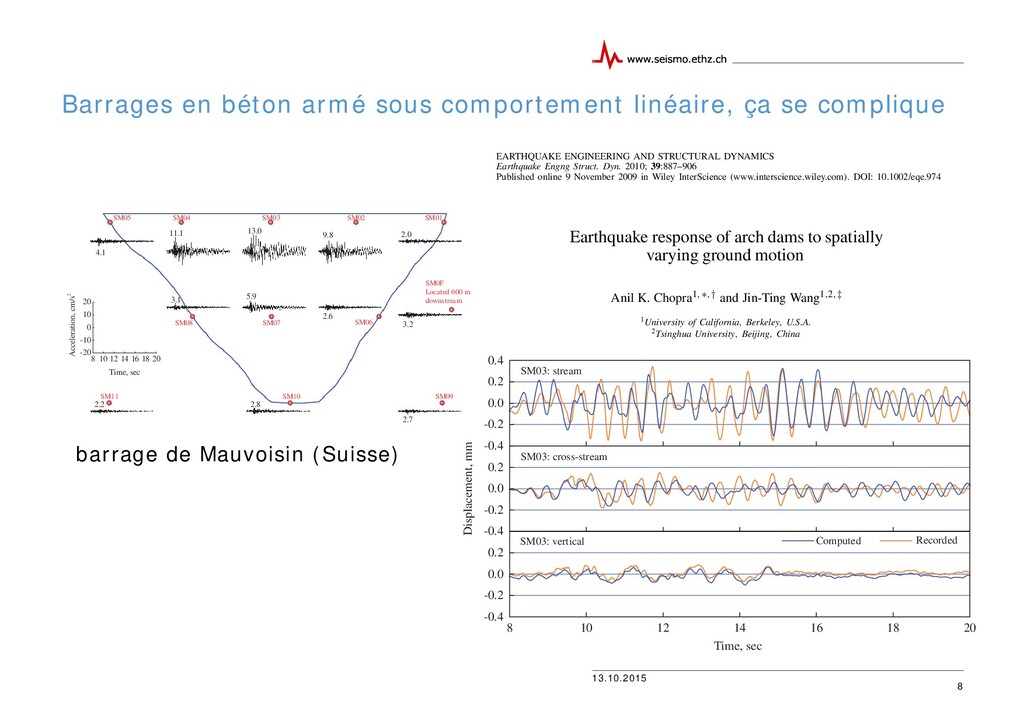
    complique 8 EARTHQUAKE RESPONSE OF ARCH DAMS 889 2.0 9.8 13.0 11.1 4.1 2.6 5.9 3.1 2.7 2.8 2.2 3.2 8 10 12 14 16 18 20 -20 -10 0 10 20 Time, sec Acceleration, cm/s2 SM05 SM08 SM04 SM03 SM02 SM01 SM07 SM06 SM11 SM10 SM09 SM0F Located 600 m downstream Figure 2. Recorded motions in stream direction; accelerations are in cm/s2; peak values are noted. the crest; accelerographs SM06–SM08 are located at mid-height; and accelerographs SM09–SM11 are located at the base elevation. Installed in tunnels, accelerographs SM09 and SM11 are located essentially vertically below SM01 and SM05, respectively; SM10 is located at the base of the dam. Accelerographs SM01, SM06, SM08, and SM05 are located at the dam–foundation rock interface; SM01 and SM06 are located on the left side of the canyon (viewed from upstream); and SM05 and SM08 on the right side of the canyon. An accelerograph SM0F is located in the free field 600 m downstream of the dam at El. 1840, i.e. 114 m above the dam base on the left side of the canyon. Motions of Mauvoisin Dam during the Valpelline earthquake of 31 March 1996 of magnitude 4.6, centered 13 km away from the dam, were recorded by the accelerograph array. At the time of the earthquake, the water level was at El. 1864, i.e. 112 m below the crest of the dam. The stream components of motions recorded at the accelerograph locations are shown in Figure 2; for brevity, similar figures for the cross-stream and vertical components are not included, but are available in Reference [7]. Although the motions are very weak, these records provide a useful set of data about the spatial variations of ground motions around the canyon along the dam–foundation rock interface, thus providing an opportunity to investigate the influence of spatial variations in ground motion on response of the dam. System analyzed Figure 3 presents a finite element model of the dam that includes 145 8-node thick shell elements 892 A. K. CHOPRA AND J.-T. WANG Displacement, mm 8 Computed Recorded SM03: vertical SM03: cross-stream -0.4 -0.2 0.0 0.2 -0.4 -0.2 0.0 0.2 -0.4 -0.2 0.0 0.2 0.4 SM03: stream Time, sec 10 12 14 16 18 20 Figure 4. Comparison of recorded and computed displacements—stream, cross-stream, and vertical components—at crest center (SM03); computed responses are for node 54 (near SM03). EARTHQUAKE ENGINEERING AND STRUCTURAL DYNAMICS Earthquake Engng Struct. Dyn. 2010; 39:887–906 Published online 9 November 2009 in Wiley InterScience (www.interscience.wiley.com). DOI: 10.1002/eqe.974 Earthquake response of arch dams to spatially varying ground motion Anil K. Chopra1,∗,† and Jin-Ting Wang1,2,‡ 1University of California, Berkeley, U.S.A. 2Tsinghua University, Beijing, China SUMMARY The response of two arch dams to spatially varying ground motions recorded during earthquakes is computed by a recently developed linear analysis procedure, which includes dam–water–foundation rock interaction effects and recognizes the semi-unbounded extent of the rock and impounded water domains. By comparing the computed and recorded responses, several issues that arise in analysis of arch dams are investigated. It is also demonstrated that spatial variations in ground motion, typically ignored in engineering practice, can have profound influence on the earthquake-induced stresses in the dam. This influence obviously depends on the degree to which ground motion varies spatially along the dam–rock interface. Thus, for the same dam, this influence could differ from one earthquake to the next, depending on the epicenter location and the focal depth of the earthquake relative to the dam site. Copyright 2009 John Wiley & Sons, Ltd. Received 20 April 2009; Revised 31 August 2009; Accepted 1 September 2009 KEY WORDS: arch dams; earthquakes; spatial variations; Mauvoisin Dam; Pacoima Dam INTRODUCTION Ground motions recorded at arch dams exhibit spatial variation (or non-uniformity) along the dam–foundation rock interface. Such data include records obtained at two dams: (1) Pacoima Dam (California, U.S.A.) during the earthquake on 13 January 2001 of magnitude 4.3, and the Northridge earthquake on 17 January 1994 of magnitude 6.9 [1, 2]; and (2) Mauvoisin Dam (Switzerland) during the Valpelline earthquake on 31 March 1996 of magnitude 4.6 [3]. Rarely are these spatial variations in ground motion considered in earthquake analysis of arch dams, and when they are included, dam–water interaction is usually oversimplified. Water barrage de Mauvoisin (Suisse)
  9. 13.10.2015 « Interférométrie » sismique : la sismologie dans les

    bâtiments • L’interférométrie sismique (Snieder et Safak, 2006) dans les structures ouvre de nouvelles perspectives • Propagation des ondes dans les structures, atténuation • Sous vibrations ambiantes et sous séismes • Vision complémentaire de l’analyse modale classique pour l’étude de l’interaction sol-structure, des non-linéarités etc. 9 Tour Ophite (RAP-RESIF), Lourdes
  10. 13.10.2015 Evaluer le comportement de structures • Vérifier que des

    structures spécialement dimensionnées ou renforcées se comportent comme prévu • ex: Centre de découverte des Sciences de la Terre (RAP-RESIF - Guéguen, 2012) 10 recordings at the CDST building (CGCP: above the bearings—CGLR: free-field) for d motion recorded (see Table 1) and accelerometric response spectra (5% of damping). ML 4.95 earthquake—Lower row: 2007/11/29 Mw 7.4 earthquake—Left: longitudi-
  11. 13.10.2015 Non-linéarité dans les structures - séismes modérés • Même

    sous-faible sollicitations, variation du comportement dynamique 11 Analyse modale Hôtel de ville de Grenoble (Michel et al., 2010) Interférométrie sismique Tour Ophite
  12. 13.10.2015 Non-linéarité dans les structures - séismes forts • Observation

    de forts séismes nécessaire pour comprendre l’endommagement • La seule alternative : les essais sur tables vibrantes / pseudo-dynamiques, avec aussi leur désavantages (coûts, lois d’échelle, construction, fondation) 12 Exemple: Millikan Library, séisme de San Fernando (1971) (Dommages légers) Michel et Guéguen (2010)
  13. 13.10.2015 Suivi des structures (SHM) • Baisse des coûts et

    développement rapide (privé et public - ex. Italie) • Deux types d’études: • Evolutions long-terme • Intégrité après un événement 13 detecting the building frequencies (estimated using empirical relationships close to 1 Hz) and to use the memory storage of the temporary experiment. The acquisition systems in the two buildings were completely independent. Examples of fast Fourier transforms are shown in Figure 2a (right). The behavior of the two buildings is quite similar, their fundamental mode being at 0.67 Hz (T) and 0.89 Hz (L), and 0.65 Hz (T) and 0.84 Hz (L) for the BD and MB buildings, respectively. Overtones of bending modes close to 3 and 5 Hz were also observed, as well as a torsion mode close to 1 Hz. All of these values were also observed by Michel et al. (2011) using extensive modal analysis, with multichannels recordings. Herein, only the fundamental daily variations are clear, and longer period of variations are also observed, such as during the second week of August. The same trend was previously observed by Clinton et al. (2006), where frequency increases with temperature. The sci- entific reason for frequency variations is not yet completely understood, but it may result from the expansion of concrete or cladding in relation to sun exposure. For example, Figure 3b shows the differences between behavior in the NS (L) and EW (T) directions. Frequency variations are less correlated between T and L for either building (correlation coefficient CBD ˆ 0:75 and CMB ˆ 0:65) and more corre- lated between the buildings when the same direction is con- sidered (CT ˆ 0:89 and CL ˆ 0:85). This can be explained 0.99 1 1.01 Freq / Mean (Freq) 0.99 1 1.01 BD MB 0 10 20 30 0 10 20 30 Temperature (°C) 0 20 40 Rain (mm) 0 50 100 Wind (km/h) BD MB wind Rain 0.99 0.995 1 1.005 1.01 0.99 0.995 1 1.005 1.01 Longitudinal Transverse 0.99 0.995 1 1.005 1.01 0.99 0.995 1 1.005 1.01 Belledonne Mont−Blanc MB BD 20−Jul 25−Jul 30−Jul 05−Aug 10−Aug 15−Aug (a) (b) L−direction T−direction L T Figure 3 (a) Frequency variations (normalized) of the Mont-Blanc (MB) and Belledonne (BD) buildings in the longitudinal L (upper row) and transverse T (middle row) directions for one month obtained using the Random Decrement Technique. Temperature variations, red line. The lower row corresponds to the rain and wind variations provided by a meteorological station, 20 km from the buildings. (b) Correlation between L and T directions of each building (left) and between BD and MB buildings for each component. Mikael et al., 2013 Dunand et al., 2004 (Algeria) Omori, 1922 (Japan) Régnier et al., 2013 (France) Vidal et al., 2013 (Spain) Mucciarelli et al., 2004 (Italy) Clinton et al., 2006 (USA) 0 1 2 3 4 5 0.2 0.4 0.6 0.8 1 Damage index [d] Lower-bound observations Goulet et al., 2015 • Analyses temps-réel, voire Early Warning
  14. • Bâti typique des centres villes européens, peu de données,

    peu de modèles (complexité matériaux et géométrie), vulnérabilité forte (ex: Aquila 2009) • Idem pour les monuments historiques • Dolce et al. (2015): plus de 40 bâtiments en maçonnerie instrumentés en Italie dont des monuments historiques 0 5 10 15 20 25 30 0 5 10 15 0 2 4 6 8 10 12 X Y Z 13.10.2015 Un effort nécessaire: instrumenter le bâti en maçonnerie 14 structures had been struck by a previou 5.4), and the relevant OSS recordings w for a scientific study (Ceravolo et al. 201 authors of the present paper after the 201 (Fig. 11). A good agreement was foun measured maximum inter-storey drift, an church it is also interesting to discuss structed from the available accelerometr ment components, reasonable assumptio combination of the available ones. Fro values for non-ductile moment resisting frames, while the extensive damage level is more compatible with infilled frames. In any case, together with the damage level, maximum drift values are explicitly reported for each building. A calibration of the drift limits for each building, using the available FEM nonlinear models, will be performed in the near future. Fig. 11 Two buildings inspected after the 2013, June 21st earthquake in Garfagnana-Lunigiana (from top to bottom and from left to right): Giuncugnano Town Hall main fac ¸ade, typical maximum damage to masonry walls, damage to a clay tile of the roof, Fivizzano Church main fac ¸ade, damage to an external stone pillar, typical damage to vaults 123 Dolce et al. (2015) ND Valère (Sion, Suisse) Michel (2009) Grenoble
  15. 13.10.2015 Conclusions • Les réseaux accélérométriques ont l’infrastructure technique pour

    l’instrumentation de structures • Données nécessaire pour mieux comprendre la réponse sous séisme • Nécessité pour les sismologues et les ingénieurs structures de se comprendre pour que les données des uns servent aux modèles des autres - Faire admettre le besoin de données aux ingénieurs structures • Développement de la « vraie » sismologie dans les structures (interférométrie) complémentaire des méthodes « classiques » (analyse modale) 15 Intensité Comportement Objectifs Séismes forts Non-linéaire avec endommagement Localisation/Quantification de l’endommagement; Modèles non-linéaires Séismes modérés Non-linéaire élastique Variations/amplitude; Modèles à développer Vibrations ambiantes Linéaire Variations long-terme; Modèles linéaires
  16. 13.10.2015 Estimer la « fragilité » des structures • Courbes

    de fragilité: probabilité de dommage en fonction d’un (ou plusieurs) paramètres du mouvement du sol (« nocivité », « intensity measure IM ») • Michel et al. (2012), Perrault et al. (2013): modèle utilisant les paramètres modaux obtenus sous vibrations ambiantes; Perrault et Guéguen (sous presse) 16 HAZUS, 2003
  17. 13.10.2015 Qualité ou bas-coût? • Mouvements forts, analyse de l’intégrité

    -> beaucoup de capteurs, bas coût • Vibrations ambiantes -> qualité des capteurs à privilégier • Bientôt plus besoin de se poser la question? 17 Ex: proposition d’instrumentation bas-coût pour la ville de San Francisco pour estimer l’habitabilité rapidement après un séisme (méthode bayesienne) Goulet et al., 2015