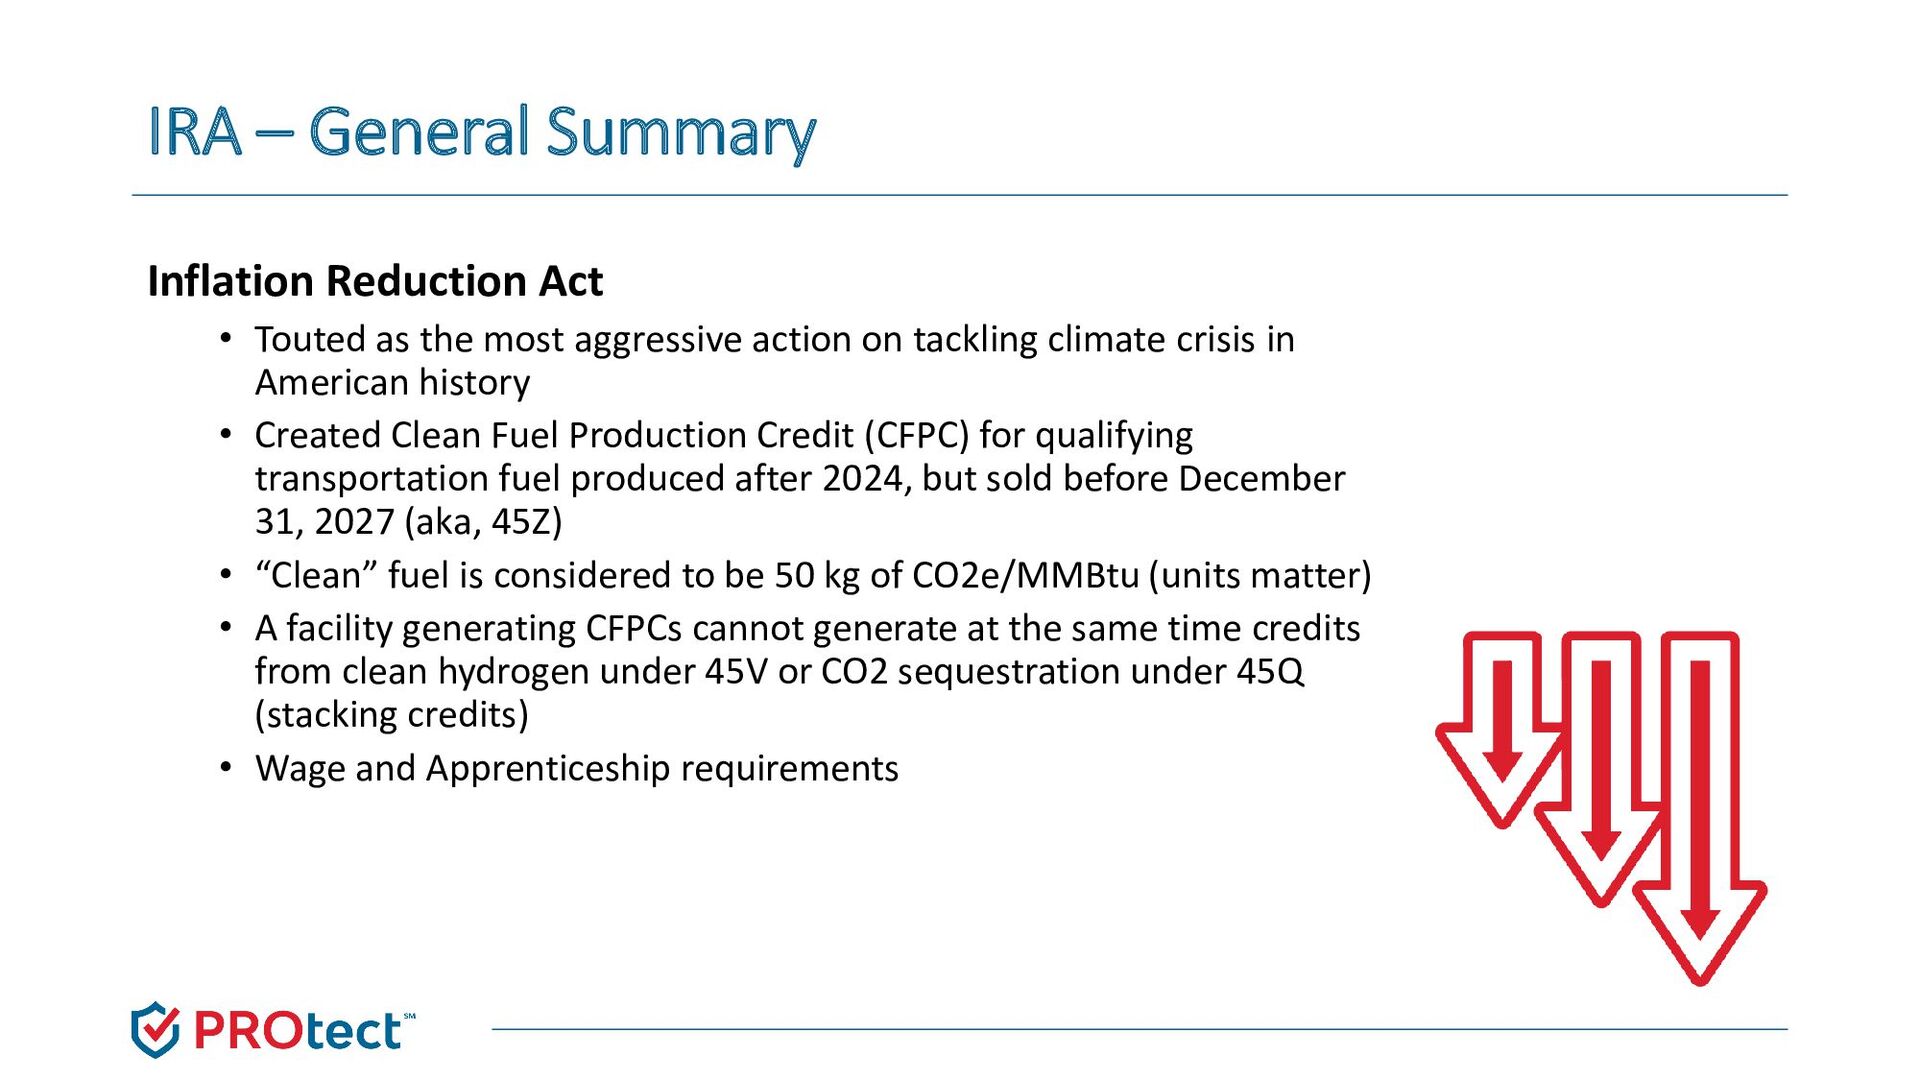
the most aggressive action on tackling climate crisis in American history • Created Clean Fuel Production Credit (CFPC) for qualifying transportation fuel produced after 2024, but sold before December 31, 2027 (aka, 45Z) • “Clean” fuel is considered to be 50 kg of CO2e/MMBtu (units matter) • A facility generating CFPCs cannot generate at the same time credits from clean hydrogen under 45V or CO2 sequestration under 45Q (stacking credits) • Wage and Apprenticeship requirements
• Typical data needs include: Feedstock throughput, Feedstock sourcing, Production/process information, Energy (electricity, natural gas), Coproduct considerations, Transportation of final fuel product • 26 US Code §45Z indicates GREET developed by Argonne National Laboratory, “or a successor model (as determined by the Secretary)” is the model to be used to calculate lifecycle GHG emissions What We Don’t Know • Will there be a separate model developed for program compliance, like the SAF calculator • Will defaults be defined, or will there be user flexibility • ILUC changes to reflect updated science
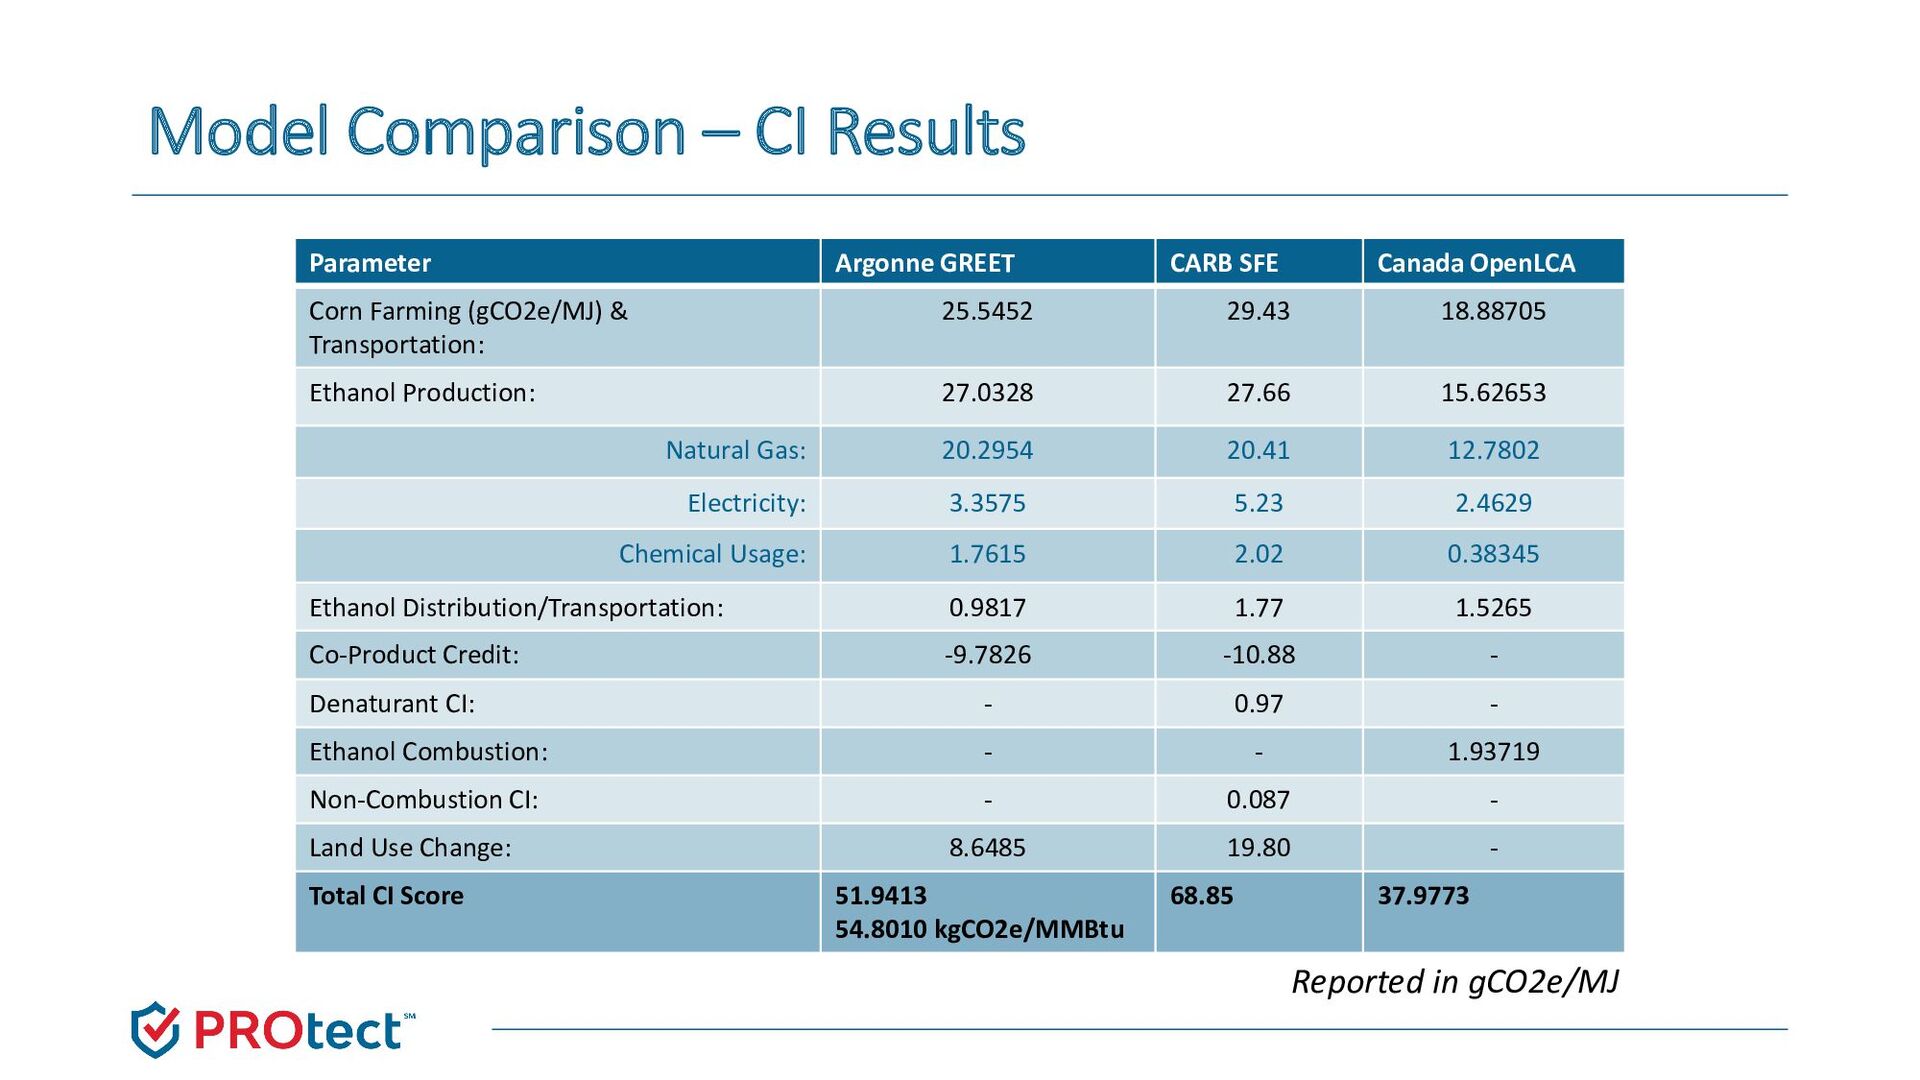
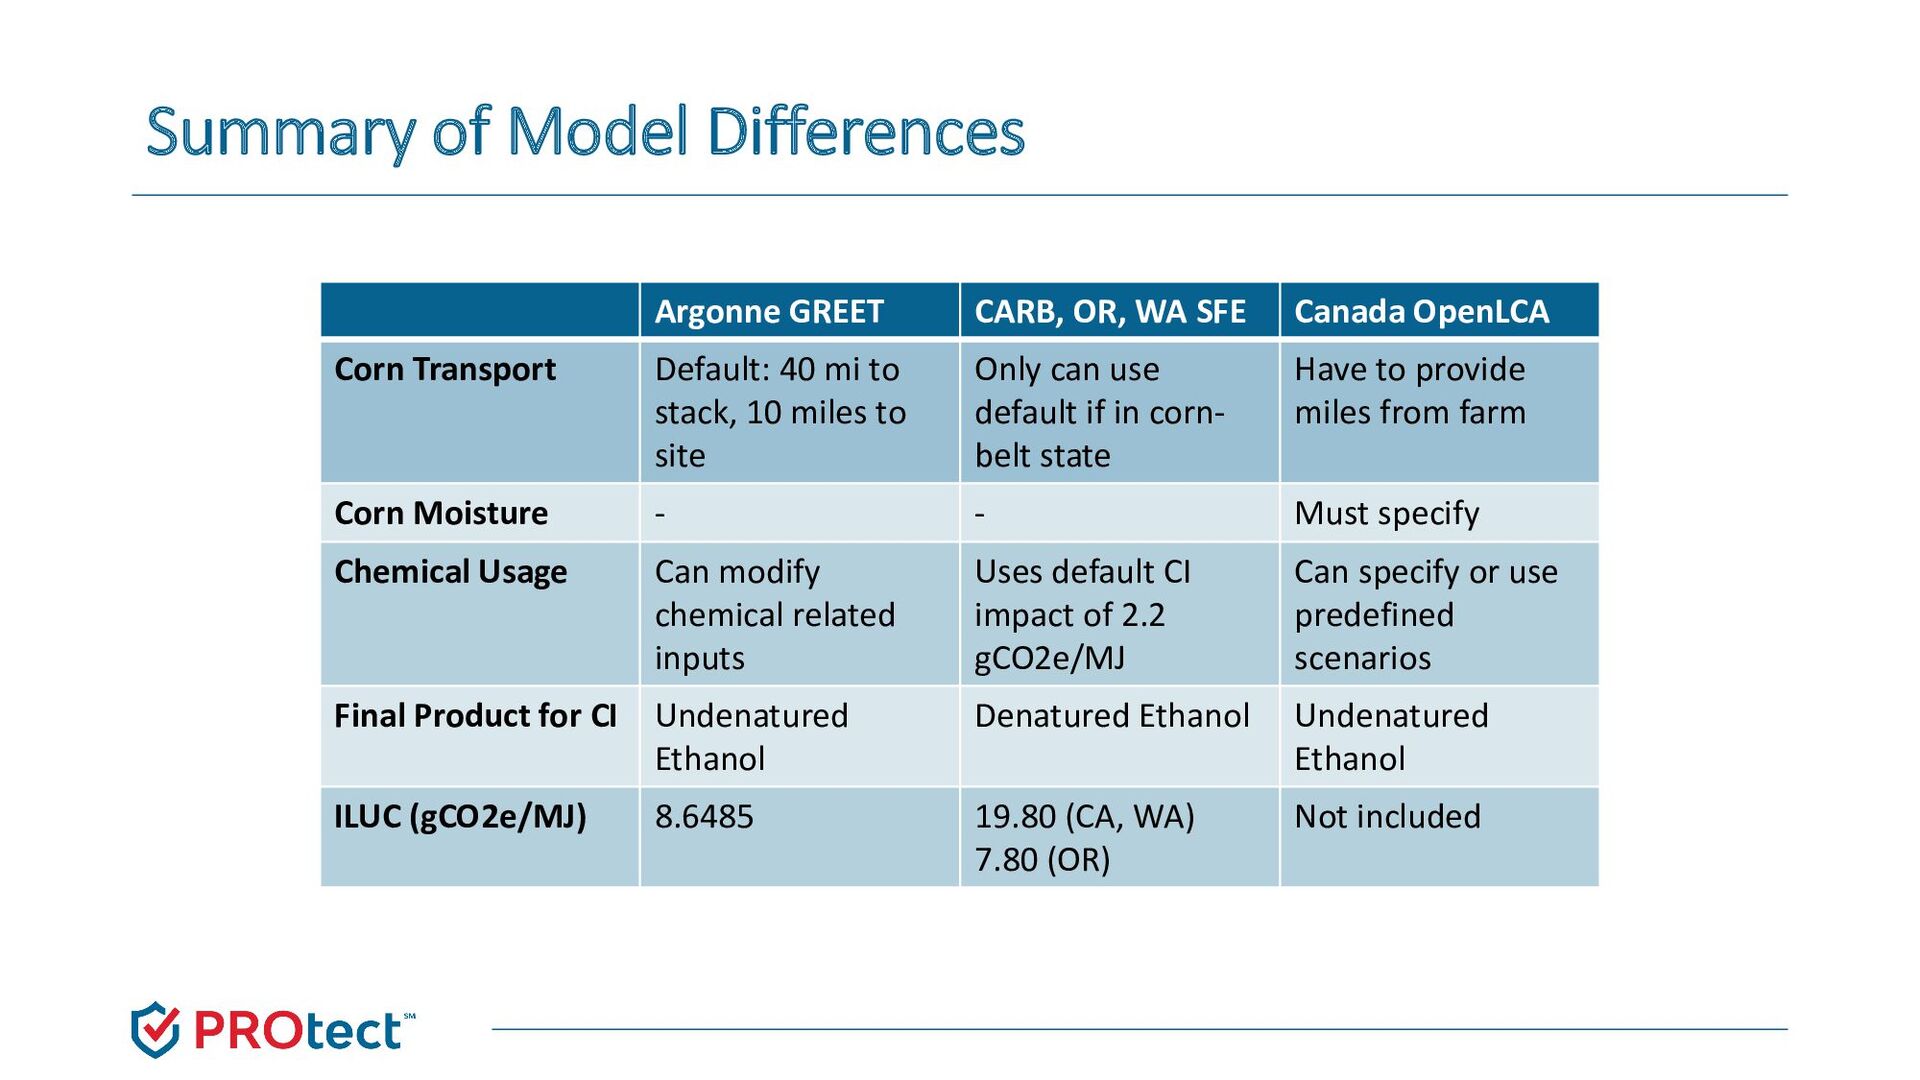
Canada OpenLCA Corn Transport Default: 40 mi to stack, 10 miles to site Only can use default if in corn- belt state Have to provide miles from farm Corn Moisture - - Must specify Chemical Usage Can modify chemical related inputs Uses default CI impact of 2.2 gCO2e/MJ Can specify or use predefined scenarios Final Product for CI Undenatured Ethanol Denatured Ethanol Undenatured Ethanol ILUC (gCO2e/MJ) 8.6485 19.80 (CA, WA) 7.80 (OR) Not included
• Argonne GREET Farming practices values currently allow user flexibility in inputs • Aside from Ethanol Production, farming practices are the 2nd largest impact to the overall CI, leaving prime for reduction targets What We Don’t Know • Will Farm Inputs be included as modifiable parameters • How farming practices will be calculated or verified • Default parameters vs limited capability to modify defined inputs • Farmer traceability and coordination • Concerns related to how feedstock is obtained, aggregated CI, having farmer participation, implementation, pathway/registration requirements
programs, verification ensures the components of a fuel pathway program are being met • Some kind of Verification, Quality Assurance, and/or Engineering Review will be required What We Don’t Know • How that verification process will look • Who will be able to conduct verification (technical/financial considerations) • Options: • Third-party, independent engineering review conducted by a Professional Engineer, • EPA’s Quality Assurance Program (QAP) • CARB’s Verification/Validation process • Annual Attestations
typical component of program compliance to define how data used to calculate a CI will be accurately measured, recorded, and maintained • All programs have required some sort of plan including EPA’s EP3 program, State LCFS, and Canada CFR What we don’t know • Will IRS require a similar plan, and how will the program components vary • One way to ensure program compliance is to develop a plan that is comprehensive enough to cover all programs
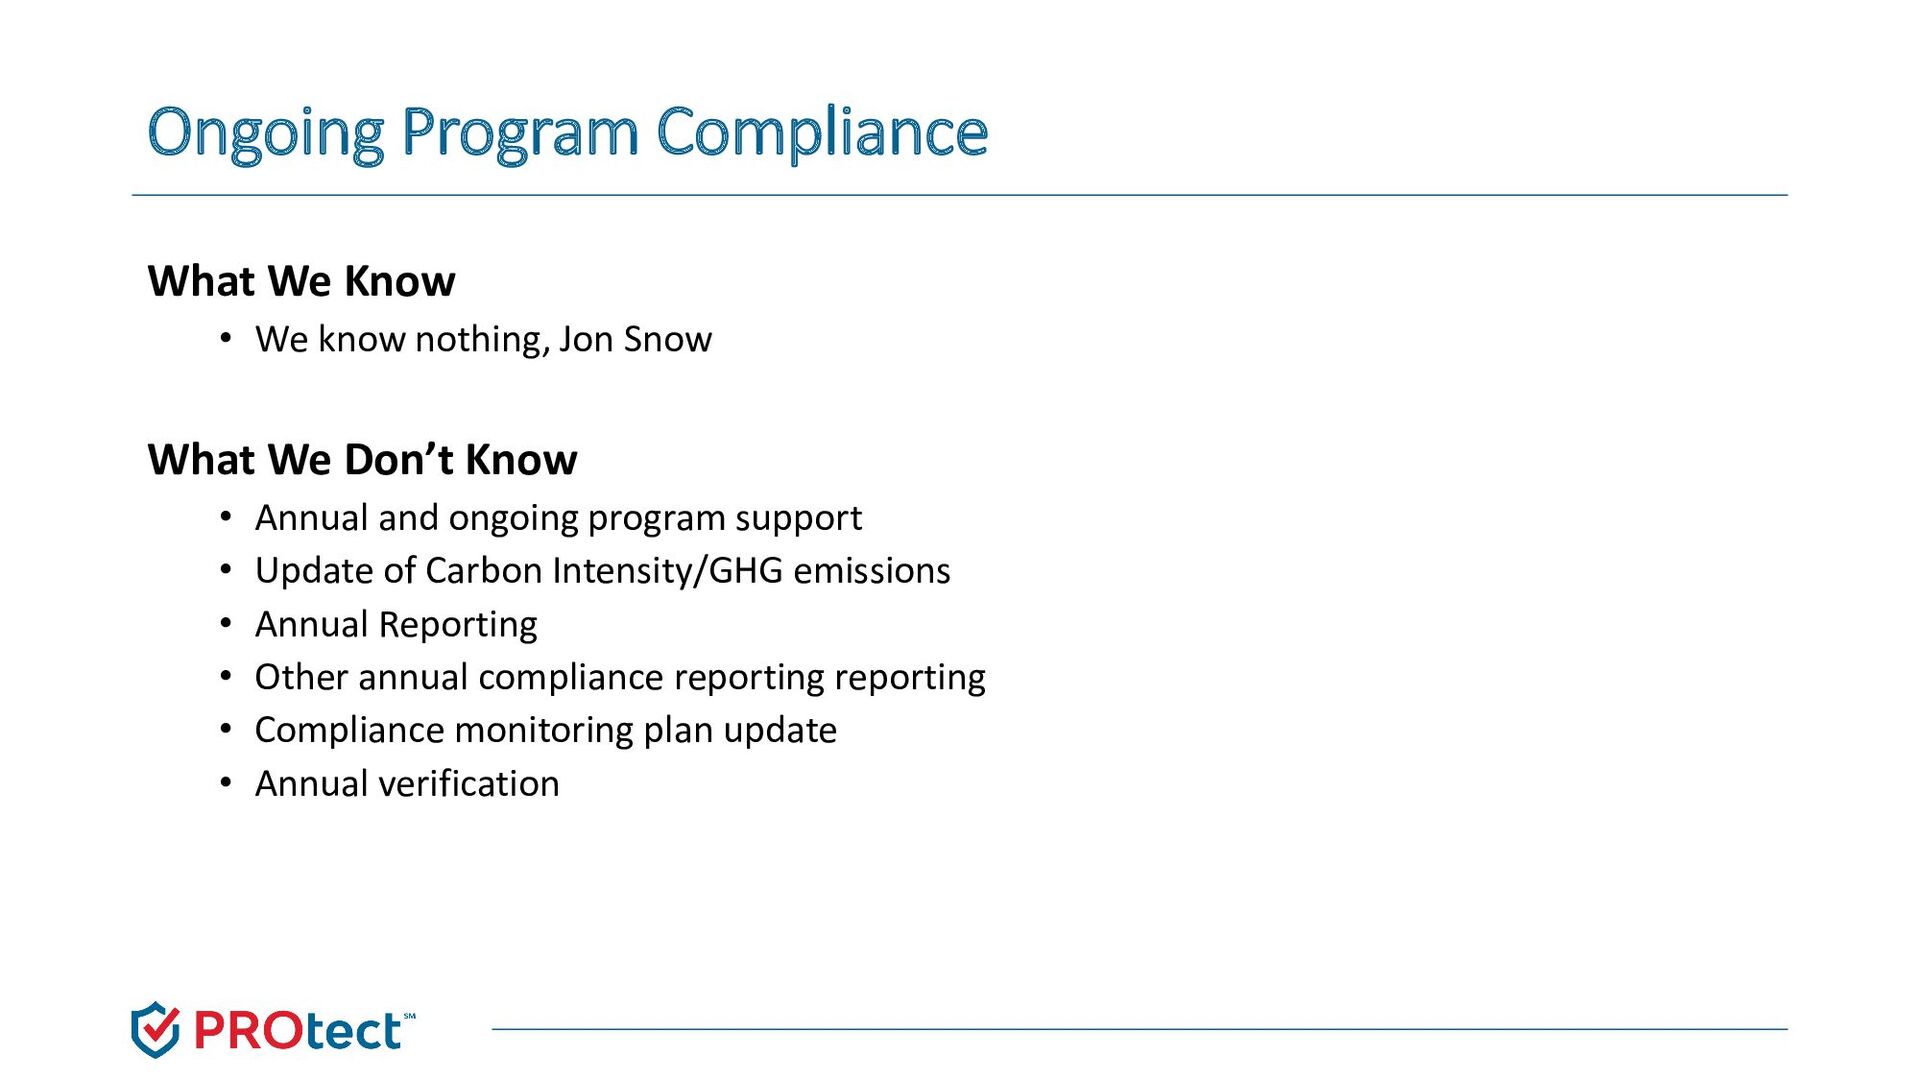
Jon Snow What We Don’t Know • Annual and ongoing program support • Update of Carbon Intensity/GHG emissions • Annual Reporting • Other annual compliance reporting reporting • Compliance monitoring plan update • Annual verification
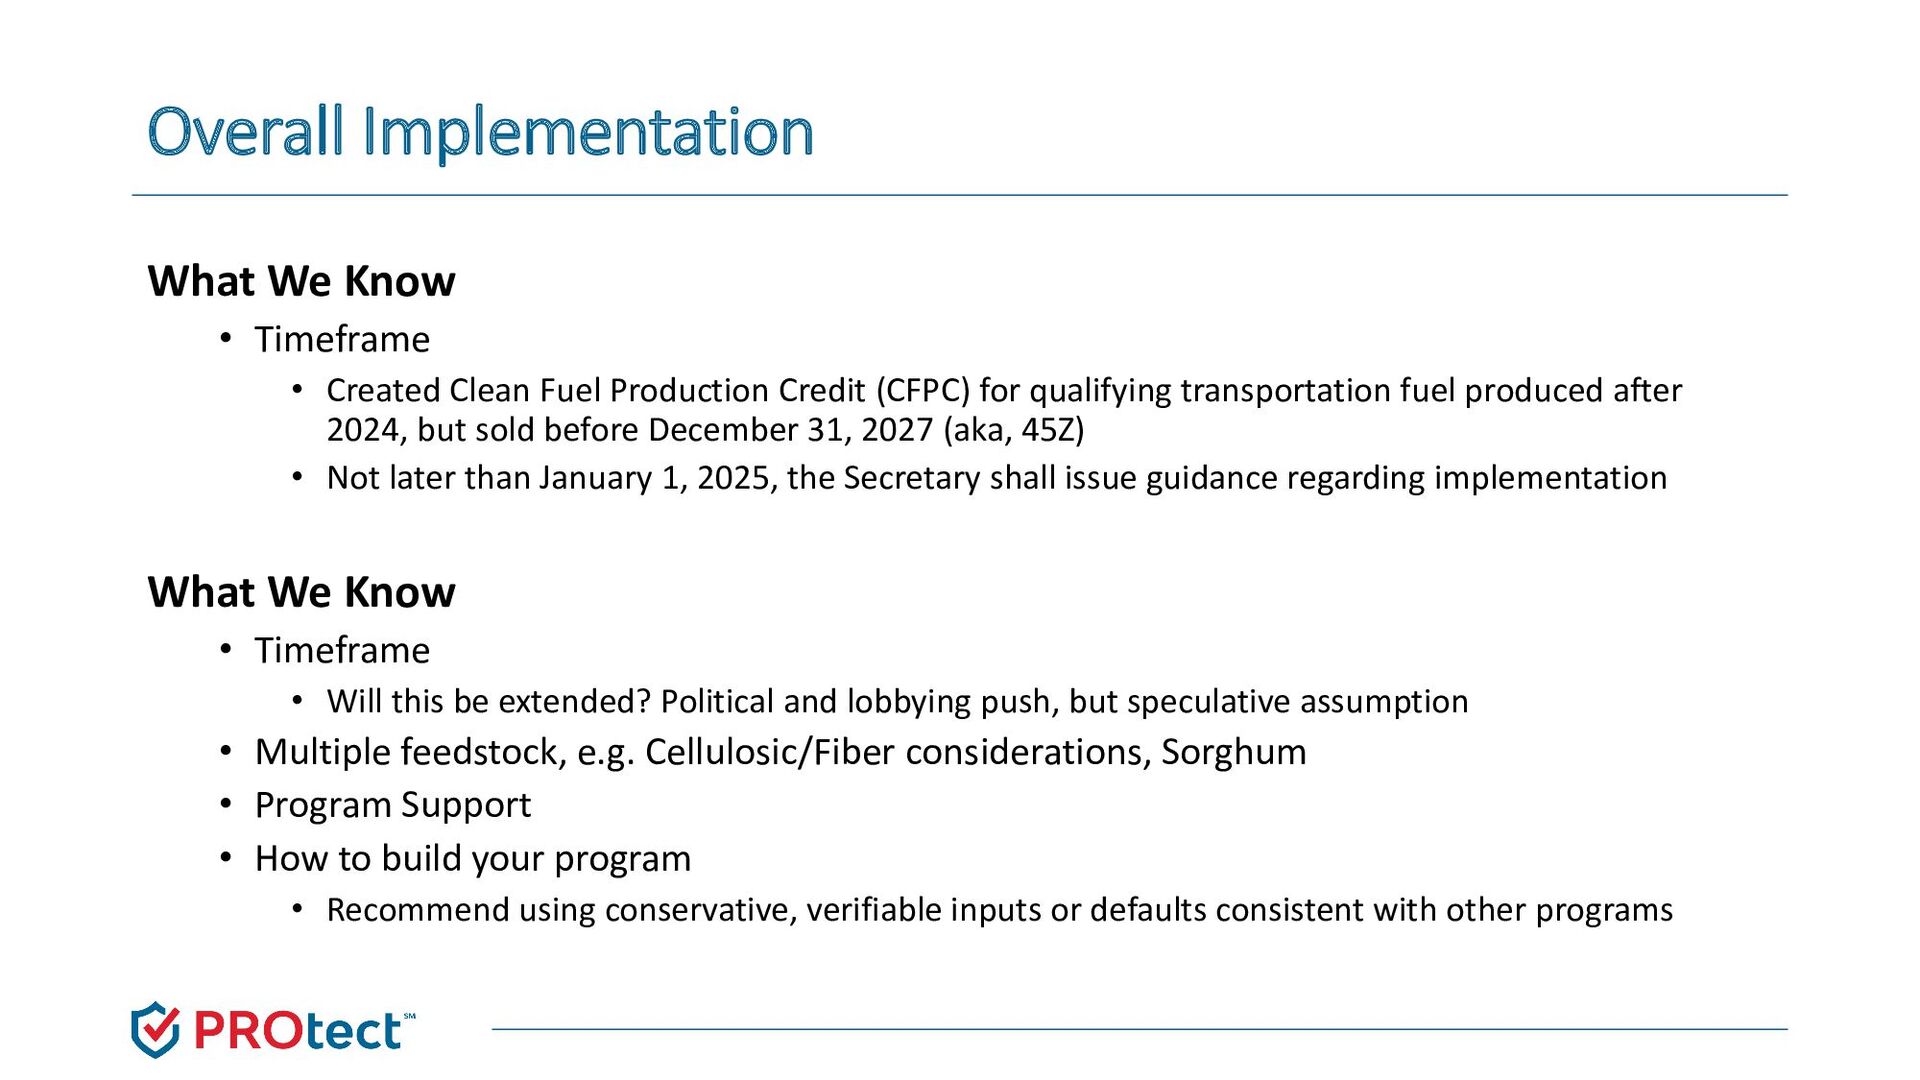
Fuel Production Credit (CFPC) for qualifying transportation fuel produced after 2024, but sold before December 31, 2027 (aka, 45Z) • Not later than January 1, 2025, the Secretary shall issue guidance regarding implementation What We Know • Timeframe • Will this be extended? Political and lobbying push, but speculative assumption • Multiple feedstock, e.g. Cellulosic/Fiber considerations, Sorghum • Program Support • How to build your program • Recommend using conservative, verifiable inputs or defaults consistent with other programs
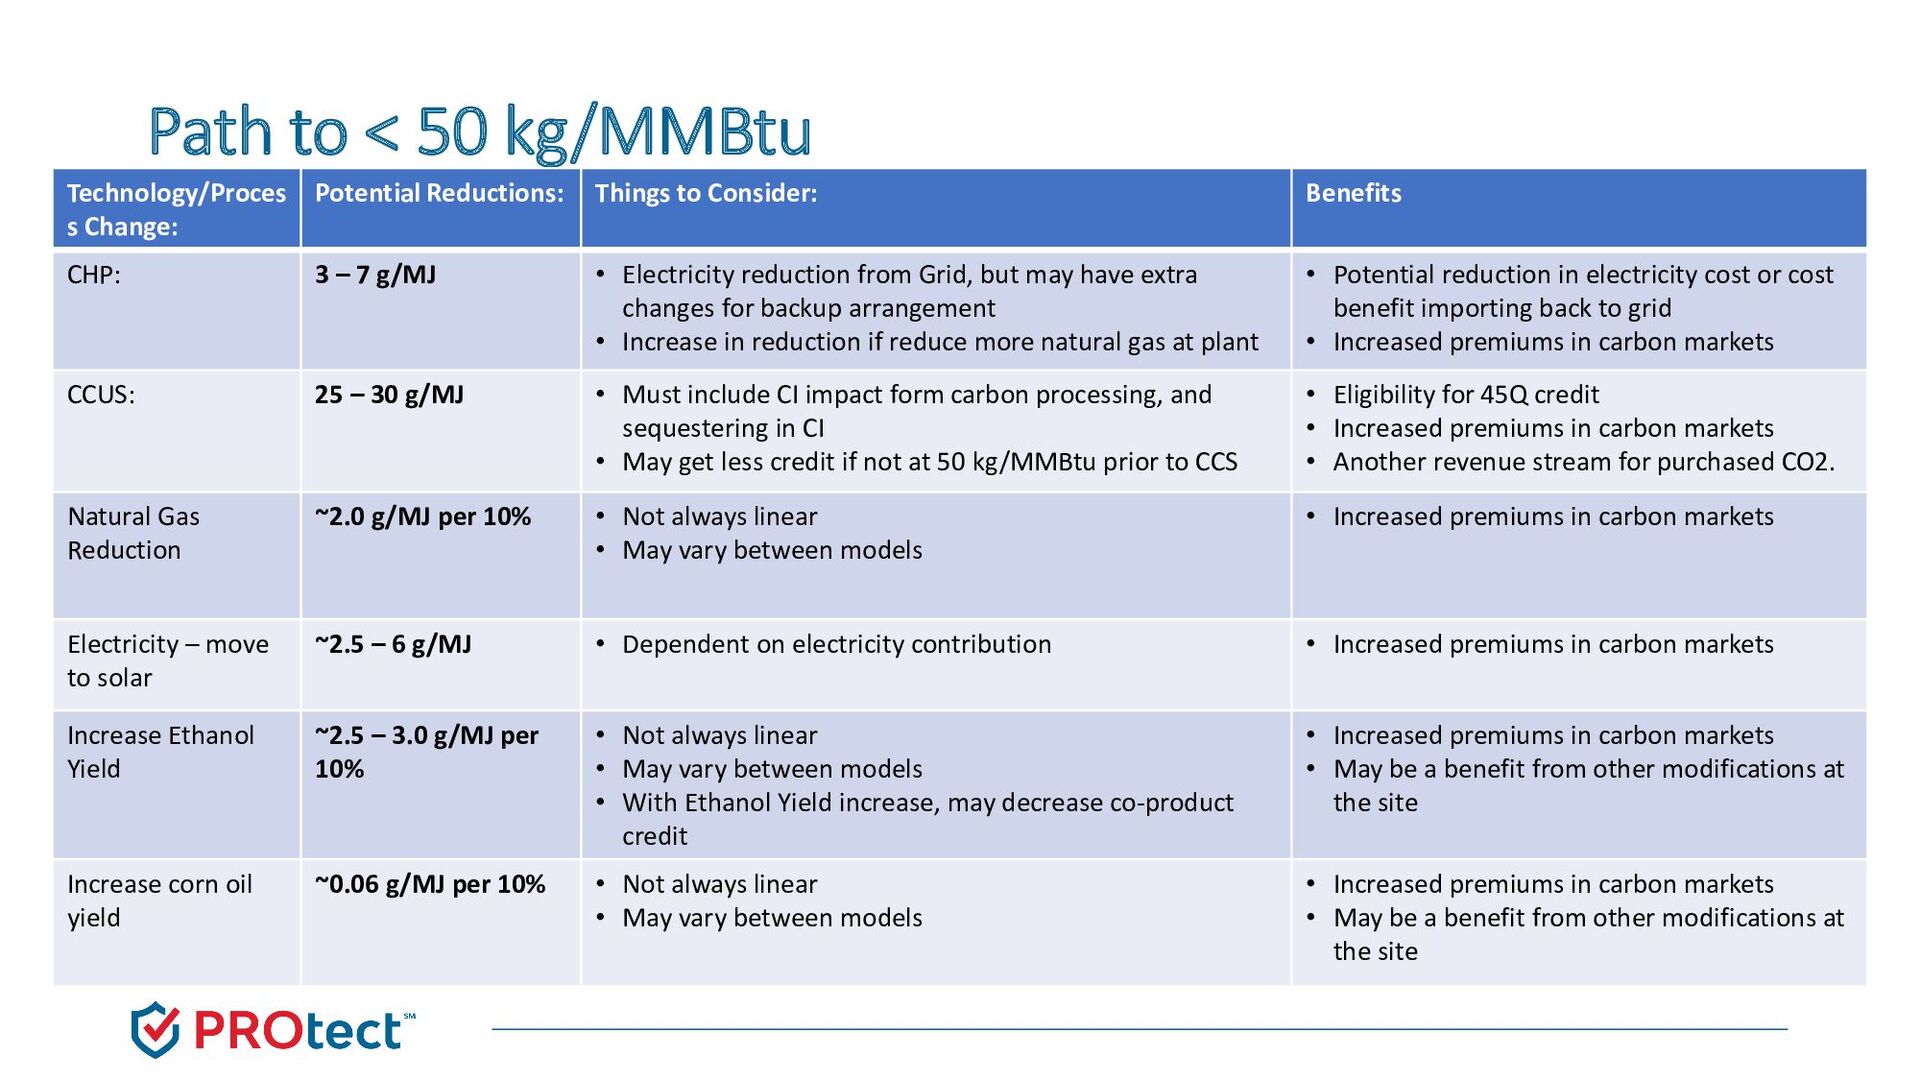
Things to Consider: Benefits CHP: 3 – 7 g/MJ • Electricity reduction from Grid, but may have extra changes for backup arrangement • Increase in reduction if reduce more natural gas at plant • Potential reduction in electricity cost or cost benefit importing back to grid • Increased premiums in carbon markets CCUS: 25 – 30 g/MJ • Must include CI impact form carbon processing, and sequestering in CI • May get less credit if not at 50 kg/MMBtu prior to CCS • Eligibility for 45Q credit • Increased premiums in carbon markets • Another revenue stream for purchased CO2. Natural Gas Reduction ~2.0 g/MJ per 10% • Not always linear • May vary between models • Increased premiums in carbon markets Electricity – move to solar ~2.5 – 6 g/MJ • Dependent on electricity contribution • Increased premiums in carbon markets Increase Ethanol Yield ~2.5 – 3.0 g/MJ per 10% • Not always linear • May vary between models • With Ethanol Yield increase, may decrease co-product credit • Increased premiums in carbon markets • May be a benefit from other modifications at the site Increase corn oil yield ~0.06 g/MJ per 10% • Not always linear • May vary between models • Increased premiums in carbon markets • May be a benefit from other modifications at the site
![Questions? Andrea Foglesong 316-617-1510 [email protected]](https://files.speakerdeck.com/presentations/7db51ace249e4731afb06fb5136a4b03/slide_13.jpg)