Upgrade to Pro — share decks privately, control downloads, hide ads and more …

Graphics: Django + Highcharts

Regis da Silva
June 04, 2016
280

Graphics: Django + Highcharts

Plot graphics with Django and Highcharts.

Regis da Silva

June 04, 2016
Tweet

Transcript

  1. Gr´ aficos: Django + Highcharts R´ egis da Silva Santos

    http://rg3915.github.io github.com/grupy-sp/encontros 04 de Junho de 2016 1 / 34
  2. Django Se vocˆ e n˜ ao conhece Django sugiro que

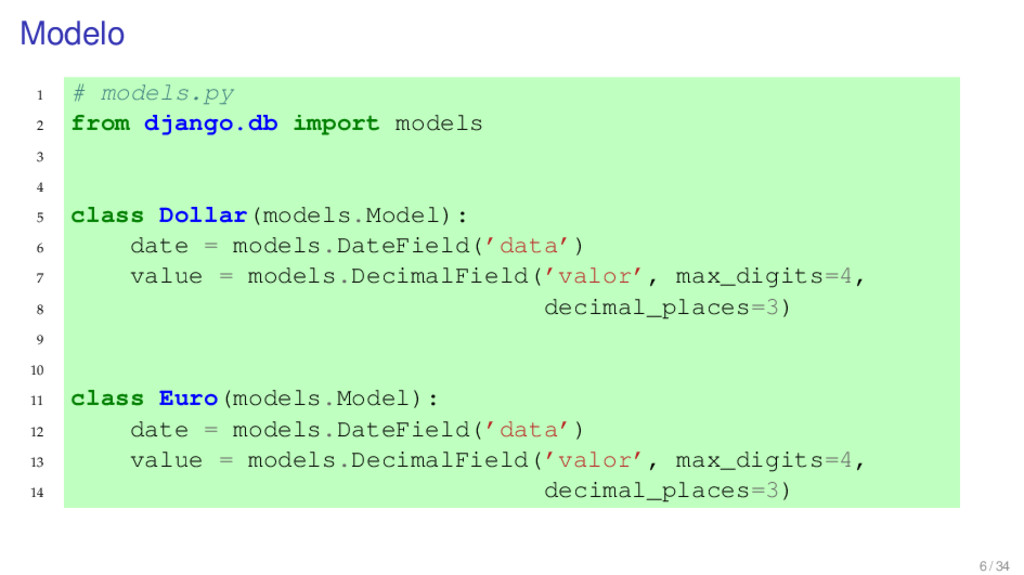
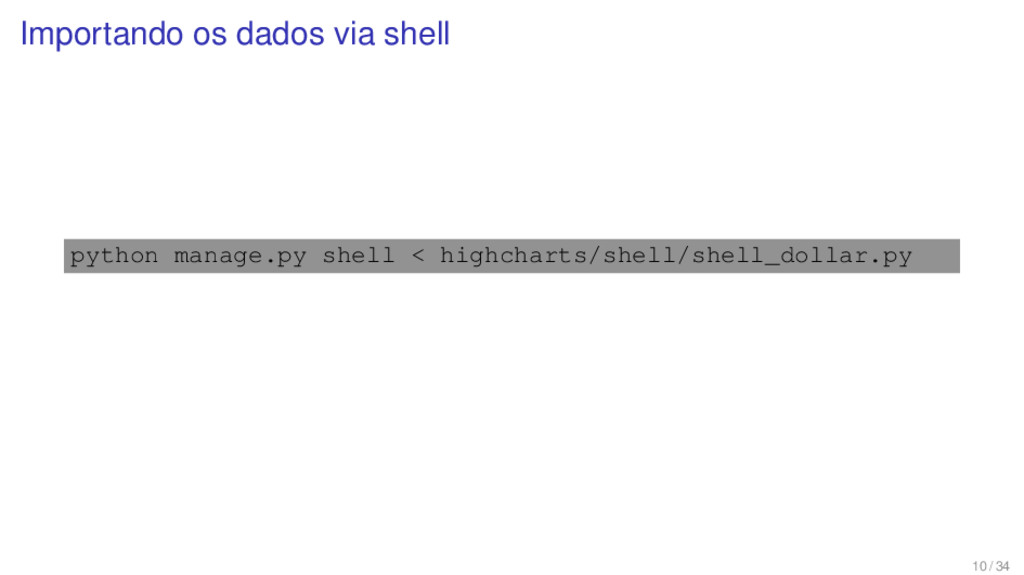
    leia este tutorial. http://pythonclub.com.br/tutorial-django-17.html Al´ em da documentac ¸ ˜ ao oficial. https://docs.djangoproject.com/en/1.9/intro/tutorial01/ Django==1.9.6 2 / 34
  3. Modelo 1 # models.py 2 from django.db import models 3

    4 5 class Dollar(models.Model): 6 date = models.DateField(’data’) 7 value = models.DecimalField(’valor’, max_digits=4, 8 decimal_places=3) 9 10 11 class Euro(models.Model): 12 date = models.DateField(’data’) 13 value = models.DecimalField(’valor’, max_digits=4, 14 decimal_places=3) 6 / 34
  4. 1 class Category(models.Model): 2 category = models.CharField(’categoria’, max_length=50, 3 unique=True)

    4 5 6 class Product(models.Model): 7 category = models.ForeignKey(’Category’, 8 verbose_name=’categoria’) 9 product = models.CharField(’Produto’, max_length=60, 10 unique=True) 11 price = models.DecimalField(’Prec ¸o’, max_digits=6, 12 decimal_places=2) 7 / 34
  5. Importando os dados de um CSV Variac ¸ ˜ ao

    do d´ olar http://www.dolarhoje.net.br/dolar-comercial.php 1 # dollar.csv 2 date,value 3 1/1/2016,3.956 4 4/1/2016,4.033 5 5/1/2016,3.994 6 6/1/2016,4.017 7 7/1/2016,4.052 8 8/1/2016,4.038 9 11/1/2016,4.049 10 ... Variac ¸ ˜ ao do euro http://br.investing.com/currencies/eur-brl-historical-data 8 / 34
  6. 1 # shell_dollar.py 2 import csv 3 import datetime as

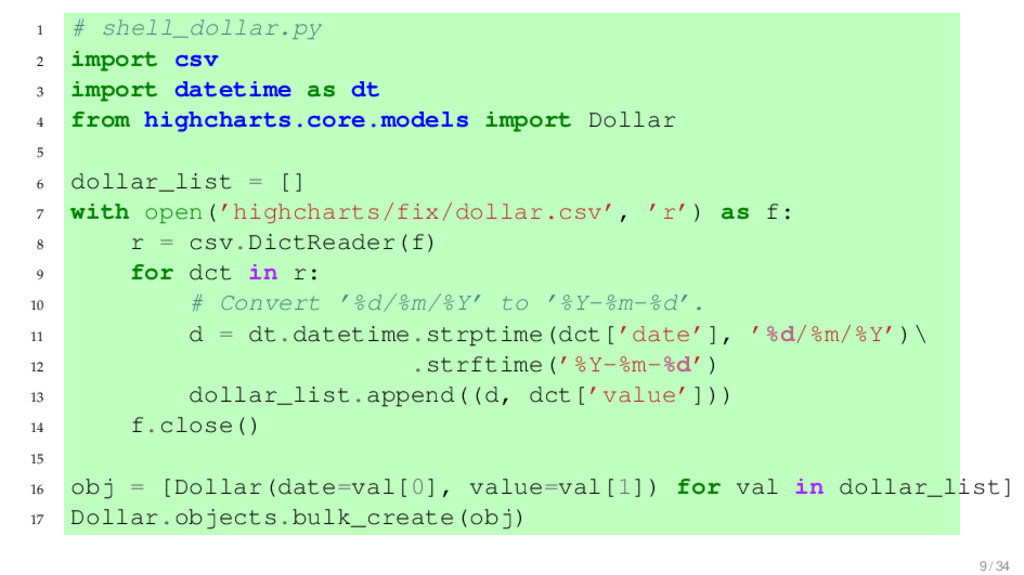
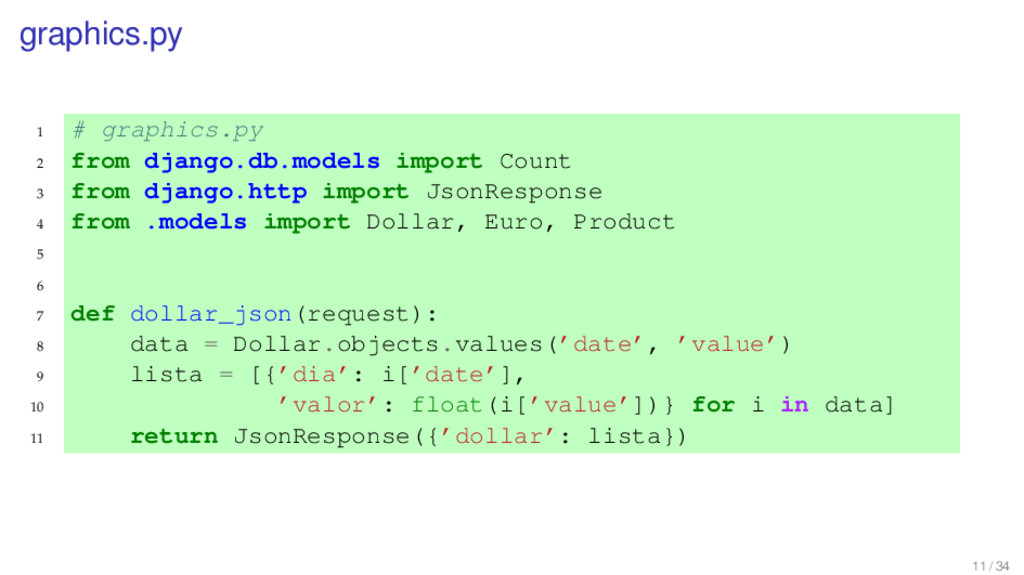
    dt 4 from highcharts.core.models import Dollar 5 6 dollar_list = [] 7 with open(’highcharts/fix/dollar.csv’, ’r’) as f: 8 r = csv.DictReader(f) 9 for dct in r: 10 # Convert ’%d/%m/%Y’ to ’%Y-%m-%d’. 11 d = dt.datetime.strptime(dct[’date’], ’%d/%m/%Y’)\ 12 .strftime(’%Y-%m-%d’) 13 dollar_list.append((d, dct[’value’])) 14 f.close() 15 16 obj = [Dollar(date=val[0], value=val[1]) for val in dollar_list] 17 Dollar.objects.bulk_create(obj) 9 / 34
  7. graphics.py 1 # graphics.py 2 from django.db.models import Count 3

    from django.http import JsonResponse 4 from .models import Dollar, Euro, Product 5 6 7 def dollar_json(request): 8 data = Dollar.objects.values(’date’, ’value’) 9 lista = [{’dia’: i[’date’], 10 ’valor’: float(i[’value’])} for i in data] 11 return JsonResponse({’dollar’: lista}) 11 / 34
  8. graphics.py 1 def euro_json(request): 2 data = Euro.objects.values(’date’, ’value’) 3

    lista = [[i[’date’], float(i[’value’])] for i in data] 4 return JsonResponse({’euro’: lista}) 12 / 34
  9. urls.py 1 # urls.py 2 from django.conf.urls import include, url

    3 from django.contrib import admin 4 5 urlpatterns = [ 6 url(r’’, include(’highcharts.core.urls’, namespace=’core’)), 7 url(r’ˆadmin/’, include(admin.site.urls)), 8 ] 13 / 34
  10. core/urls.py 1 # core/urls.py 2 from django.conf.urls import url 3

    from highcharts.core.graphics import dollar_json, euro_json, prod 4 from highcharts.core import views as v 5 6 urlpatterns = [ 7 url(r’ˆ$’, v.home, name=’home’), 8 url(r’ˆdollar-graphic/$’, v.dollar_graphic, name=’dollar-grap 9 url(r’ˆeuro-graphic/$’, v.euro_graphic, name=’euro-graphic’), 10 url(r’ˆproduct-graphic/$’, v.product_graphic, name=’product-g 11 url(r’ˆdollar_json/$’, dollar_json), 12 url(r’ˆeuro_json/$’, euro_json), 13 url(r’ˆproduct_json/$’, product_json), 14 ] 14 / 34
  11. http://localhost:8000/dollar json/ { "dollar": [{ "dia": "2016-01-01", "valor": 3.956 },

    { "dia": "2016-01-04", "valor": 4.033 }, ..., { "dia": "2016-05-26", "valor": 3.596 } ] } 15 / 34
  12. Views 1 # views.py 2 from django.shortcuts import render 3

    4 def home(request): 5 return render(request, ’index.html’) 6 7 def dollar_graphic(request): 8 return render(request, ’dollar_graphic.html’) 9 10 def euro_graphic(request): 11 return render(request, ’euro_graphic.html’) 12 13 def product_graphic(request): 14 return render(request, ’product_graphic.html’) 17 / 34
  13. Templates Dentro da pasta highcharts/core/ crie a pasta templates. mkdir

    templates touch templates/base.html touch templates/dollar_graphic.html touch templates/euro_graphic.html touch templates/product_graphic.html 18 / 34
  14. base.html 1 {% load static %} 2 <html> 3 <head>

    4 <!-- jQuery --> 5 <script src="{% static "js/jquery.min.js" %}"></script> 6 <!-- HighCharts JS --> 7 <script src="{% static "js/highcharts.js" %}"></script> 8 </head> 9 <body> 10 {% include "nav.html" %} 11 <div class="container"> 12 {% block content %}{% endblock content %} 13 {% block js %}{% endblock js %} 14 </div> 15 </body> 16 </html> 19 / 34
  15. dollar graphic.html 1 {% extends "base.html" %} 2 {% load

    static %} 3 4 {% block content %} 5 <div id="dollar-chart"></div> 6 {% endblock %} 7 8 {% block js %} 9 <script src="{% static ’js/dollar_graphic.js’ %}"></script> 10 {% endblock js %} 20 / 34
  16. Crie a pasta static/js. mkdir -p static/js touch static/js/dollar_graphic.js touch

    static/js/euro_graphic.js touch static/js/product_graphic.js 21 / 34
  17. dollar graphic.js 1 # dollar_graphic.js 2 $(function () { 3

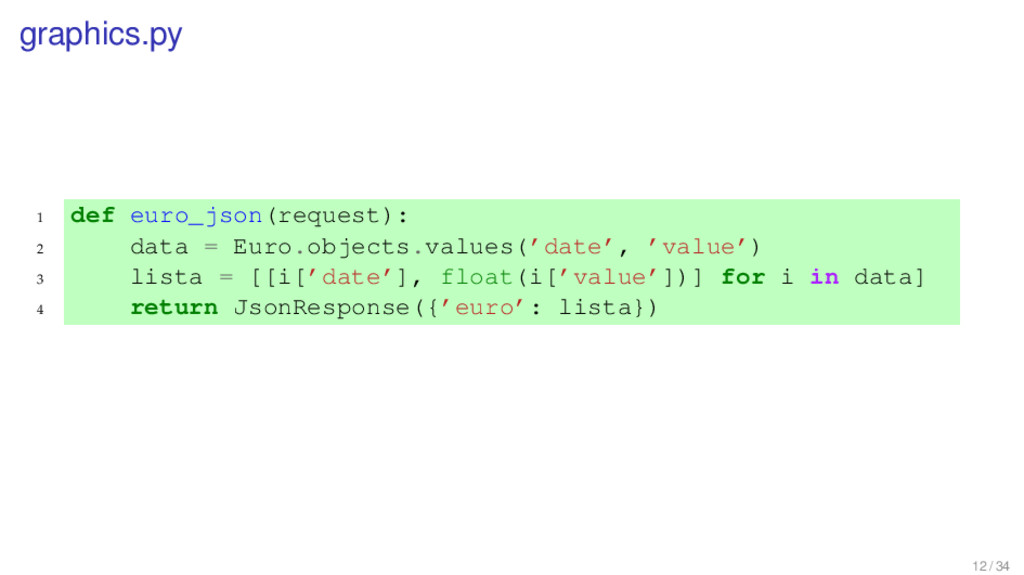
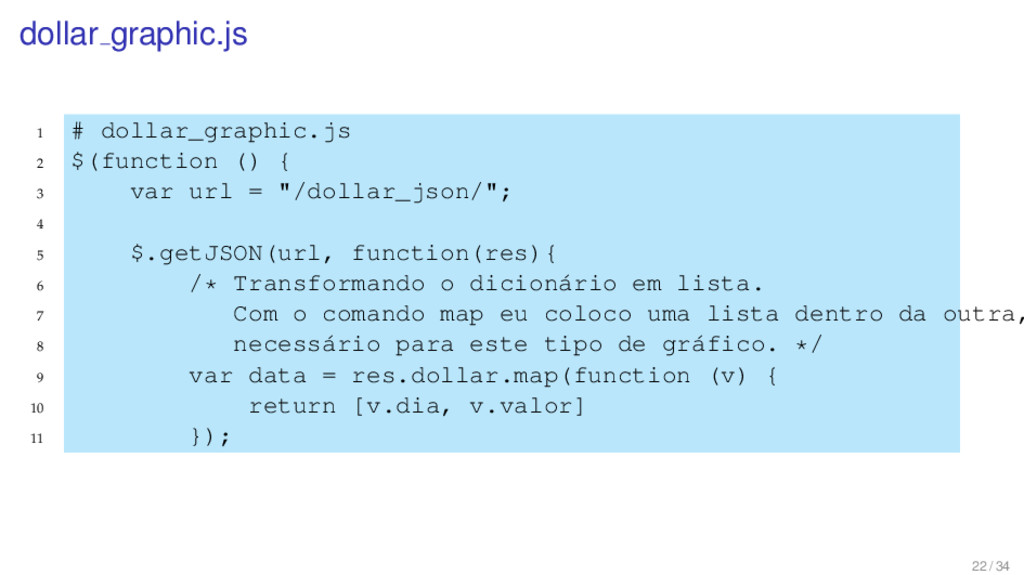
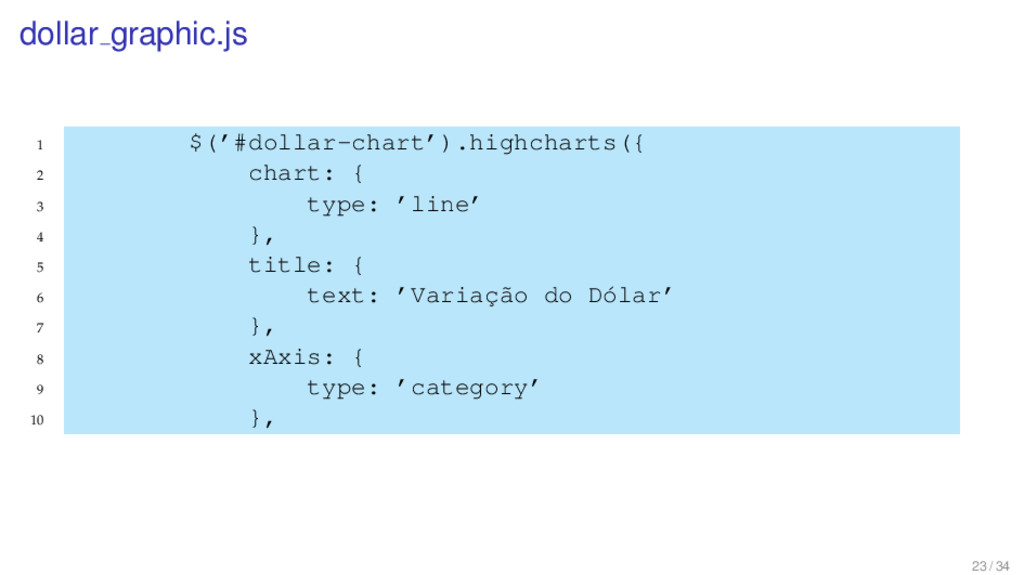
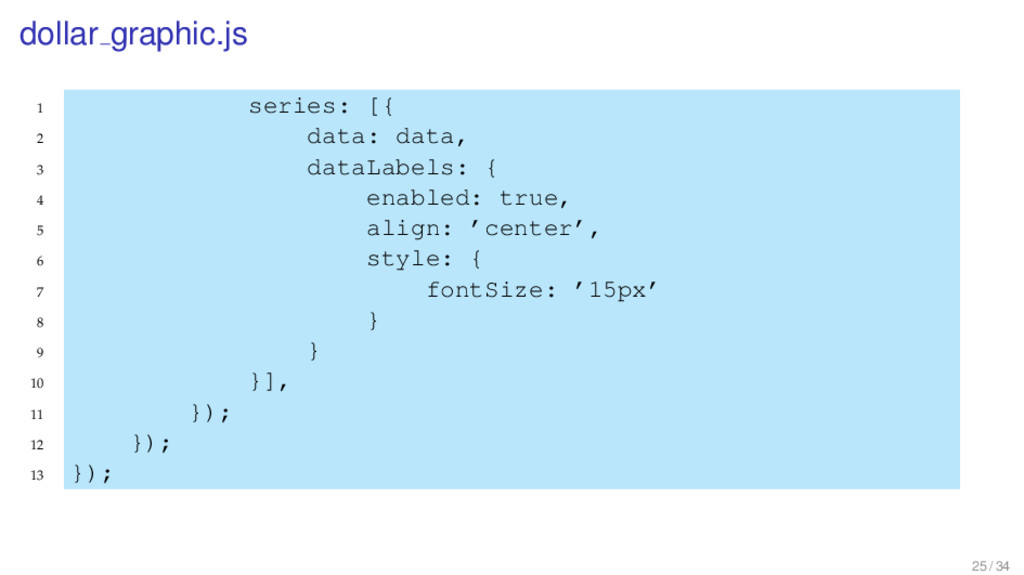
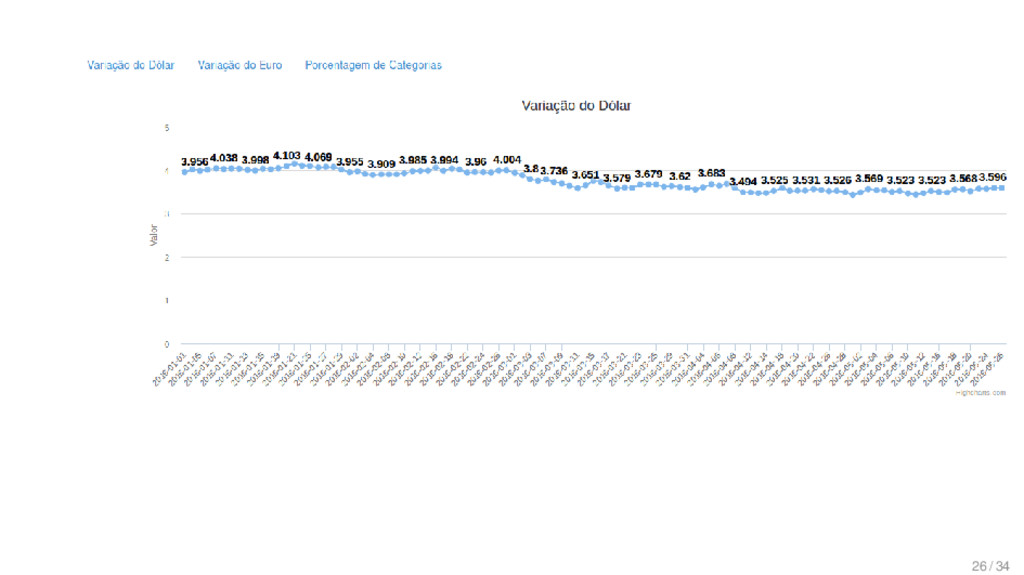
    var url = "/dollar_json/"; 4 5 $.getJSON(url, function(res){ 6 /* Transformando o dicion´ ario em lista. 7 Com o comando map eu coloco uma lista dentro da outra, 8 necess´ ario para este tipo de gr´ afico. */ 9 var data = res.dollar.map(function (v) { 10 return [v.dia, v.valor] 11 }); 22 / 34
  18. dollar graphic.js 1 $(’#dollar-chart’).highcharts({ 2 chart: { 3 type: ’line’

    4 }, 5 title: { 6 text: ’Variac ¸˜ ao do D´ olar’ 7 }, 8 xAxis: { 9 type: ’category’ 10 }, 23 / 34
  19. dollar graphic.js 1 yAxis: { 2 min: 0, 3 title:

    { 4 text: ’Valor’ 5 }, 6 plotOptions: { 7 line: { 8 dataLabels: { 9 enabled: true 10 }, 11 } 12 }, 13 }, 14 legend: { 15 enabled: false 16 }, 24 / 34
  20. dollar graphic.js 1 series: [{ 2 data: data, 3 dataLabels:

    { 4 enabled: true, 5 align: ’center’, 6 style: { 7 fontSize: ’15px’ 8 } 9 } 10 }], 11 }); 12 }); 13 }); 25 / 34
  21. graphics.py 1 def product_json(request): 2 ’’’ Porcentagem de produtos por

    categoria ’’’ 3 data = Product.objects.values(’category’)\ 4 .annotate(value=Count(’category’))\ 5 .order_by(’category’)\ 6 .values(’category’, ’category__category’, ’value’) 7 total = Product.objects.all().count() 8 ’’’ Podemos reescrever o dicion´ ario com nossos pr´ oprios 9 nomes de campos. ’’’ 10 lista = [{’categoria’: item[’category__category’], 11 ’porcentagem’: float((item[’value’] / total) * 100) 12 for item in data] 13 return JsonResponse({’products’: lista}) 28 / 34
  22. product graphic.js 1 $(function () { 2 var url =

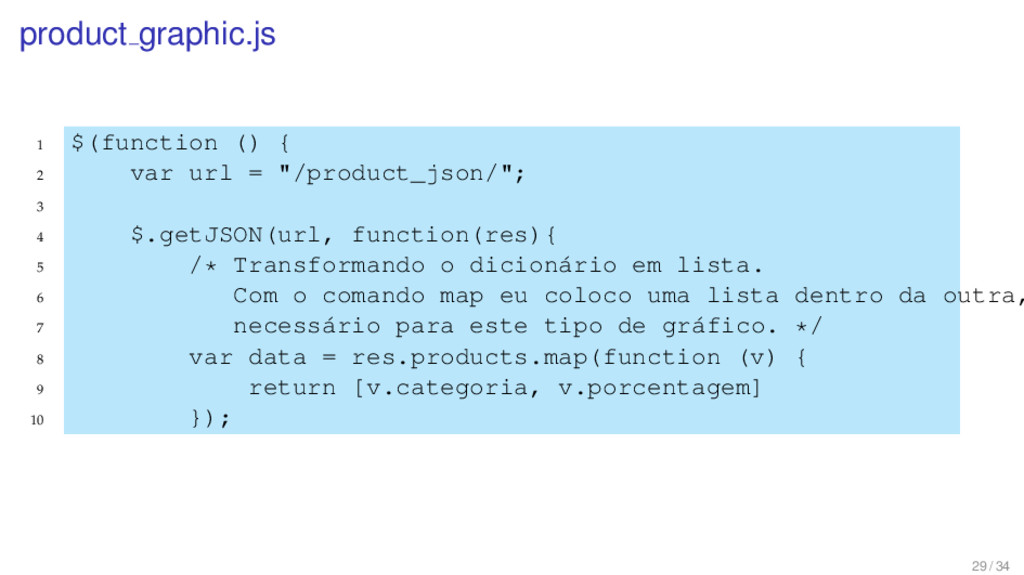
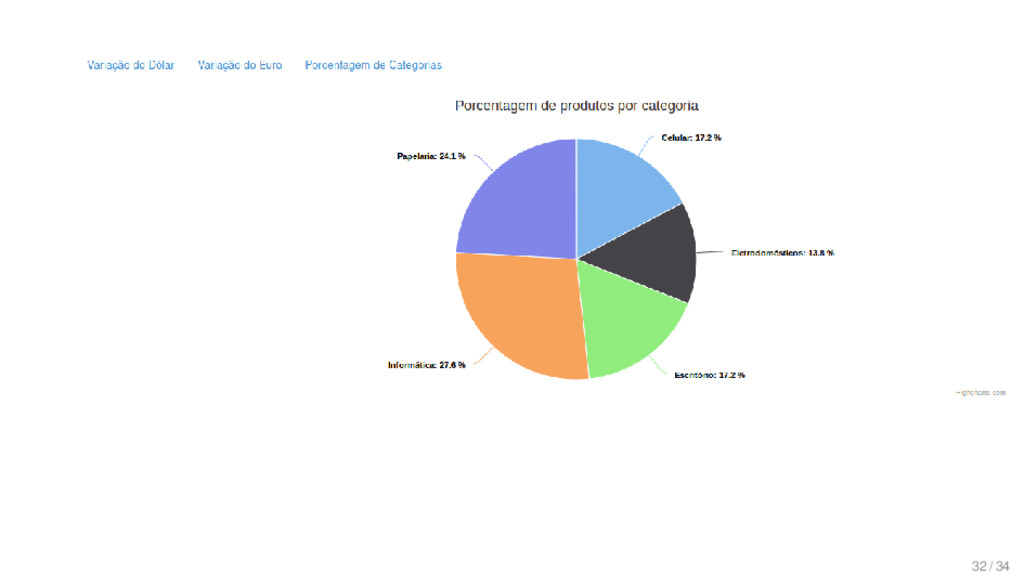
    "/product_json/"; 3 4 $.getJSON(url, function(res){ 5 /* Transformando o dicion´ ario em lista. 6 Com o comando map eu coloco uma lista dentro da outra, 7 necess´ ario para este tipo de gr´ afico. */ 8 var data = res.products.map(function (v) { 9 return [v.categoria, v.porcentagem] 10 }); 29 / 34
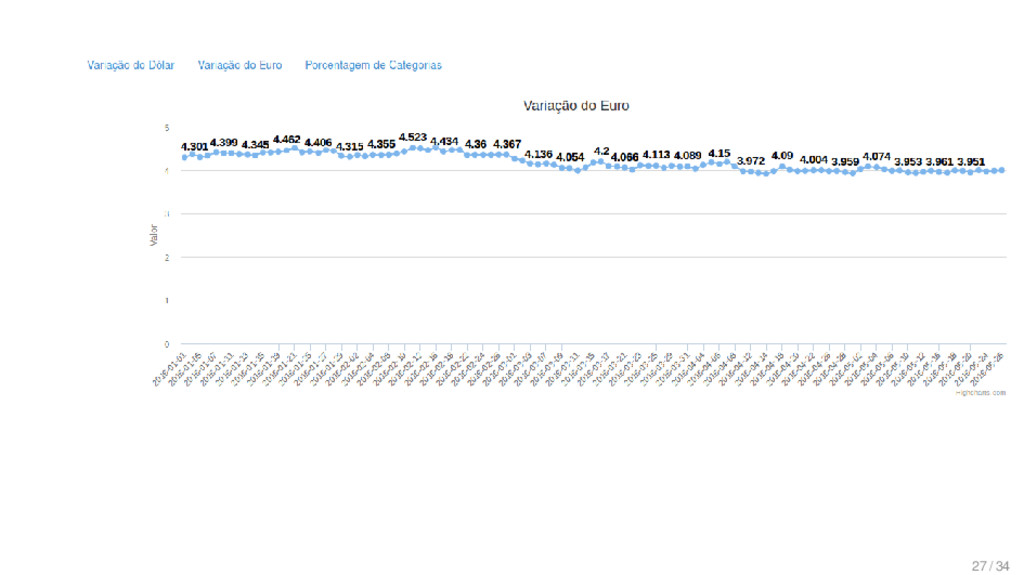
  23. product graphic.js 1 $(’#product-chart’).highcharts({ 2 chart: { 3 type: ’pie’

    4 }, 5 title: { 6 text: ’Porcentagem de produtos por categoria’ 7 }, 8 tooltip: { 9 pointFormat: ’<b>{point.percentage:.1f}%</b>’ 10 }, 11 plotOptions: { 12 pie: { 13 allowPointSelect: true, 14 cursor: ’pointer’, 15 dataLabels: { 16 enabled: true, 17 format: ’<b>{point.name}</b>: {point.perc 30 / 34
  24. product graphic.js 1 series: [{ 2 name: ’Categoria’, 3 colorByPoint:

    true, 4 data: data 5 }], 6 }); 7 }); 8 }); 31 / 34
  25. Gr´ aficos: Django + Highcharts R´ egis da Silva Santos

    http://rg3915.github.io github.com/grupy-sp/encontros 04 de Junho de 2016 34 / 34