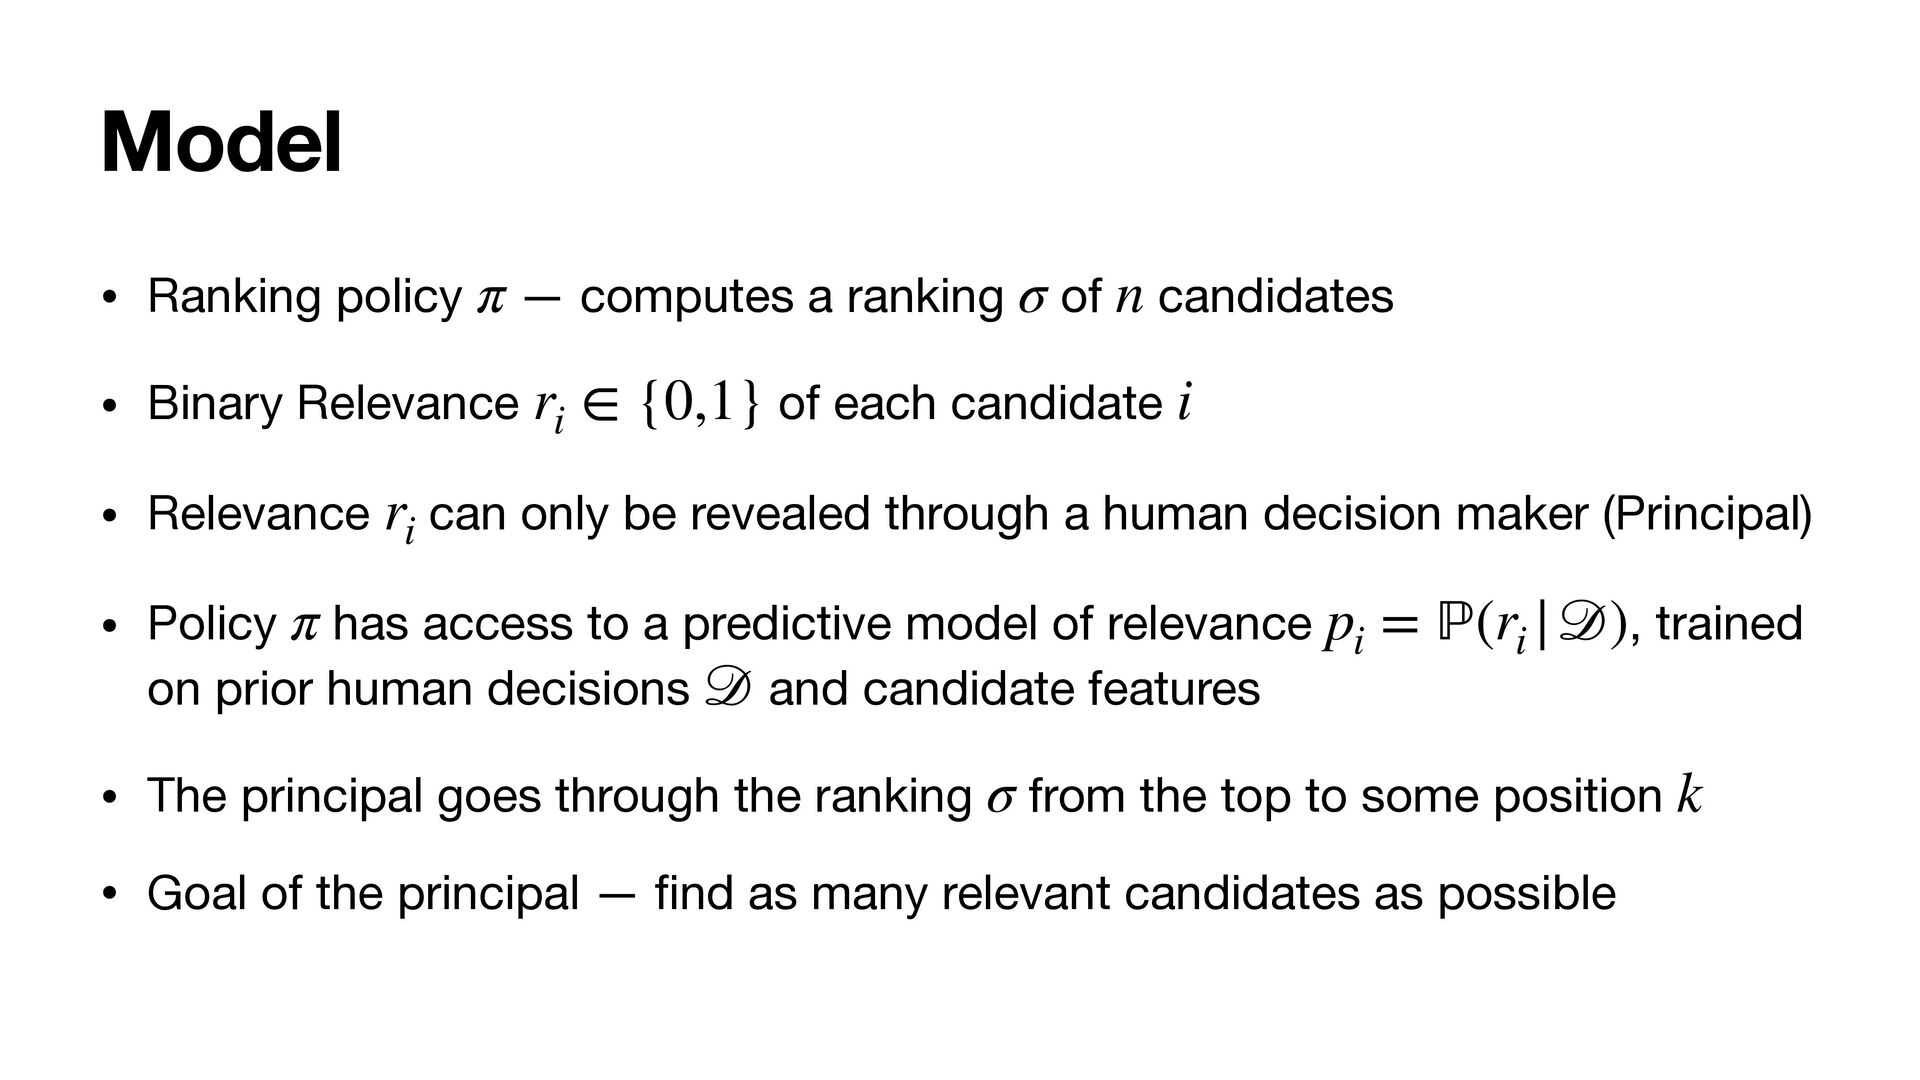
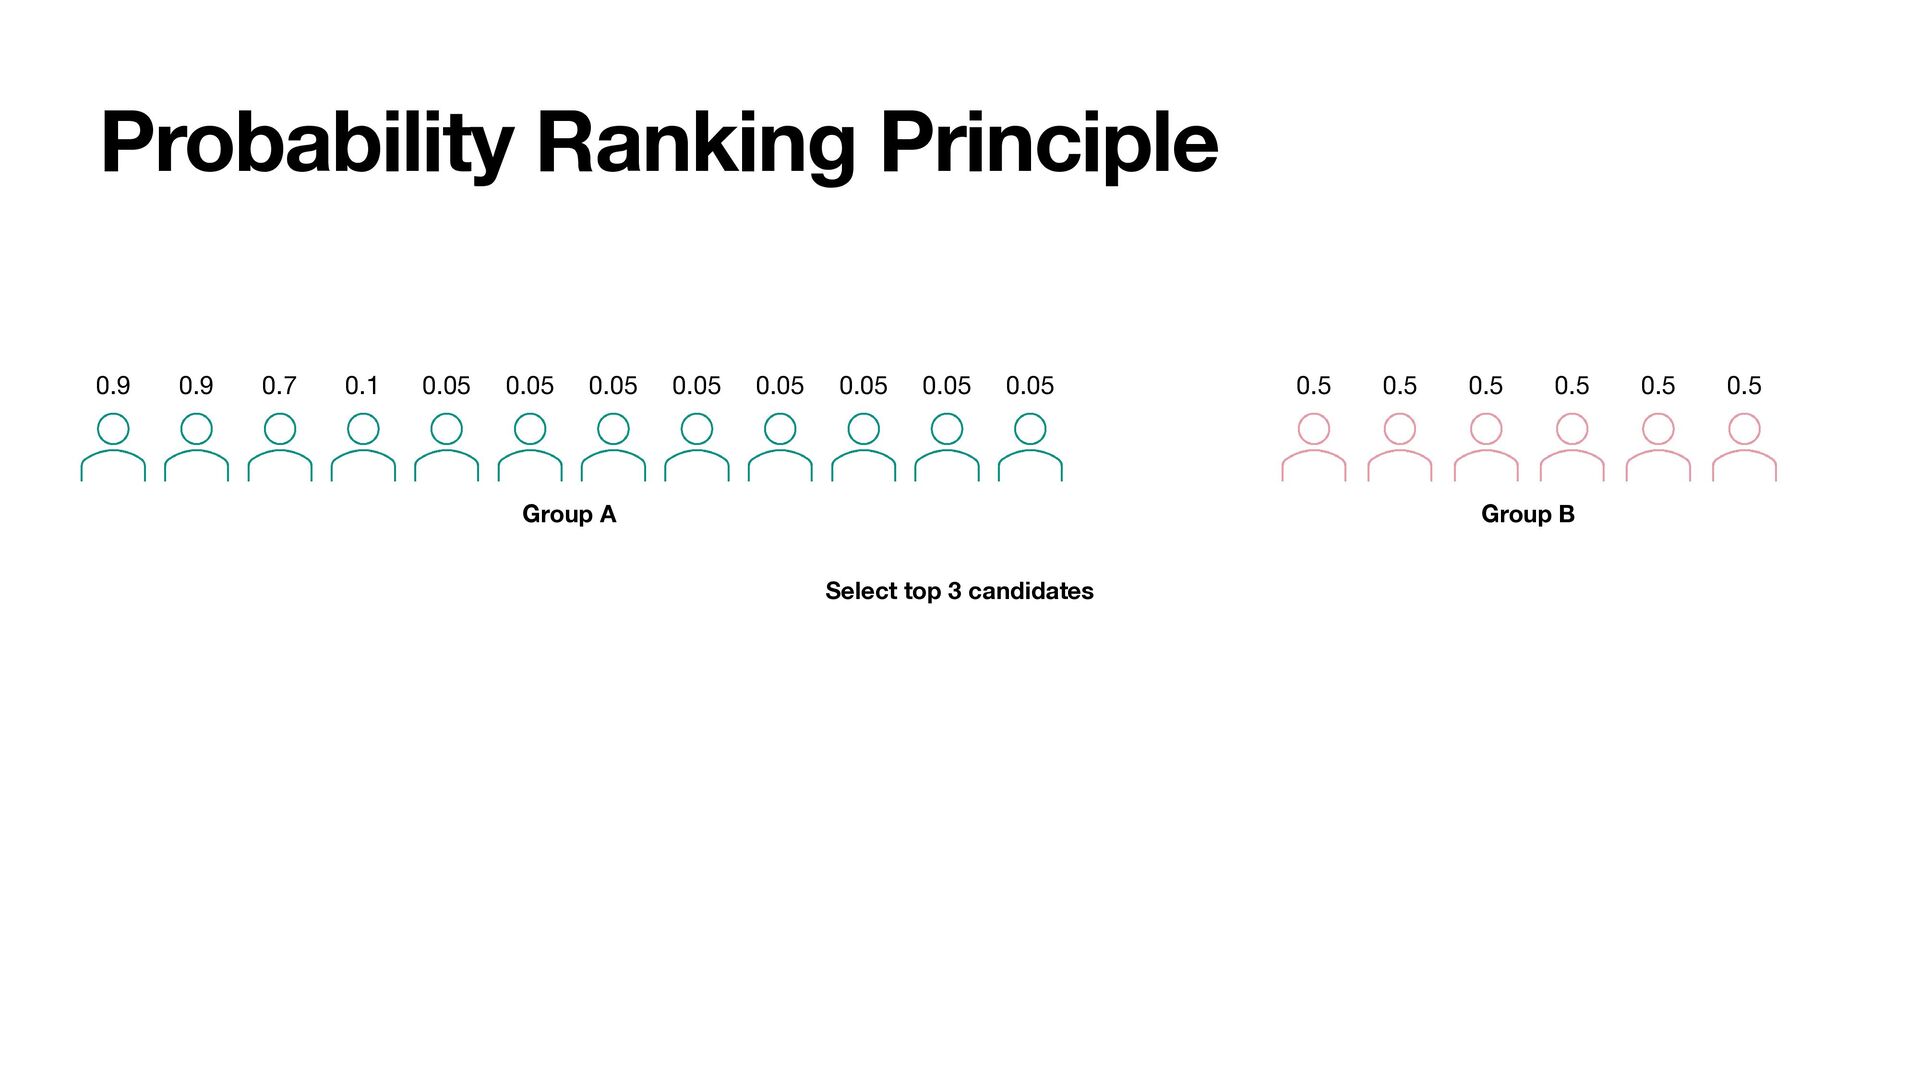
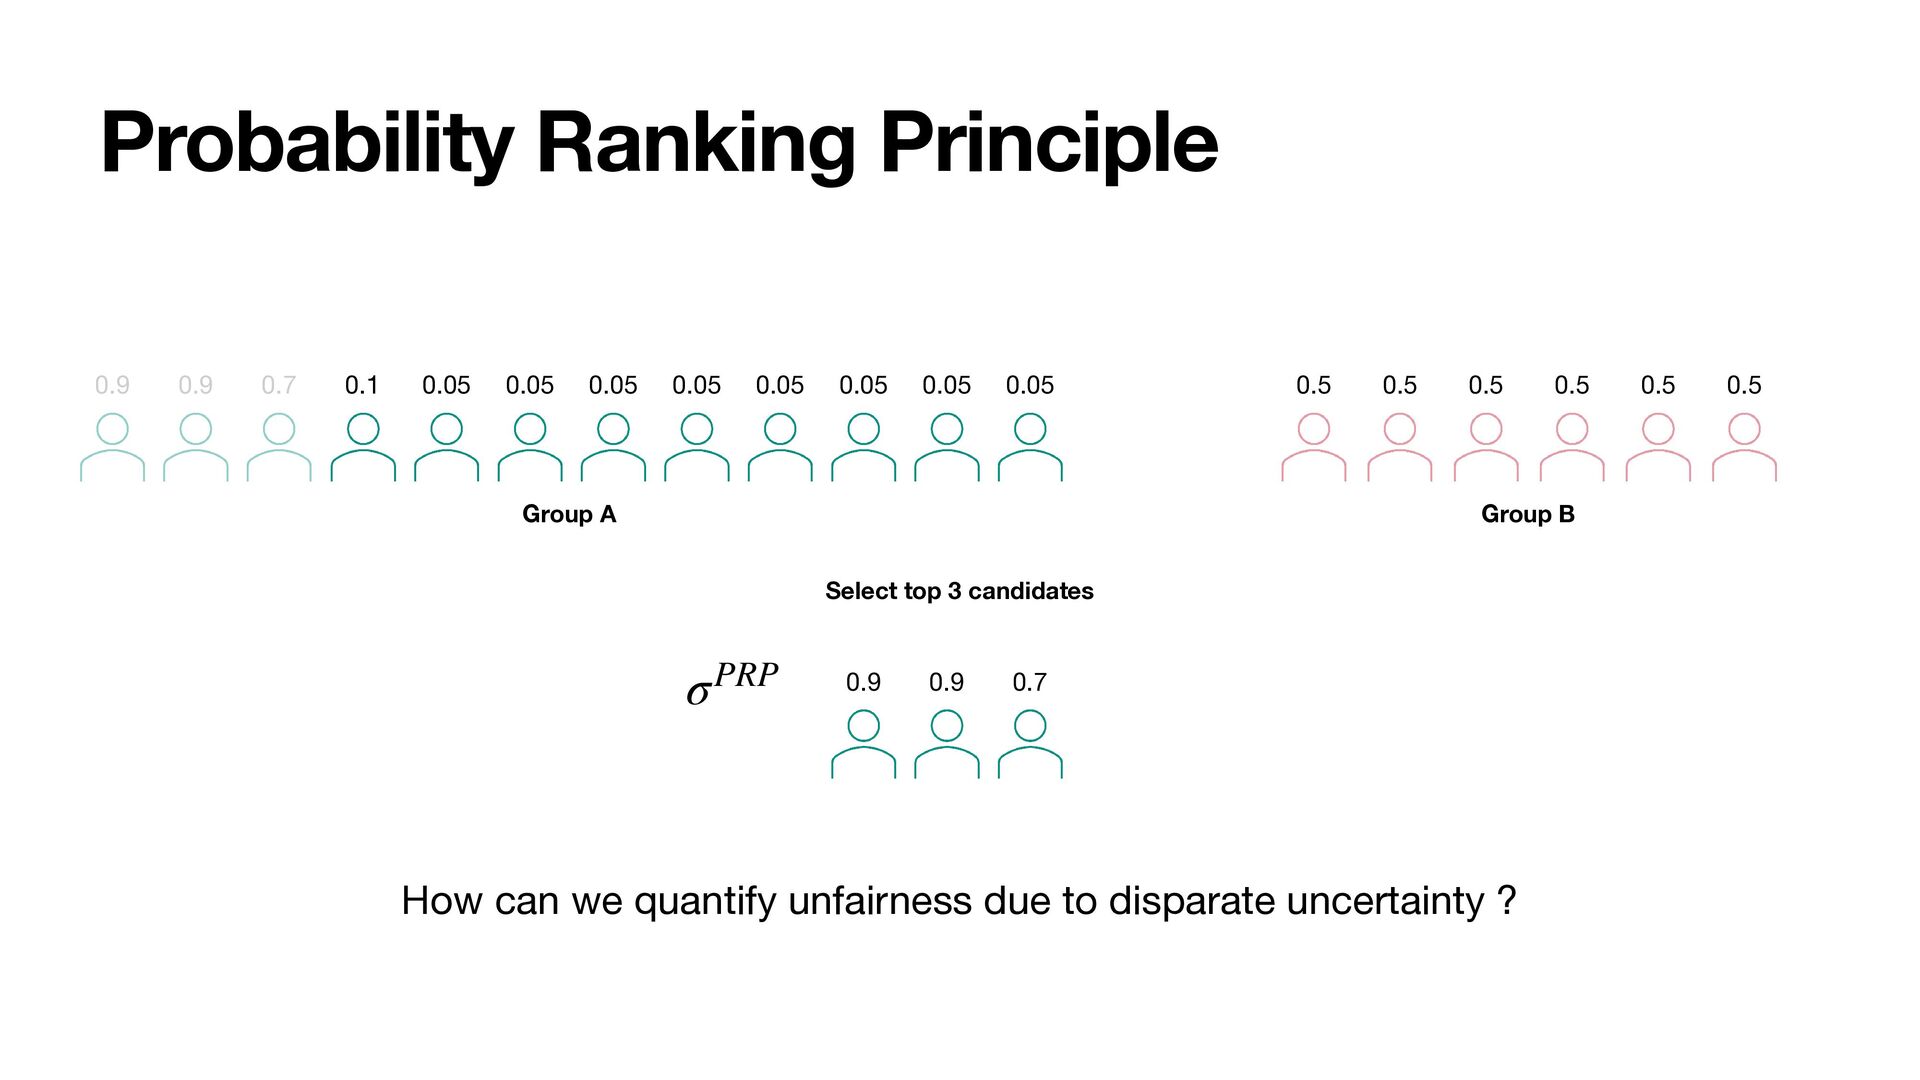
• Binary Relevance of each candidate • Relevance can only be revealed through a human decision maker (Principal) • Policy has access to a predictive model of relevance , trained on prior human decisions and candidate features • The principal goes through the ranking from the top to some position • Goal of the principal — fi nd as many relevant candidates as possible π σ n ri ∈ {0,1} i ri π pi = ℙ(ri | 𝒟 ) 𝒟 σ k
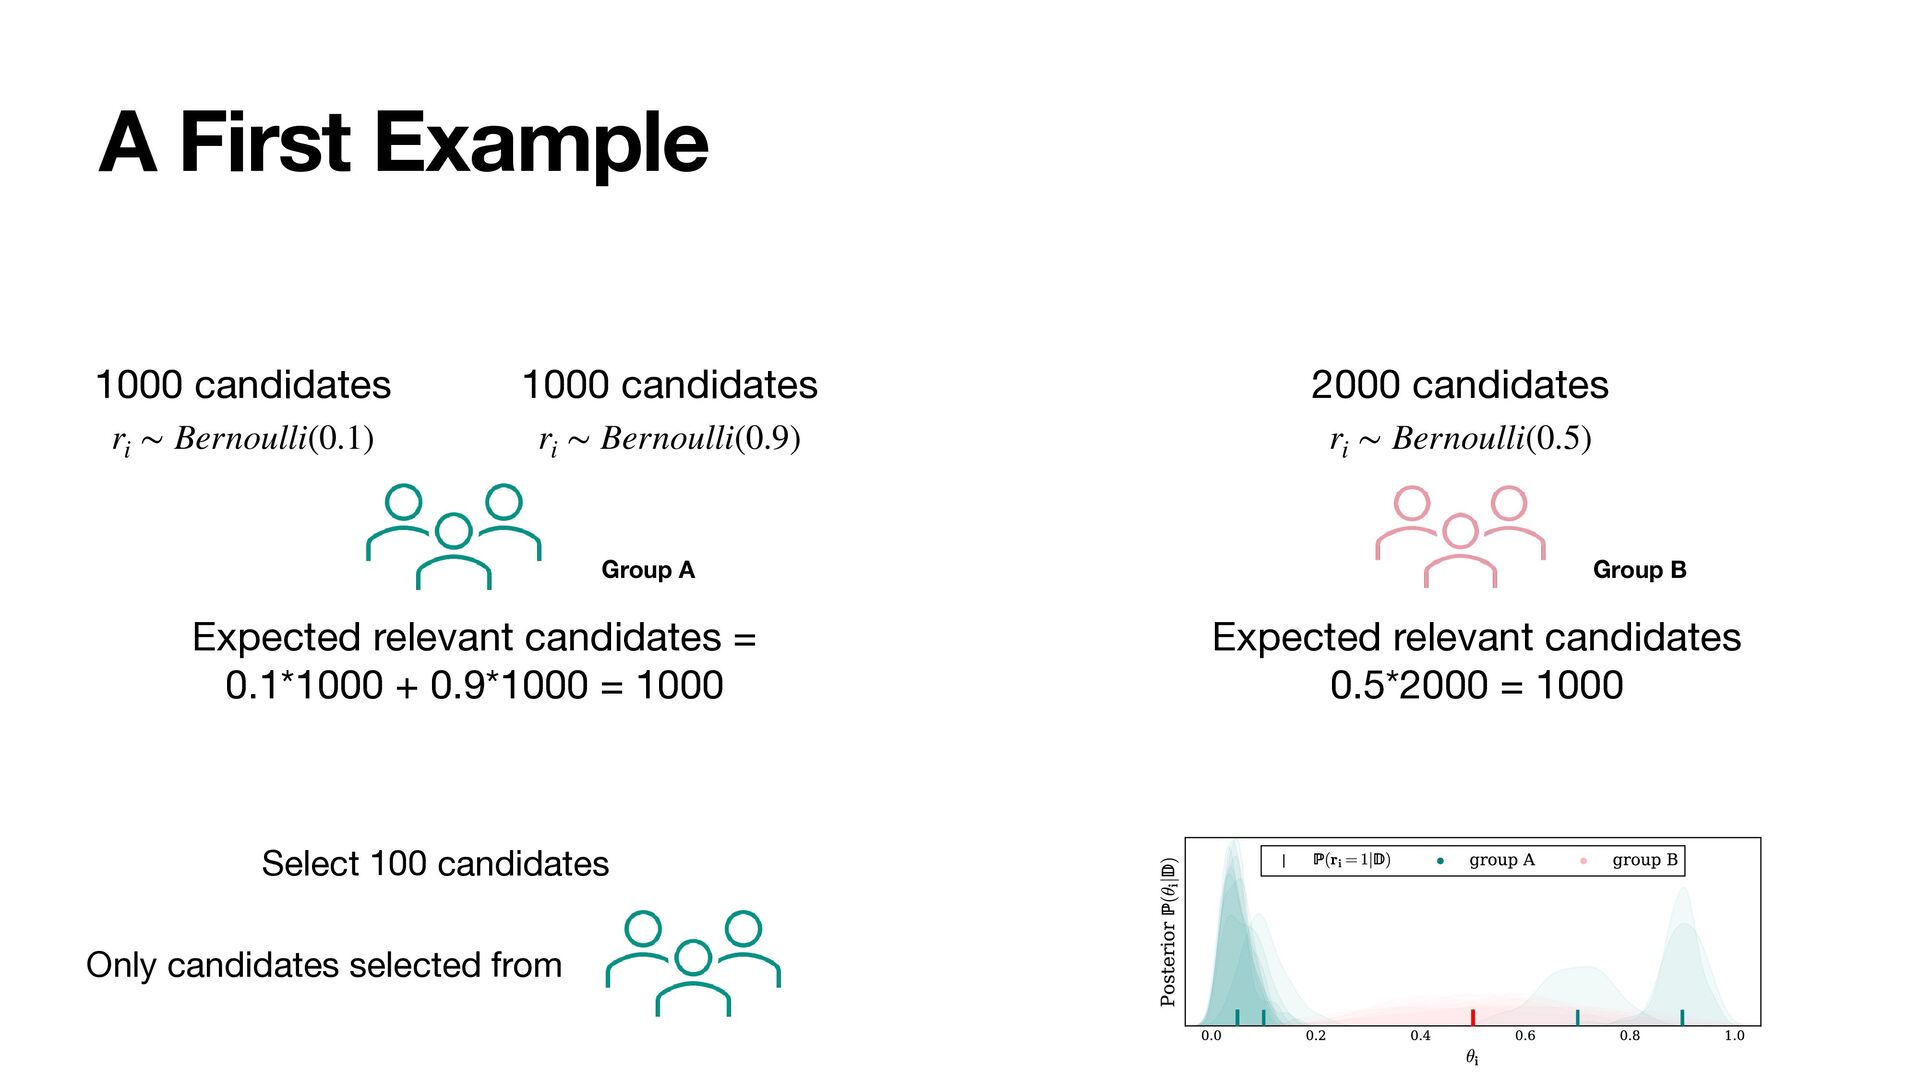
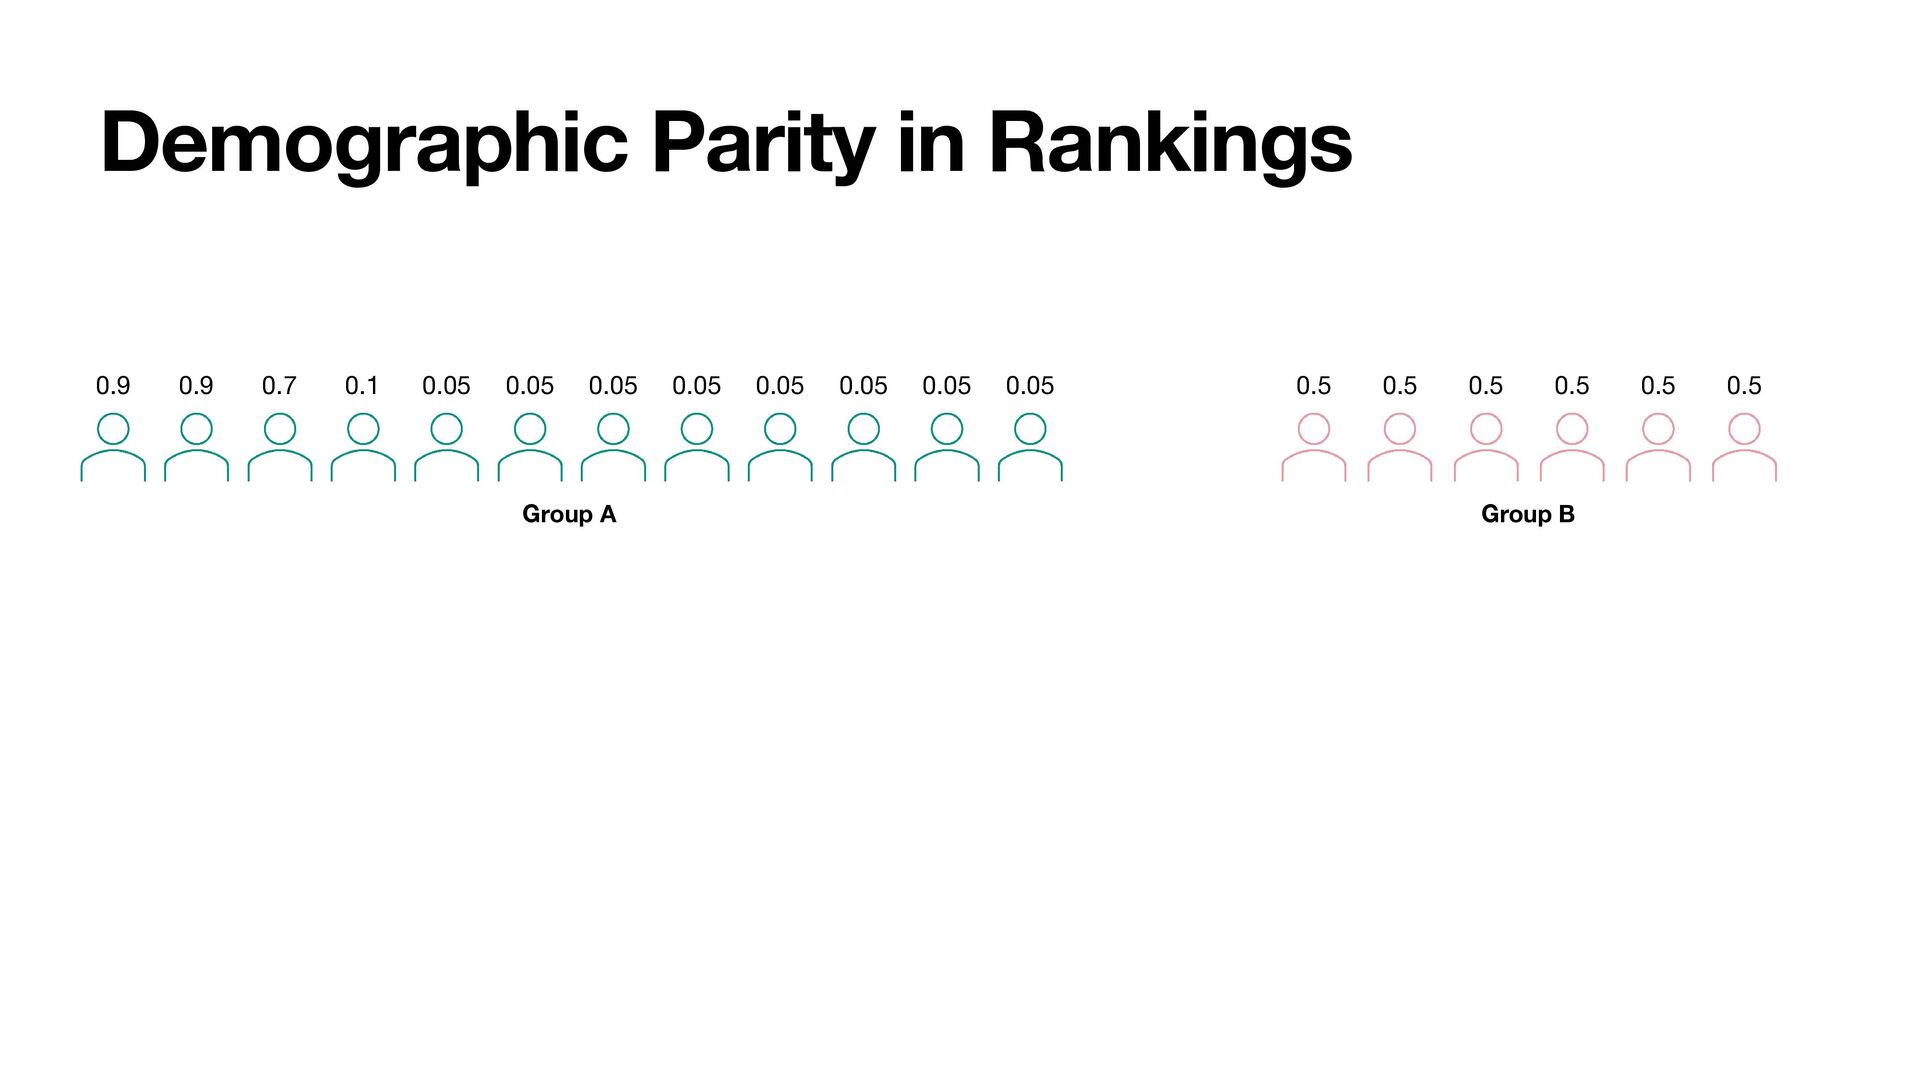
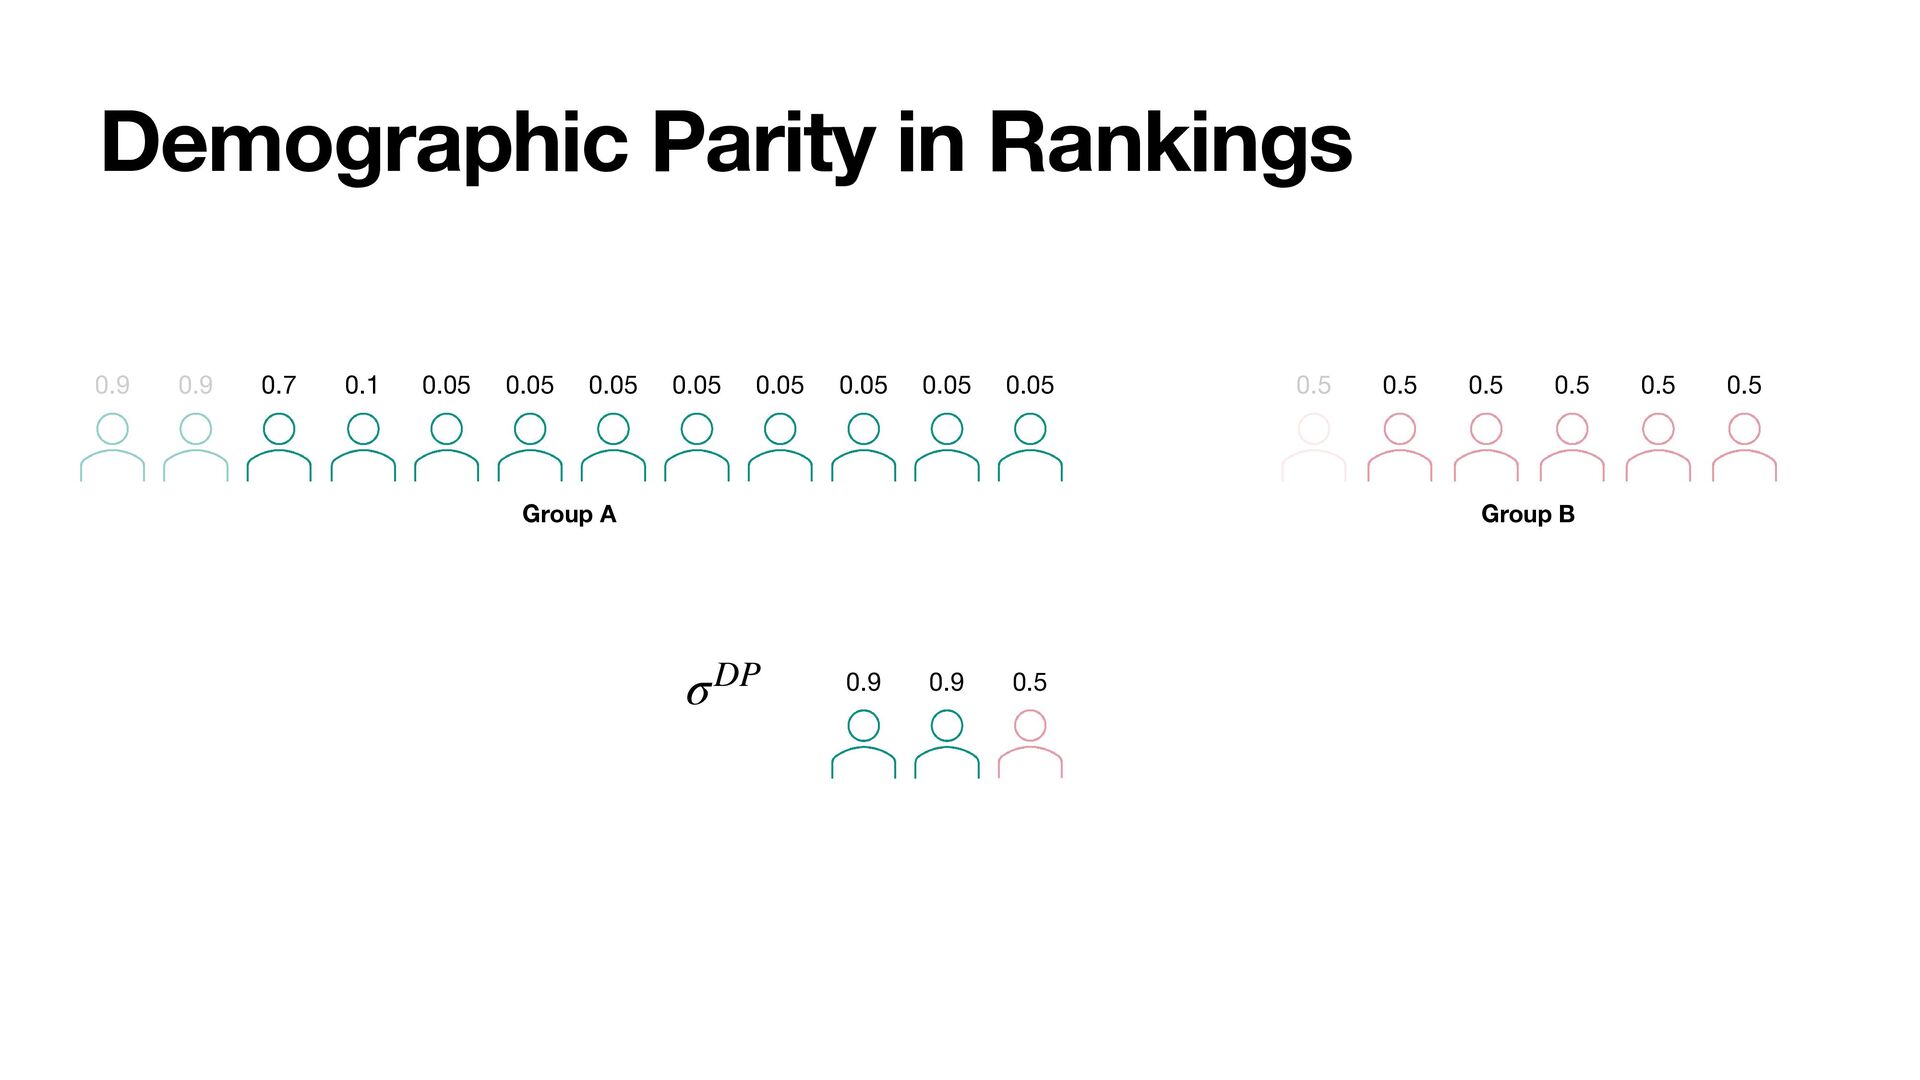
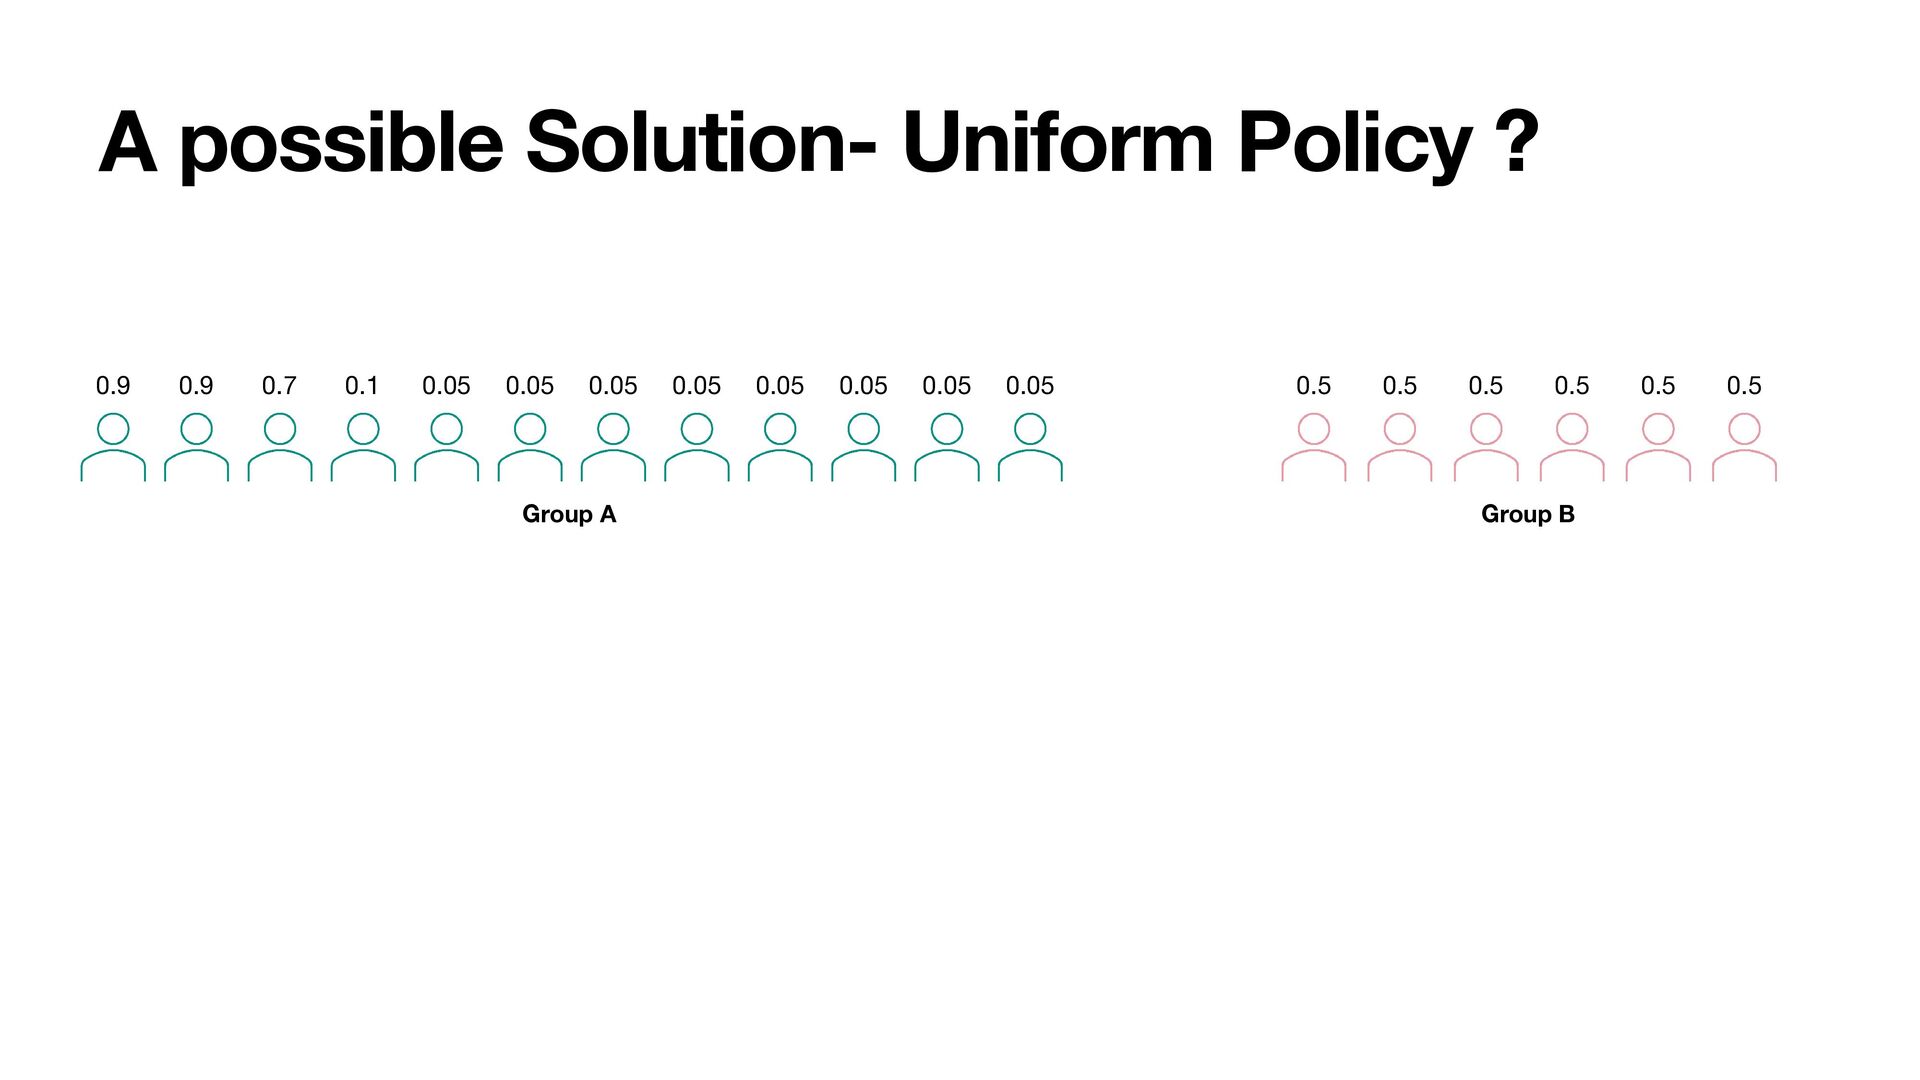
due to disparate uncertainty ? 0.5 0.5 0.5 0.5 0.5 0.5 0.1 0.05 0.05 0.05 0.05 0.05 0.9 0.7 0.7 0.9 0.9 0.05 0.05 0.05 Group A Group B Select top 3 candidates
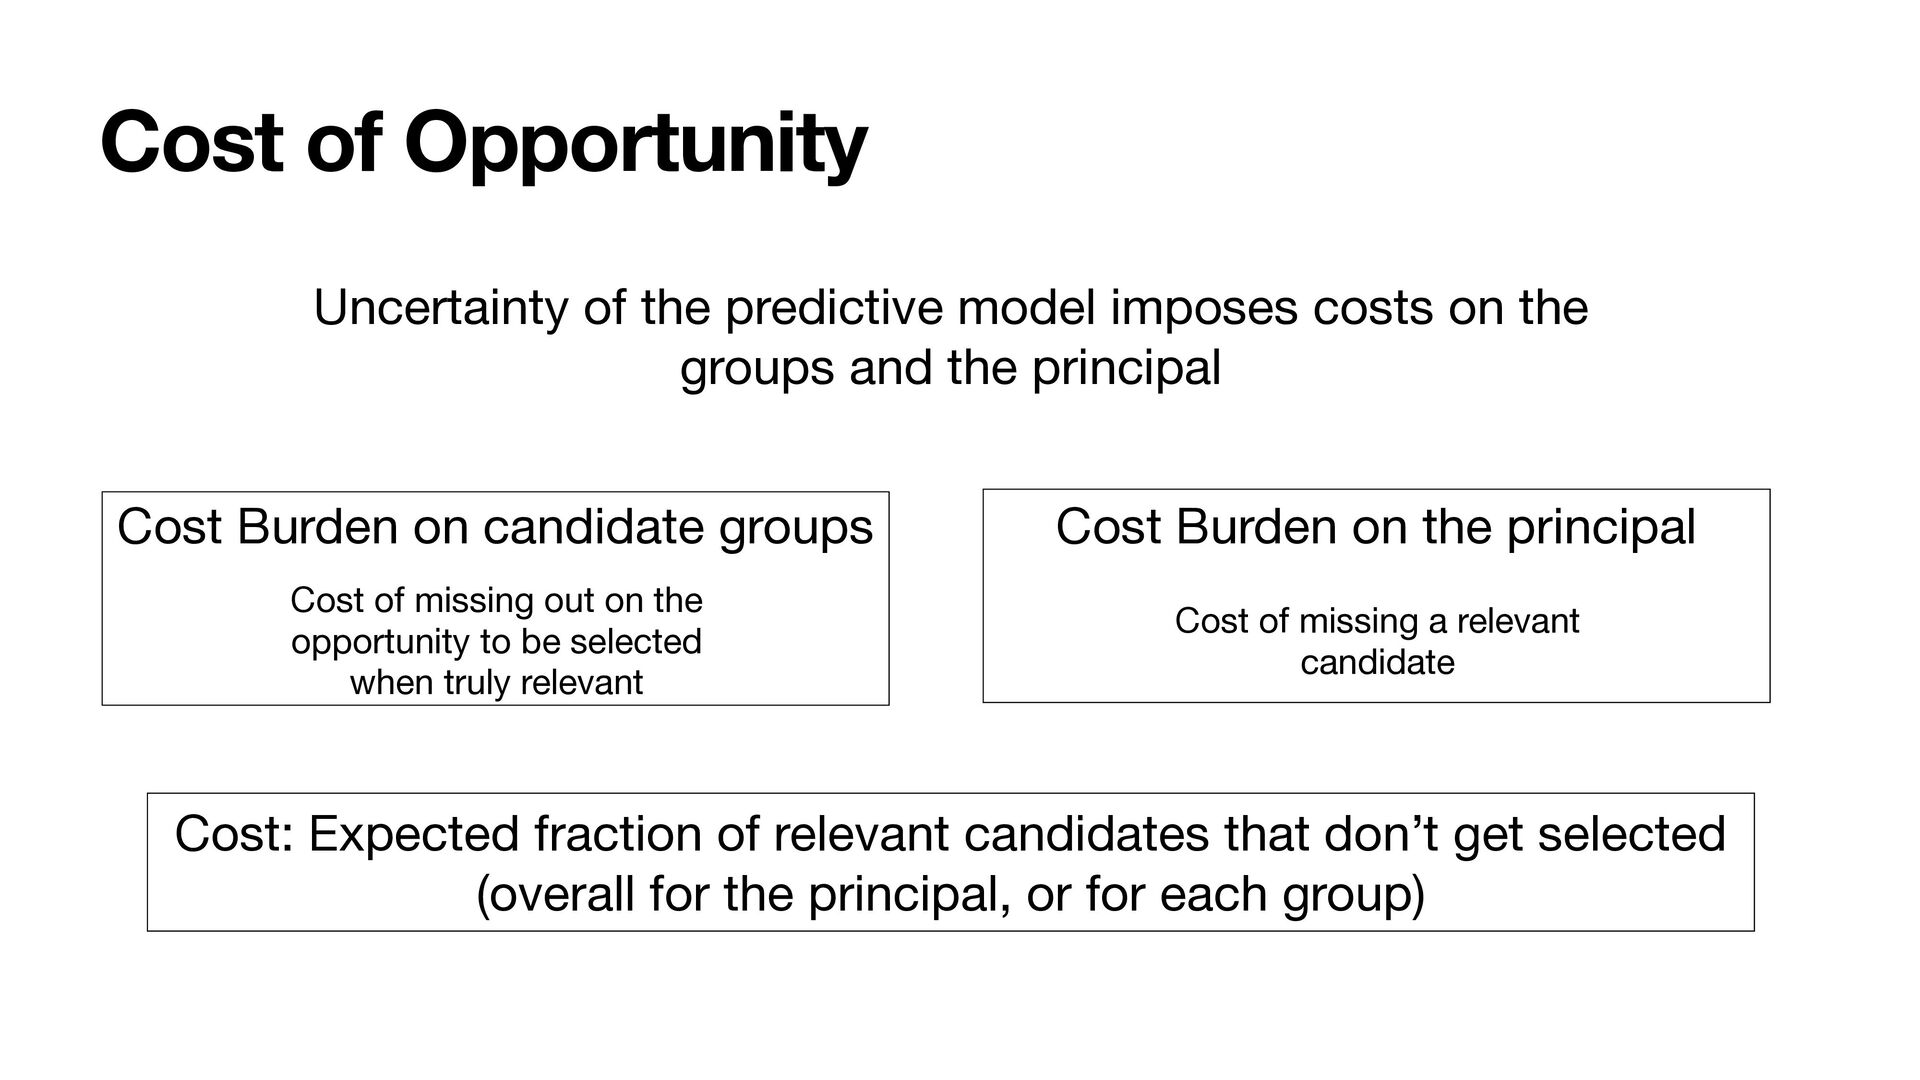
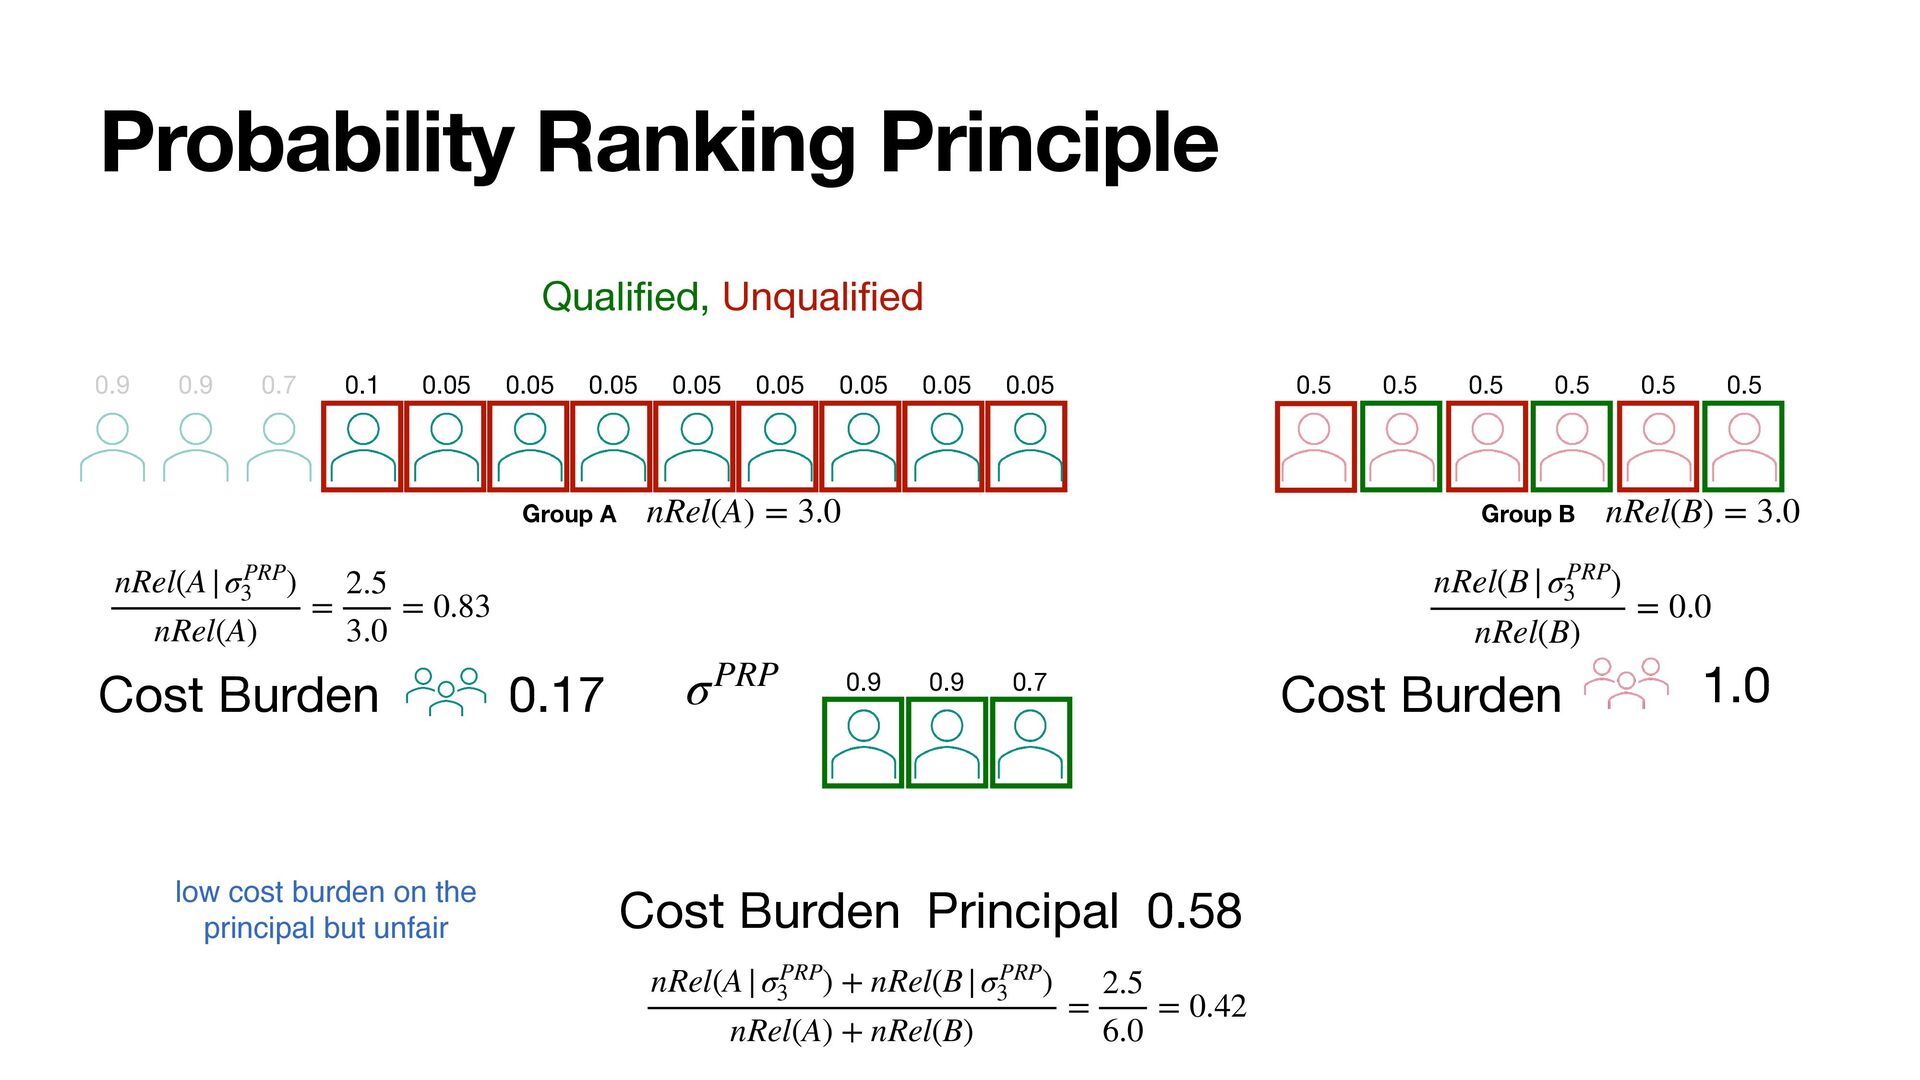
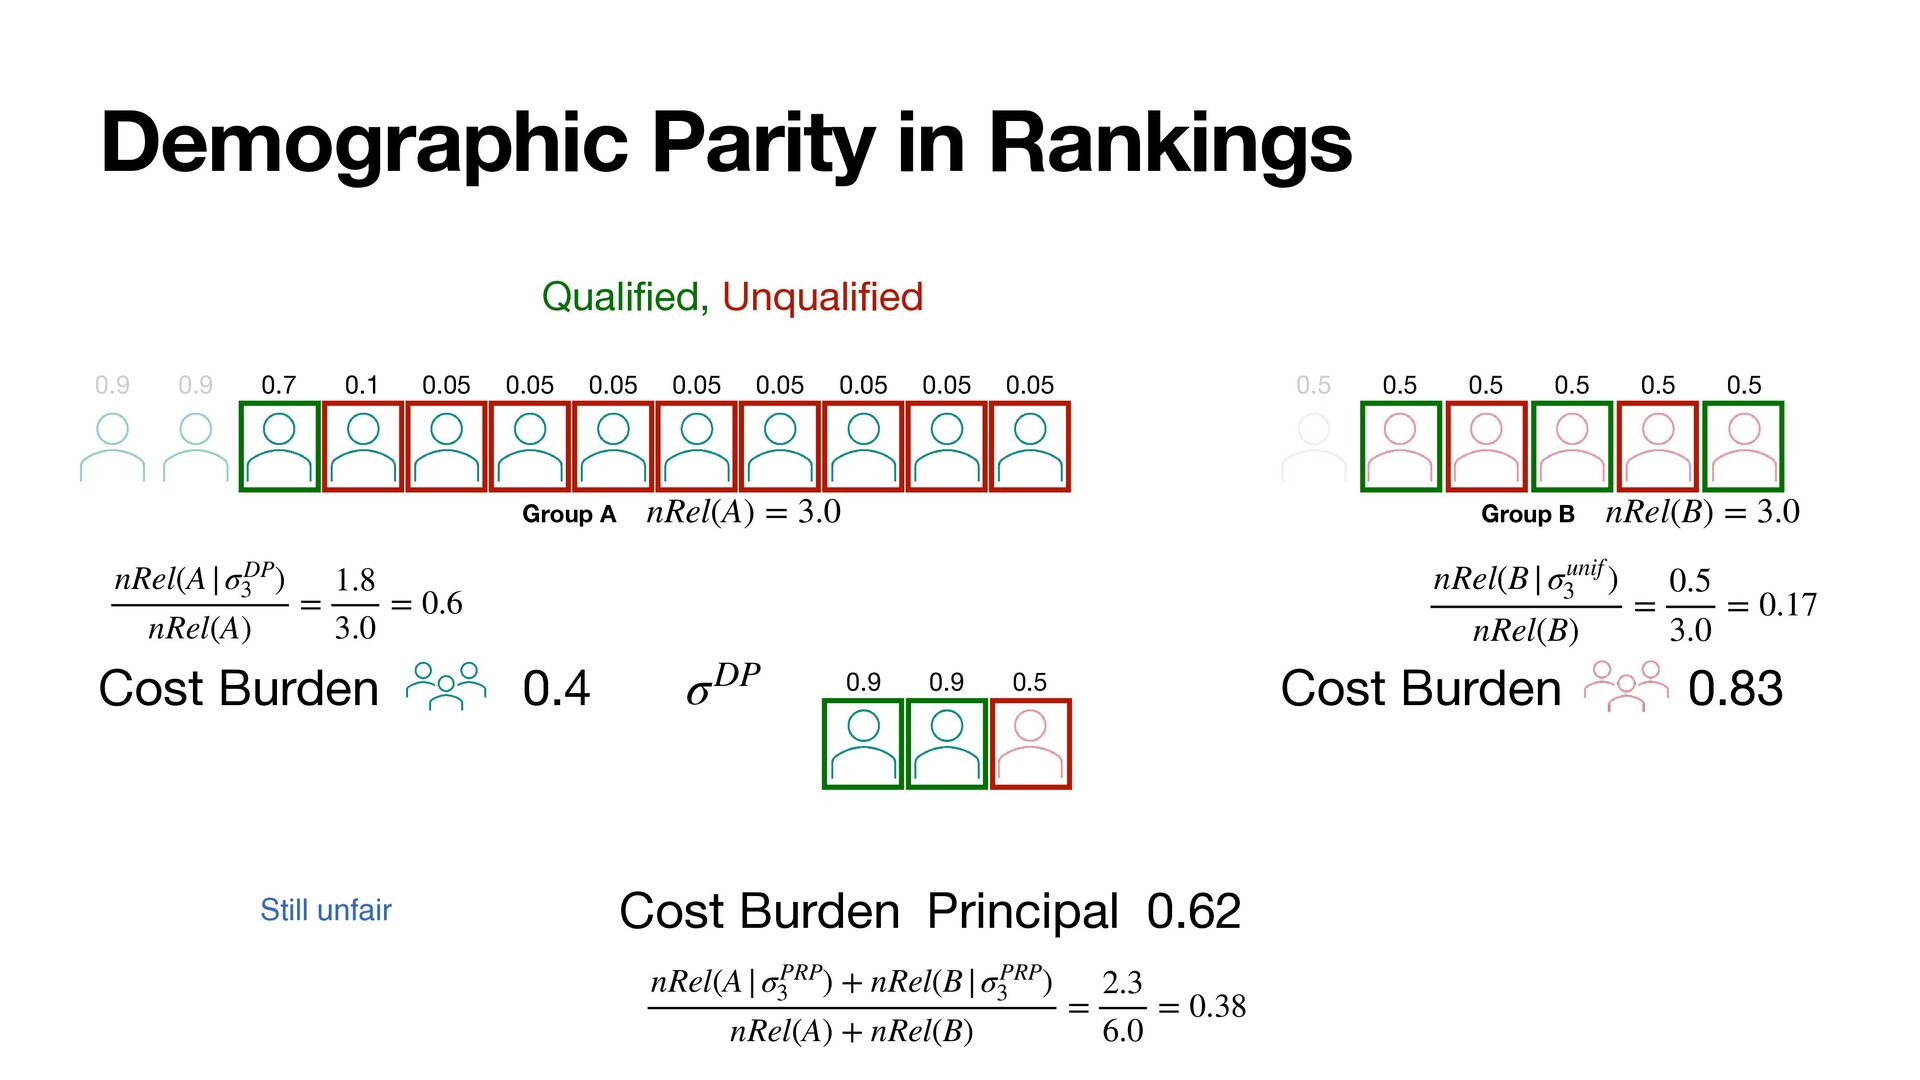
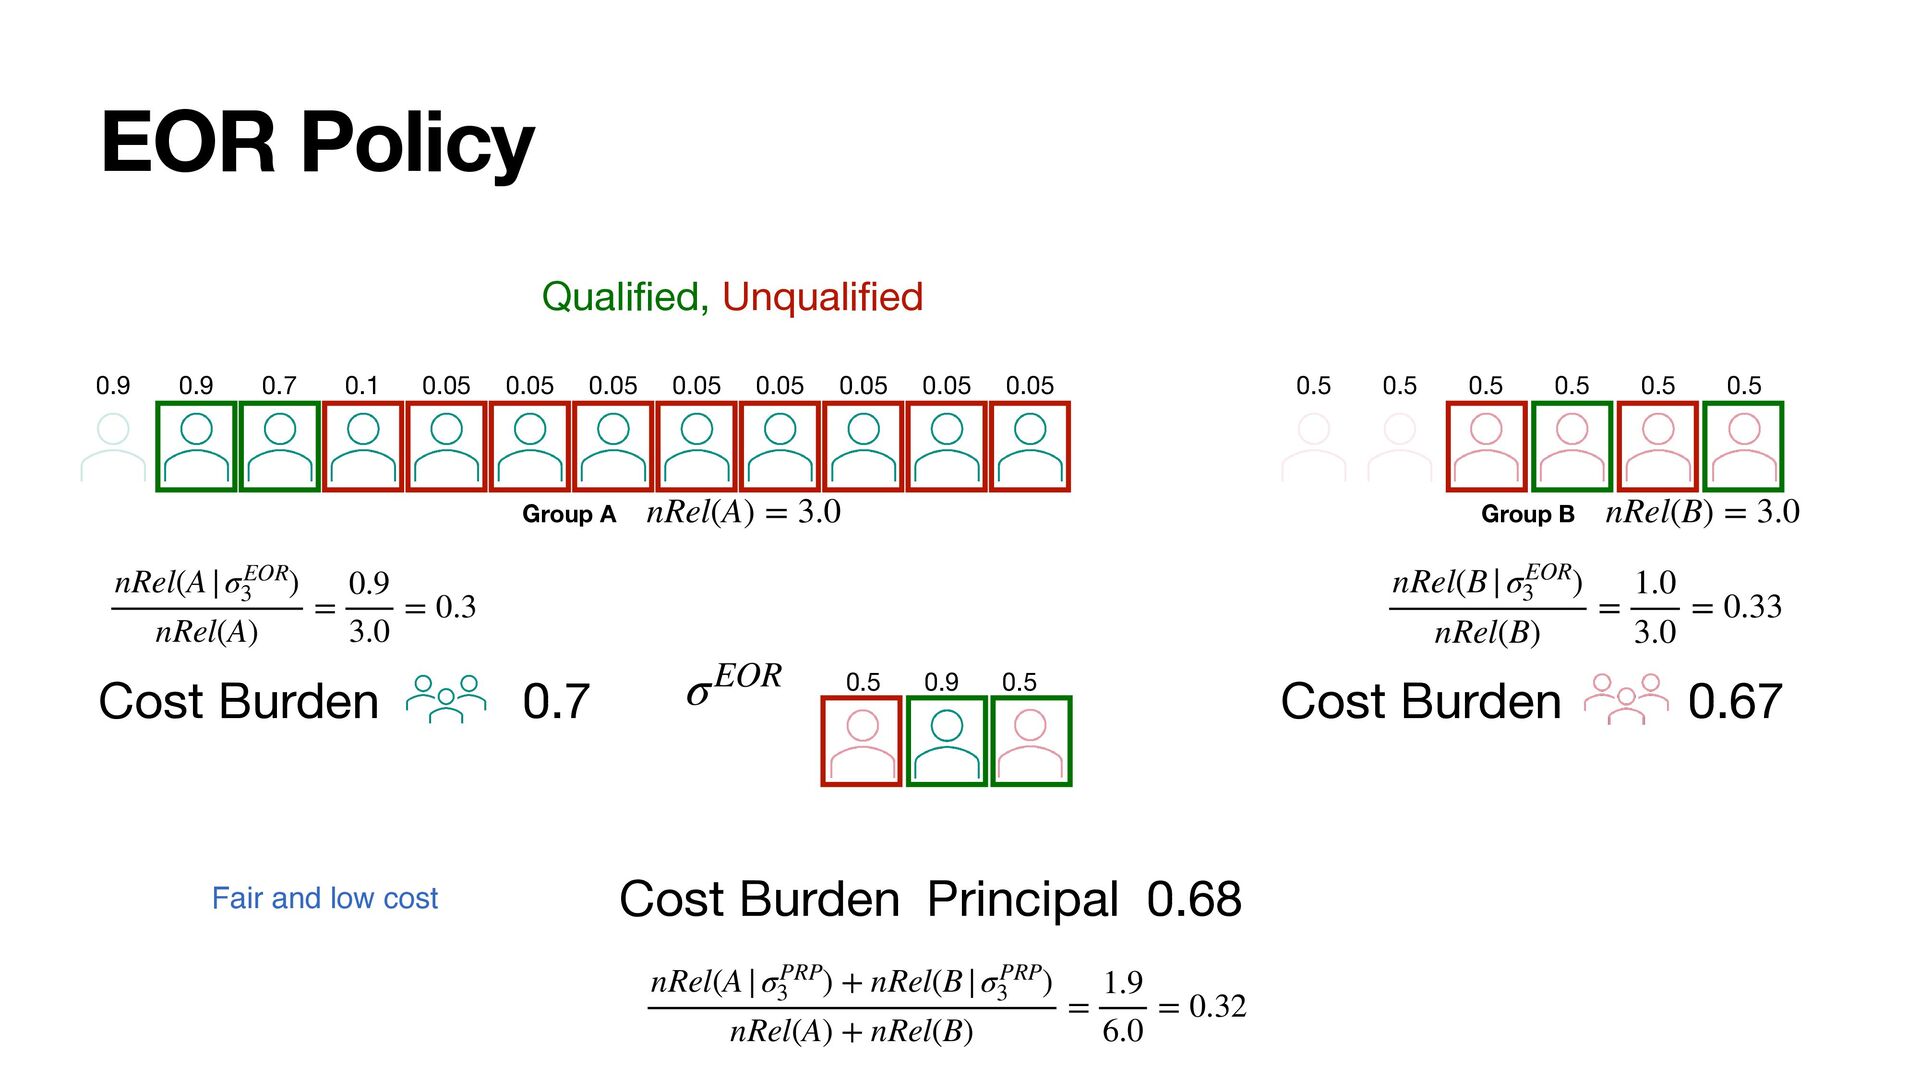
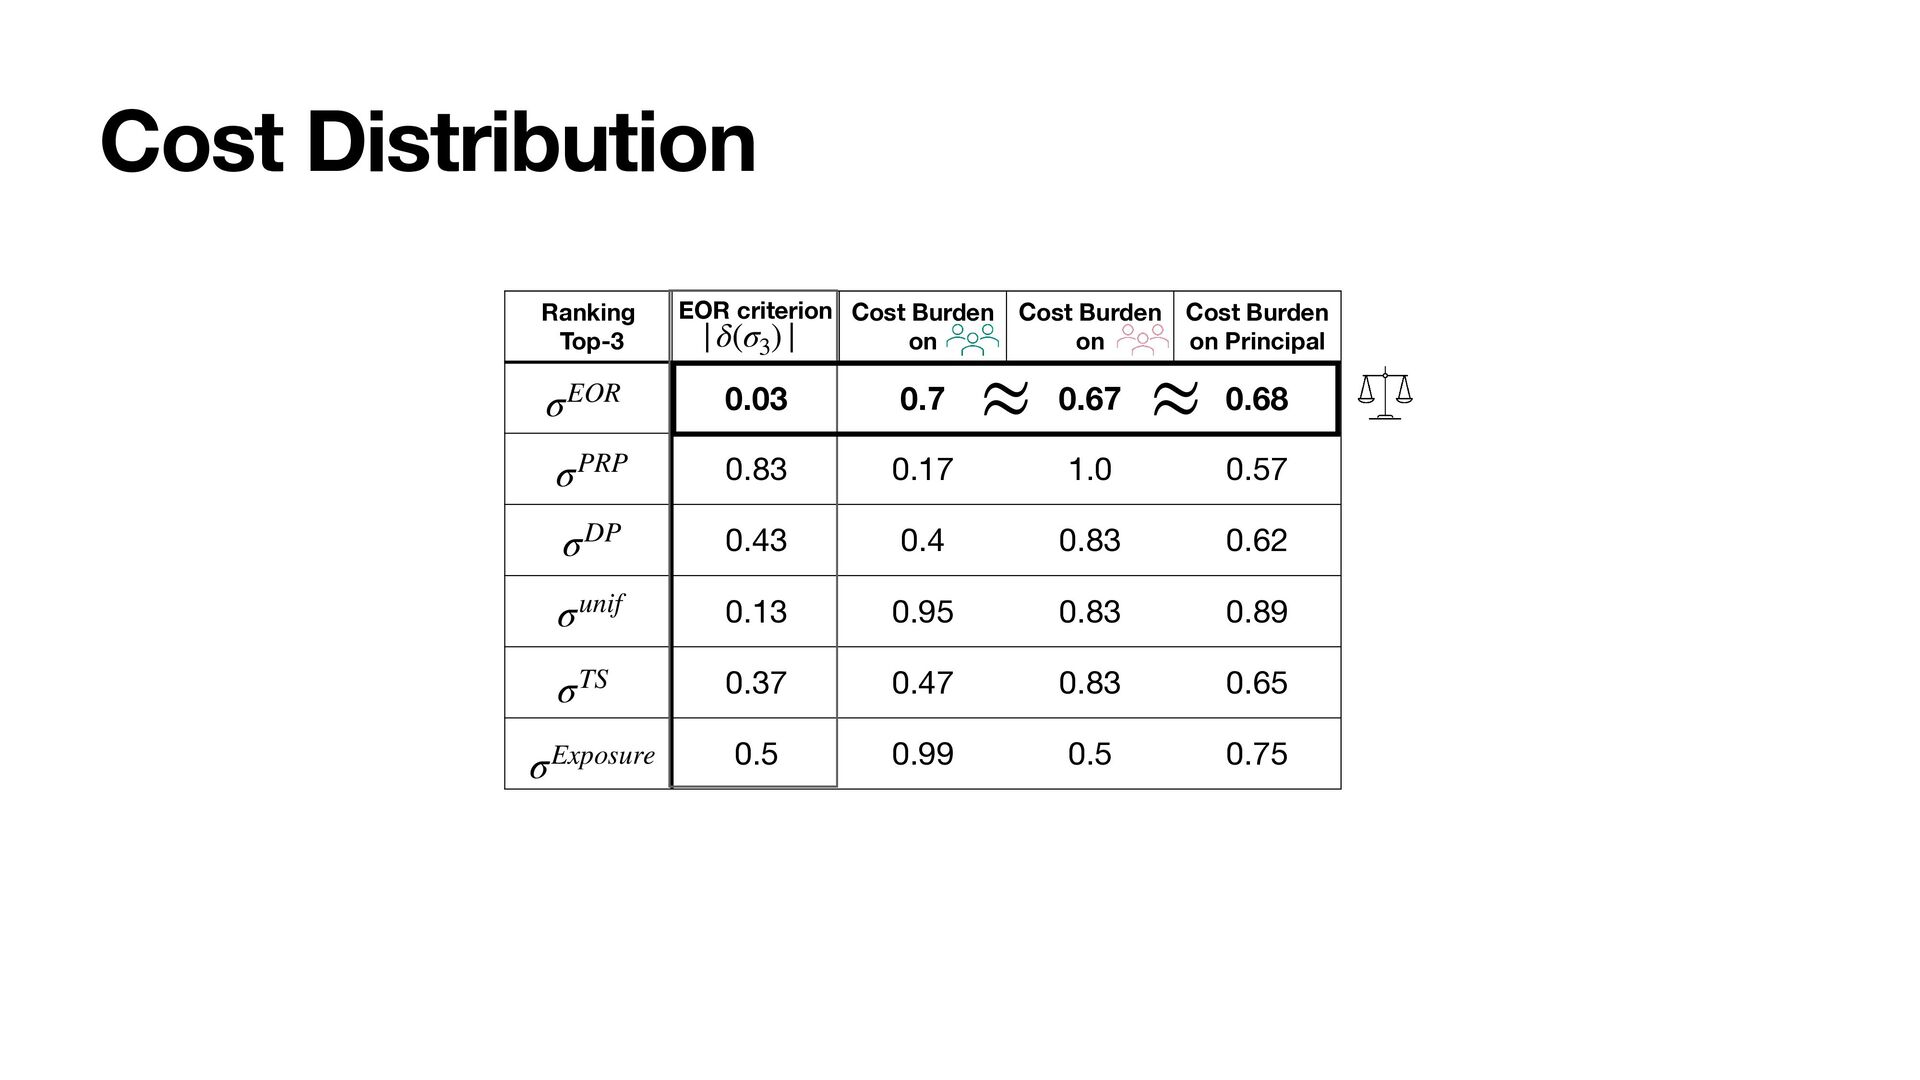
on the groups and the principal Cost Burden on candidate groups Cost of missing out on the opportunity to be selected when truly relevant Cost Burden on the principal Cost of missing a relevant candidate Cost: Expected fraction of relevant candidates that don’t get selected (overall for the principal, or for each group)
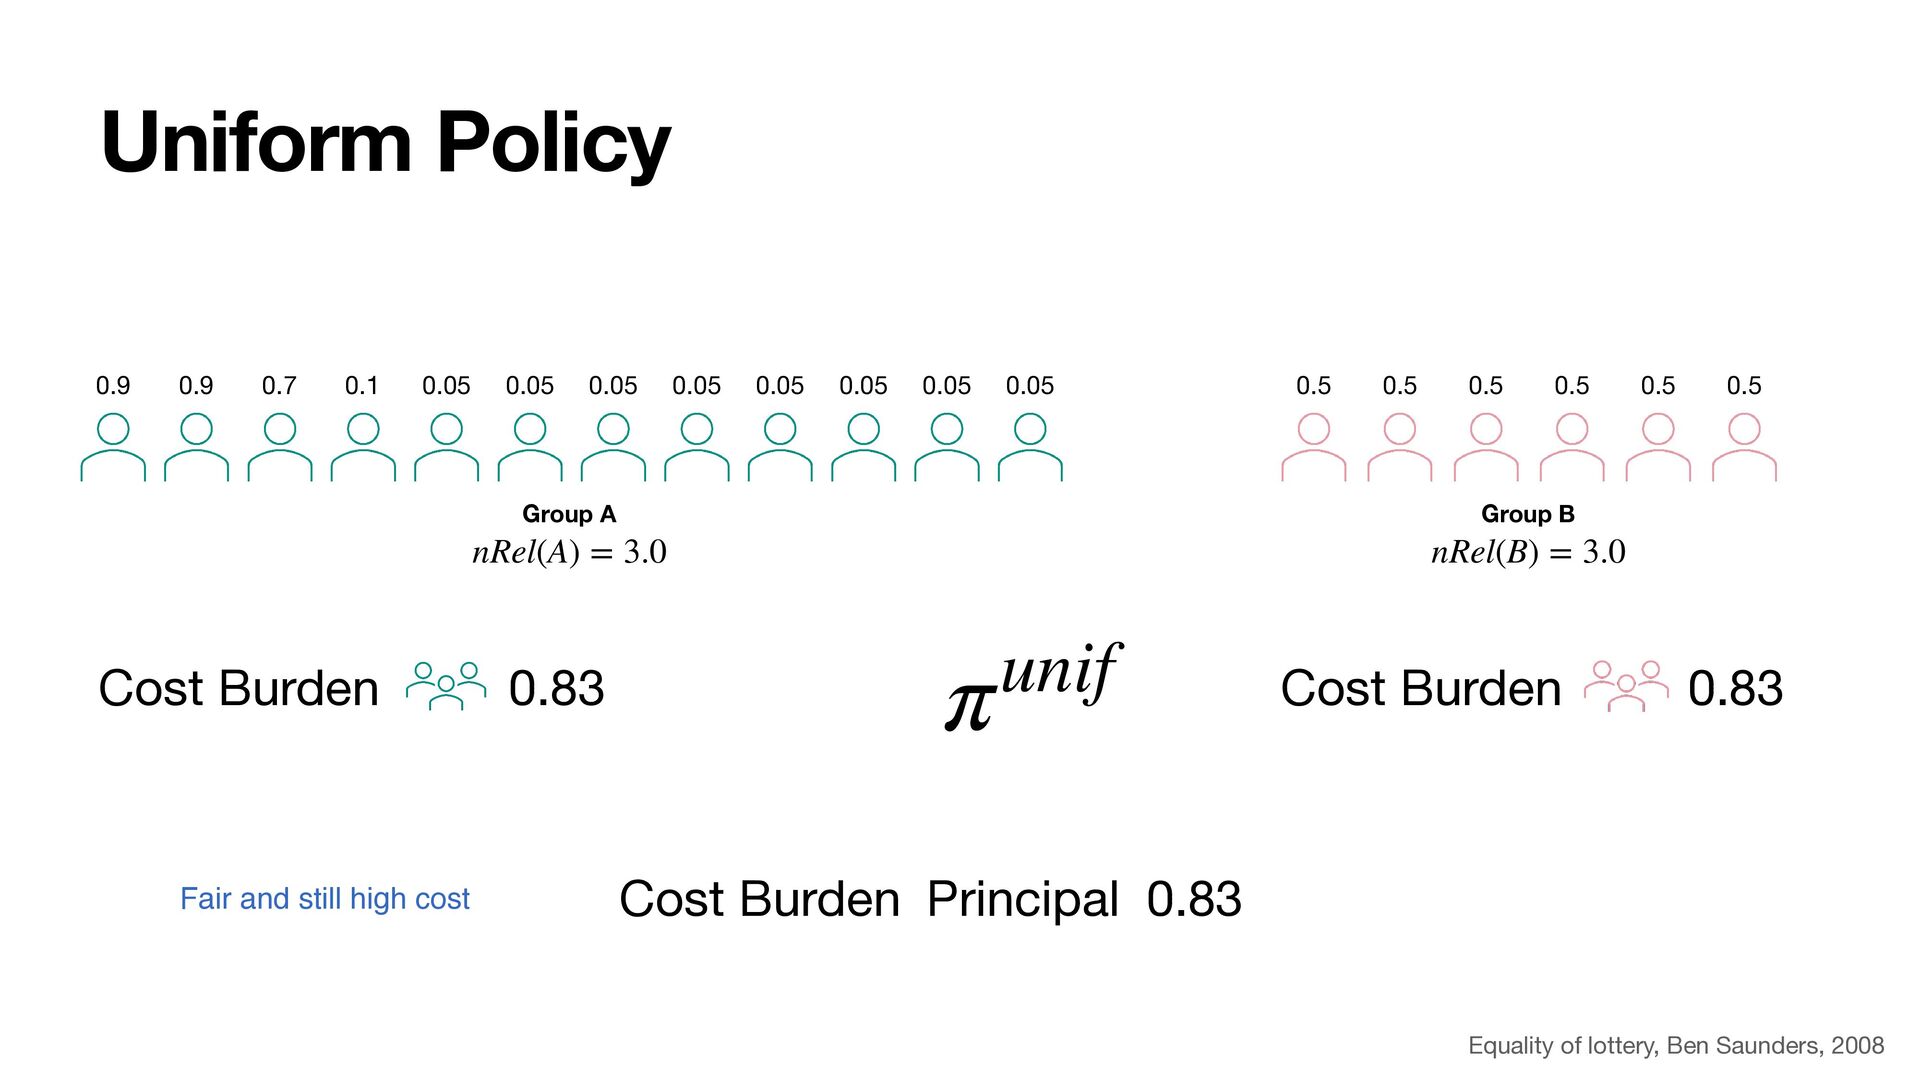
Burden 0.83 Fair and still high cost πunif 0.7 0.9 0.9 0.1 0.05 0.05 0.05 0.05 0.05 0.05 0.05 0.05 0.5 0.5 0.5 0.5 0.5 0.5 Group A Group B nRel(B) = 3.0 nRel(A) = 3.0 Equality of lottery, Ben Saunders, 2008
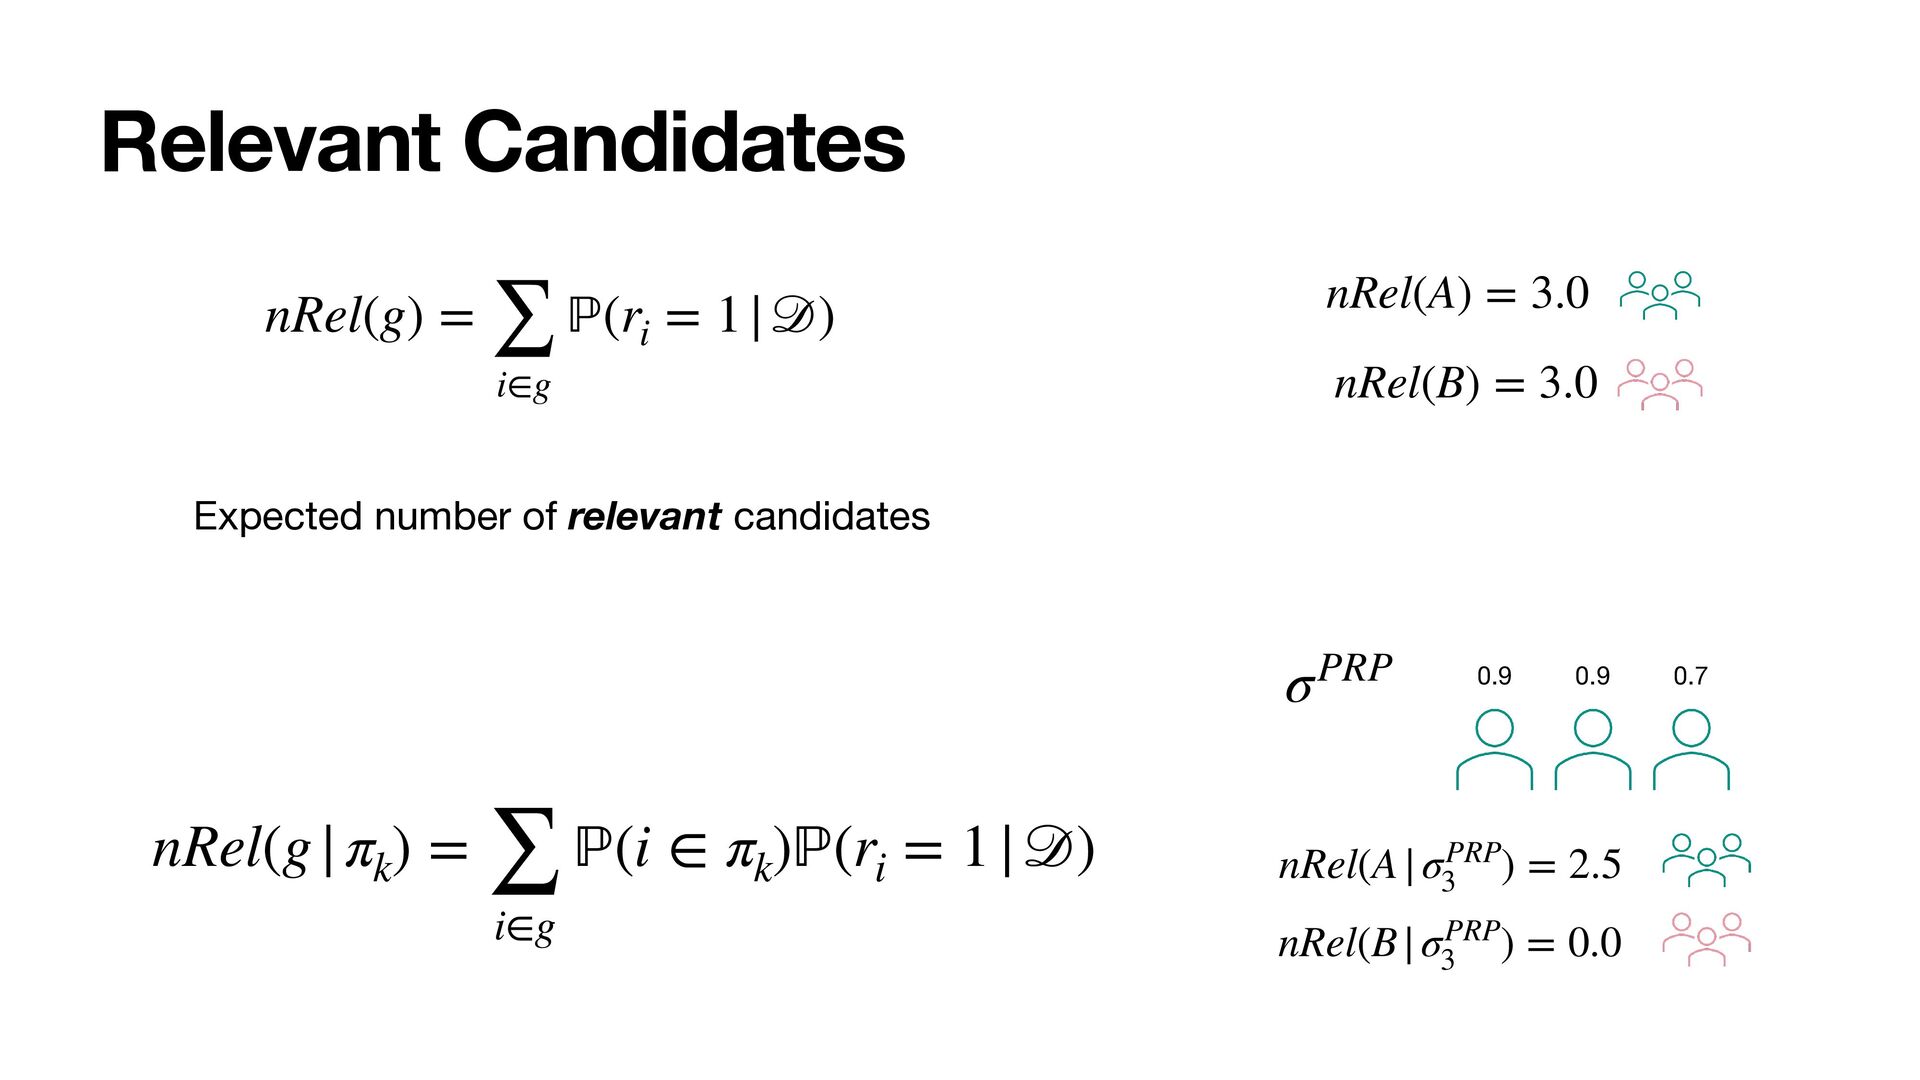
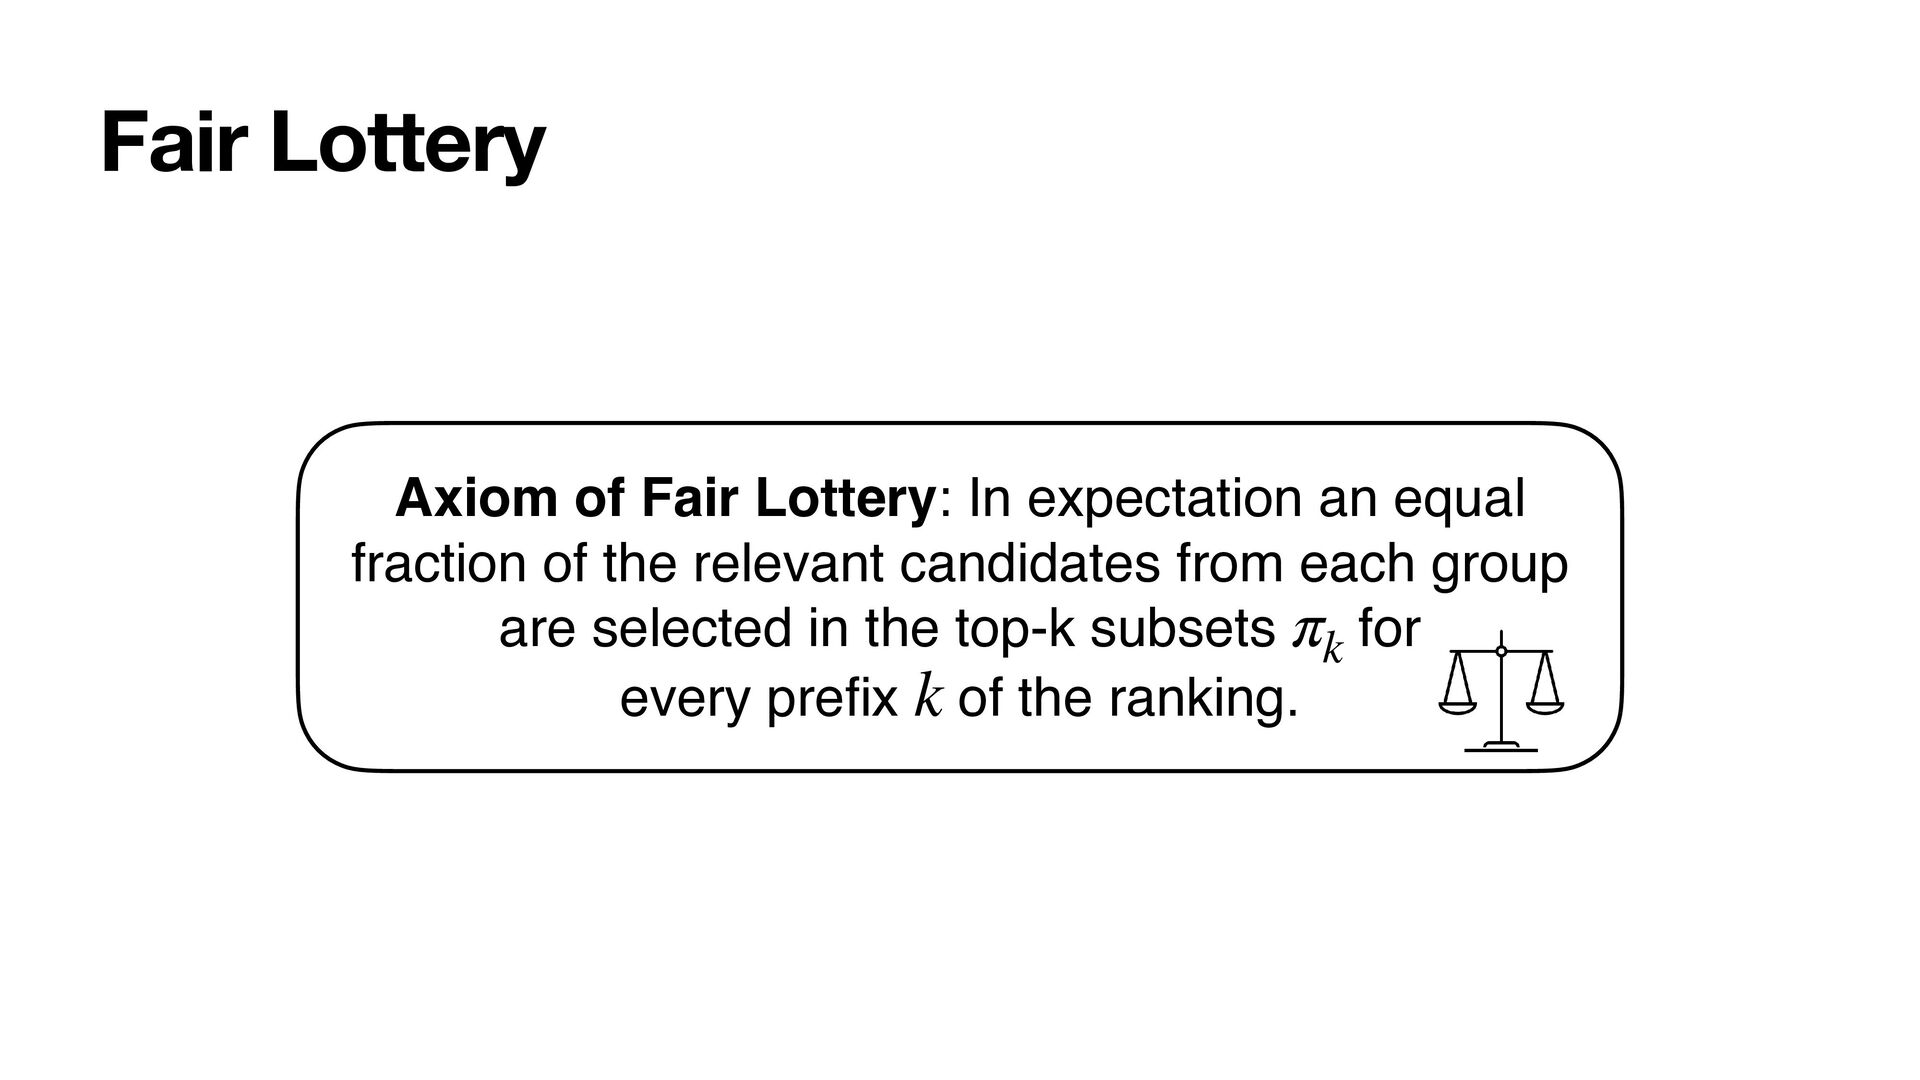
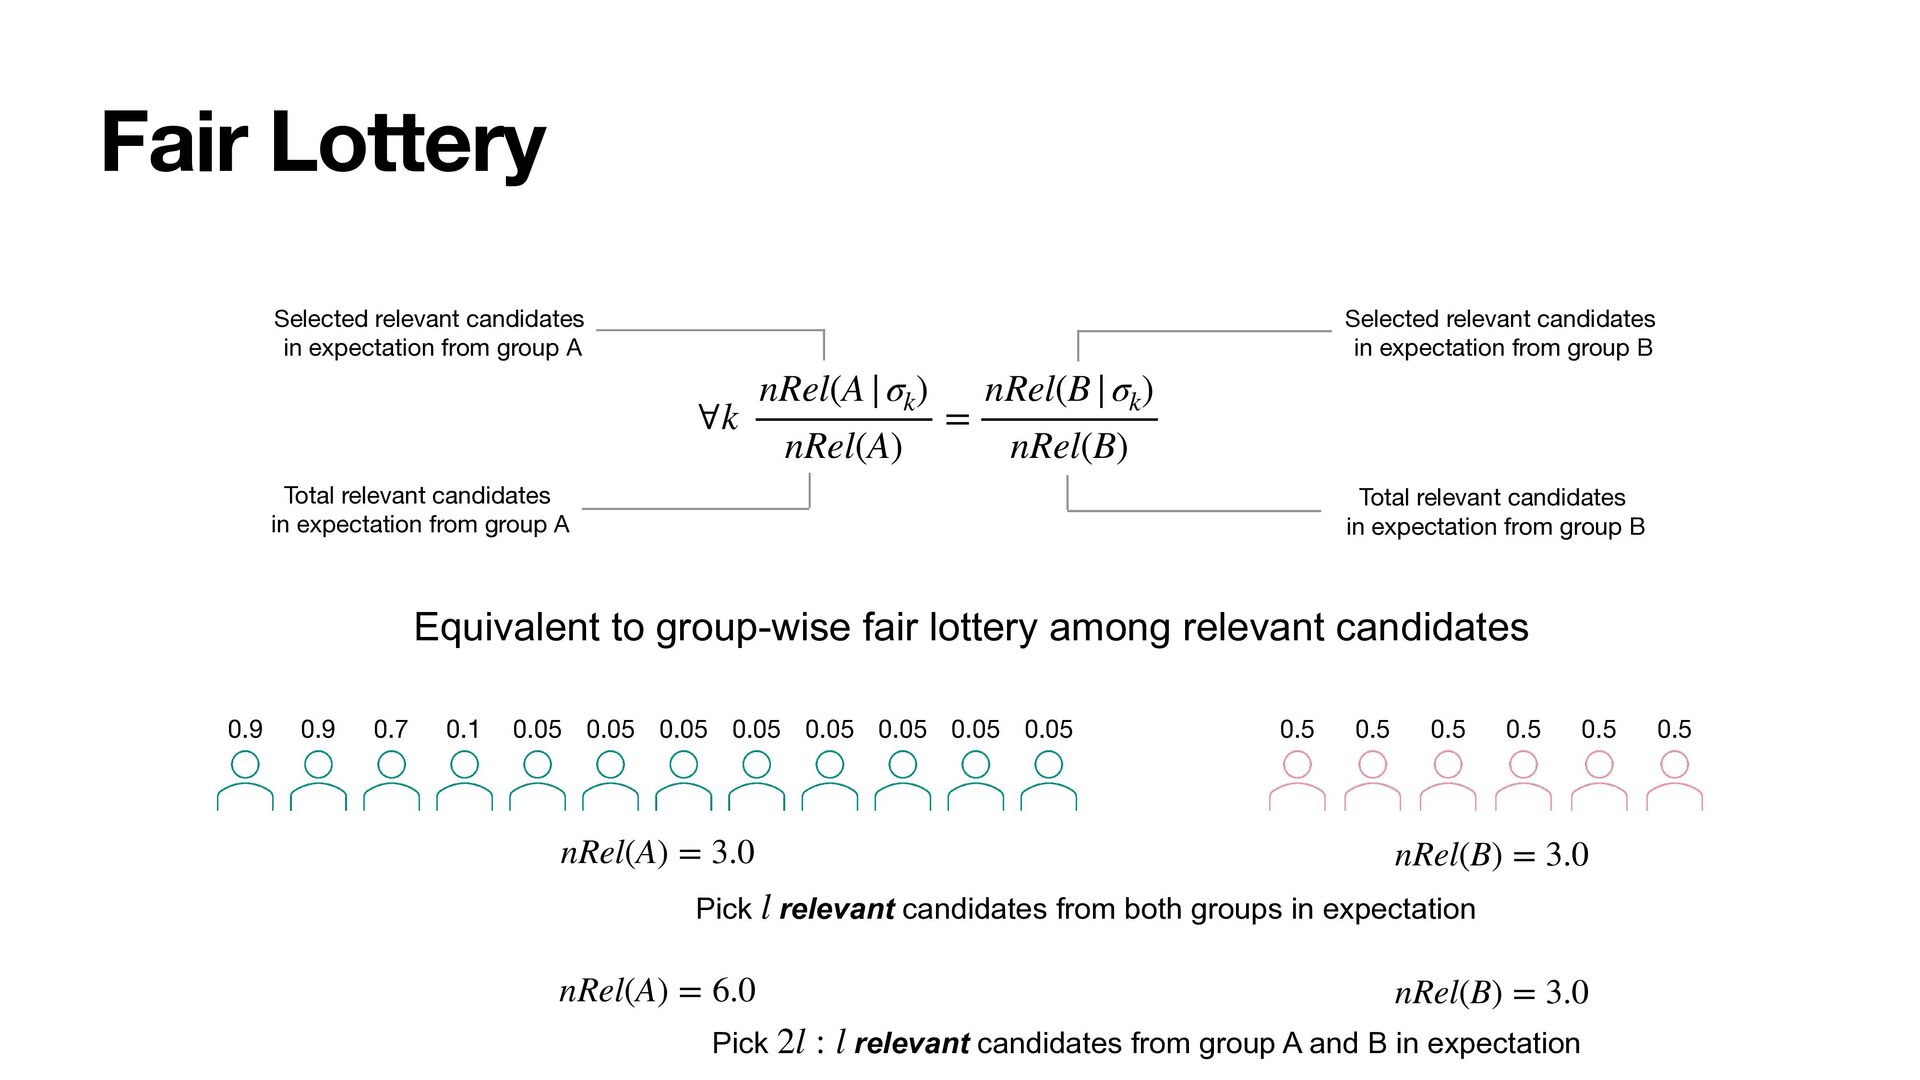
Selected relevant candidates in expectation from group A Selected relevant candidates in expectation from group B Total relevant candidates in expectation from group A Total relevant candidates in expectation from group B Equivalent to group-wise fair lottery among relevant candidates nRel(B) = 3.0 nRel(A) = 3.0 Pick relevant candidates from both groups in expectation l nRel(B) = 3.0 nRel(A) = 6.0 Pick relevant candidates from group A and B in expectation 2l : l 0.7 0.9 0.9 0.1 0.05 0.05 0.05 0.05 0.05 0.05 0.05 0.05 0.5 0.5 0.5 0.5 0.5 0.5
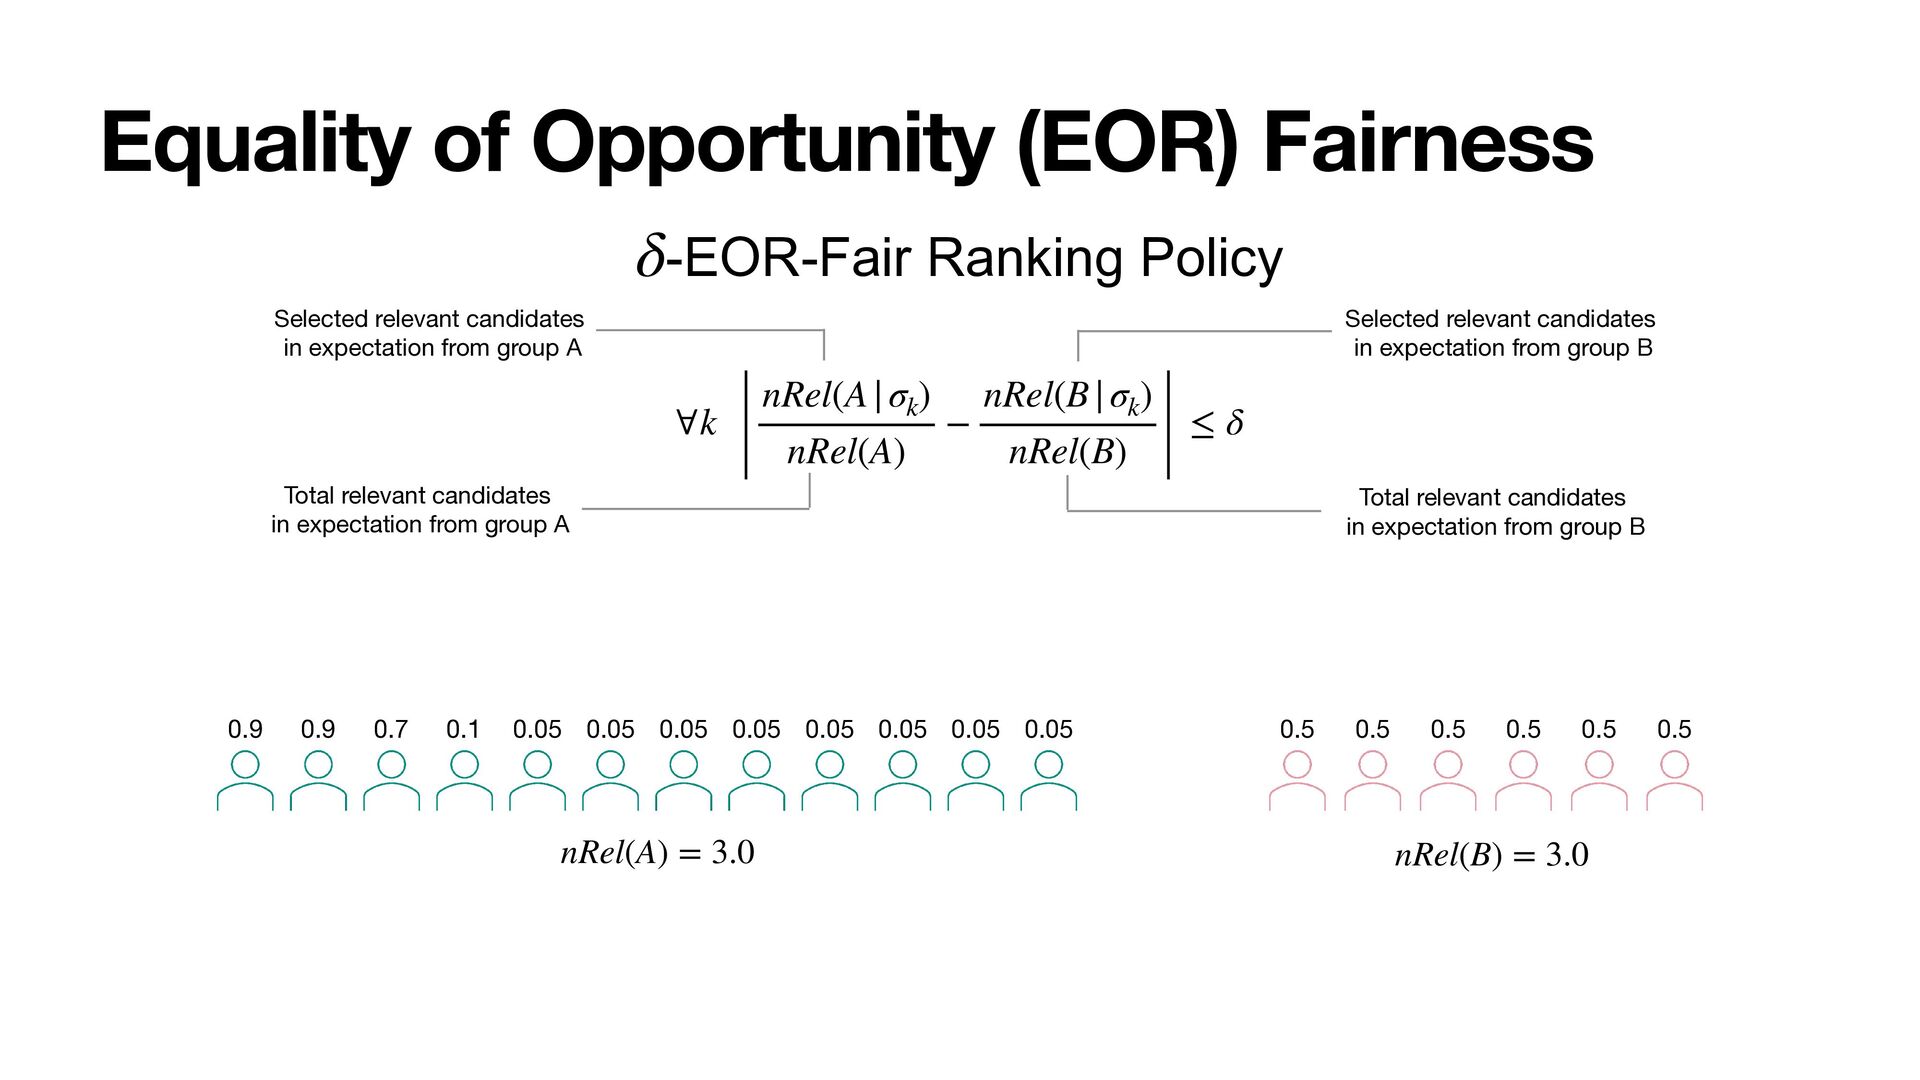
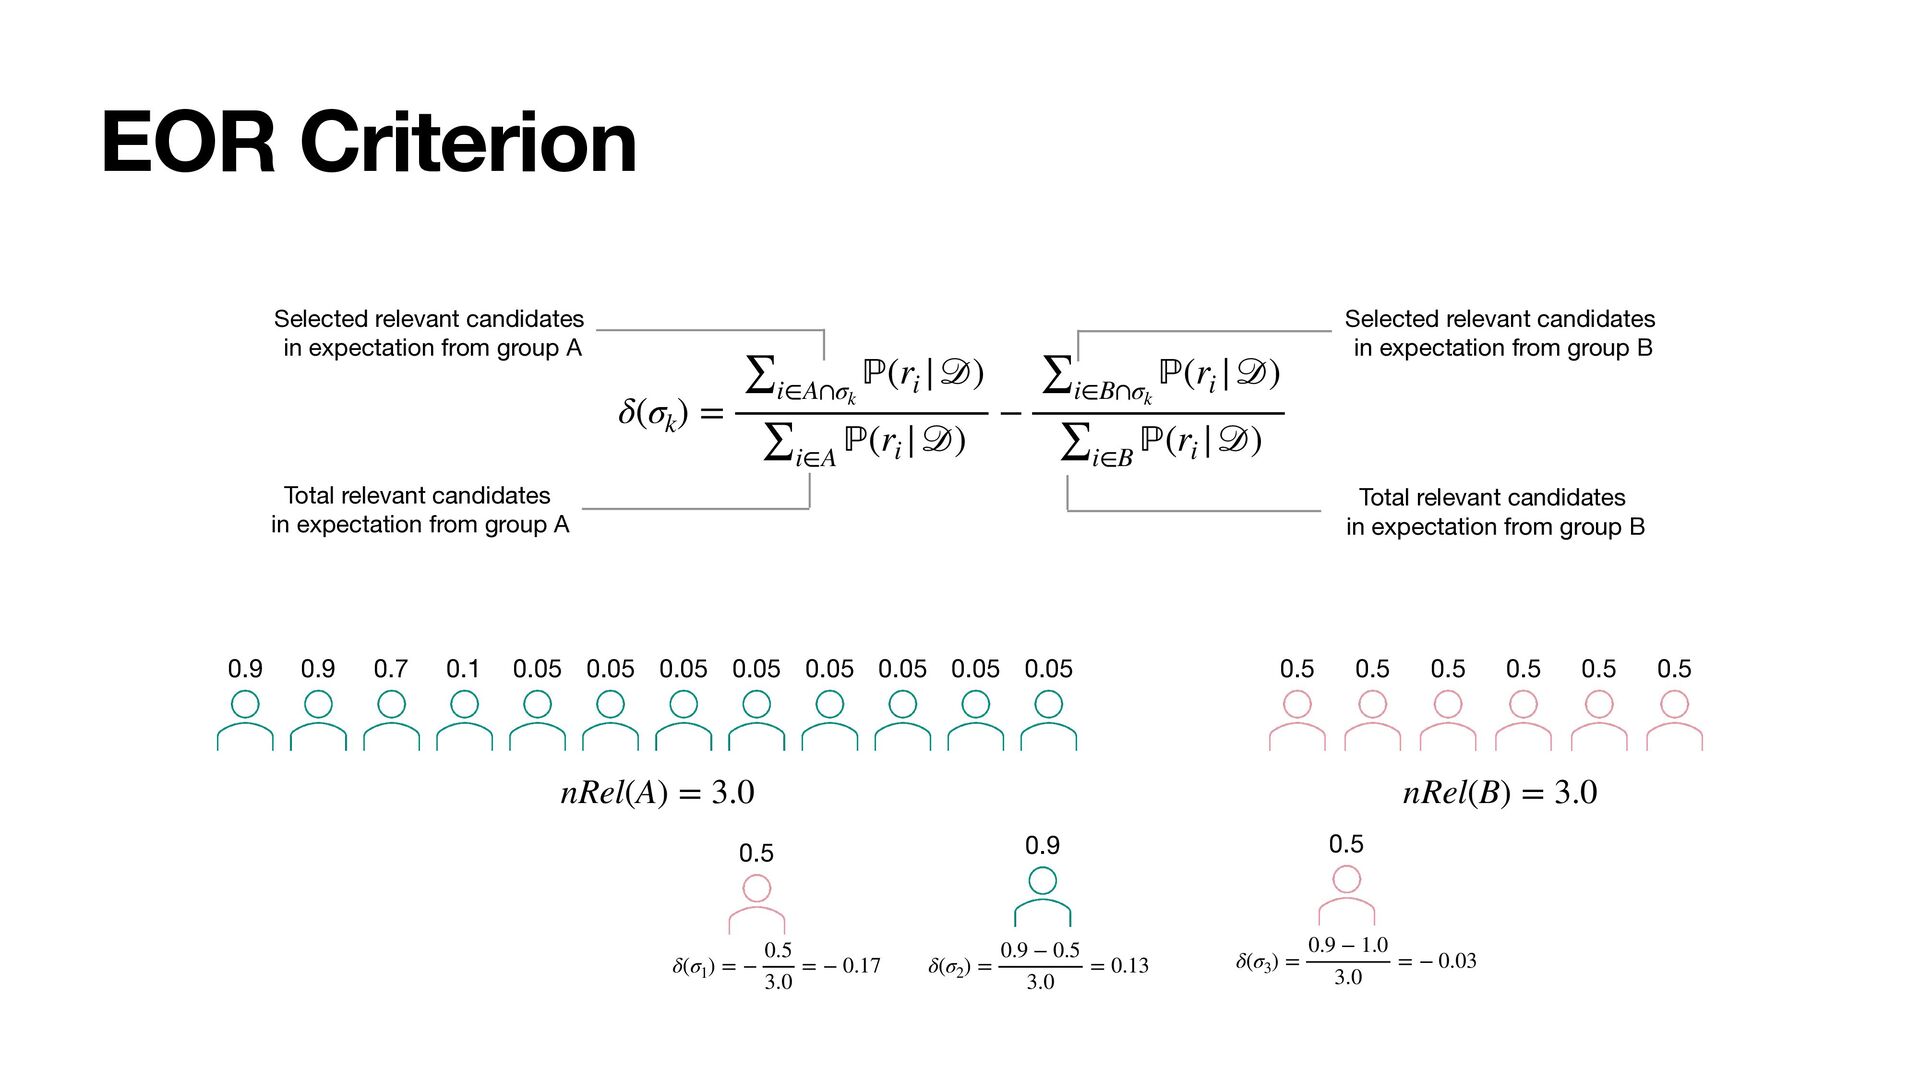
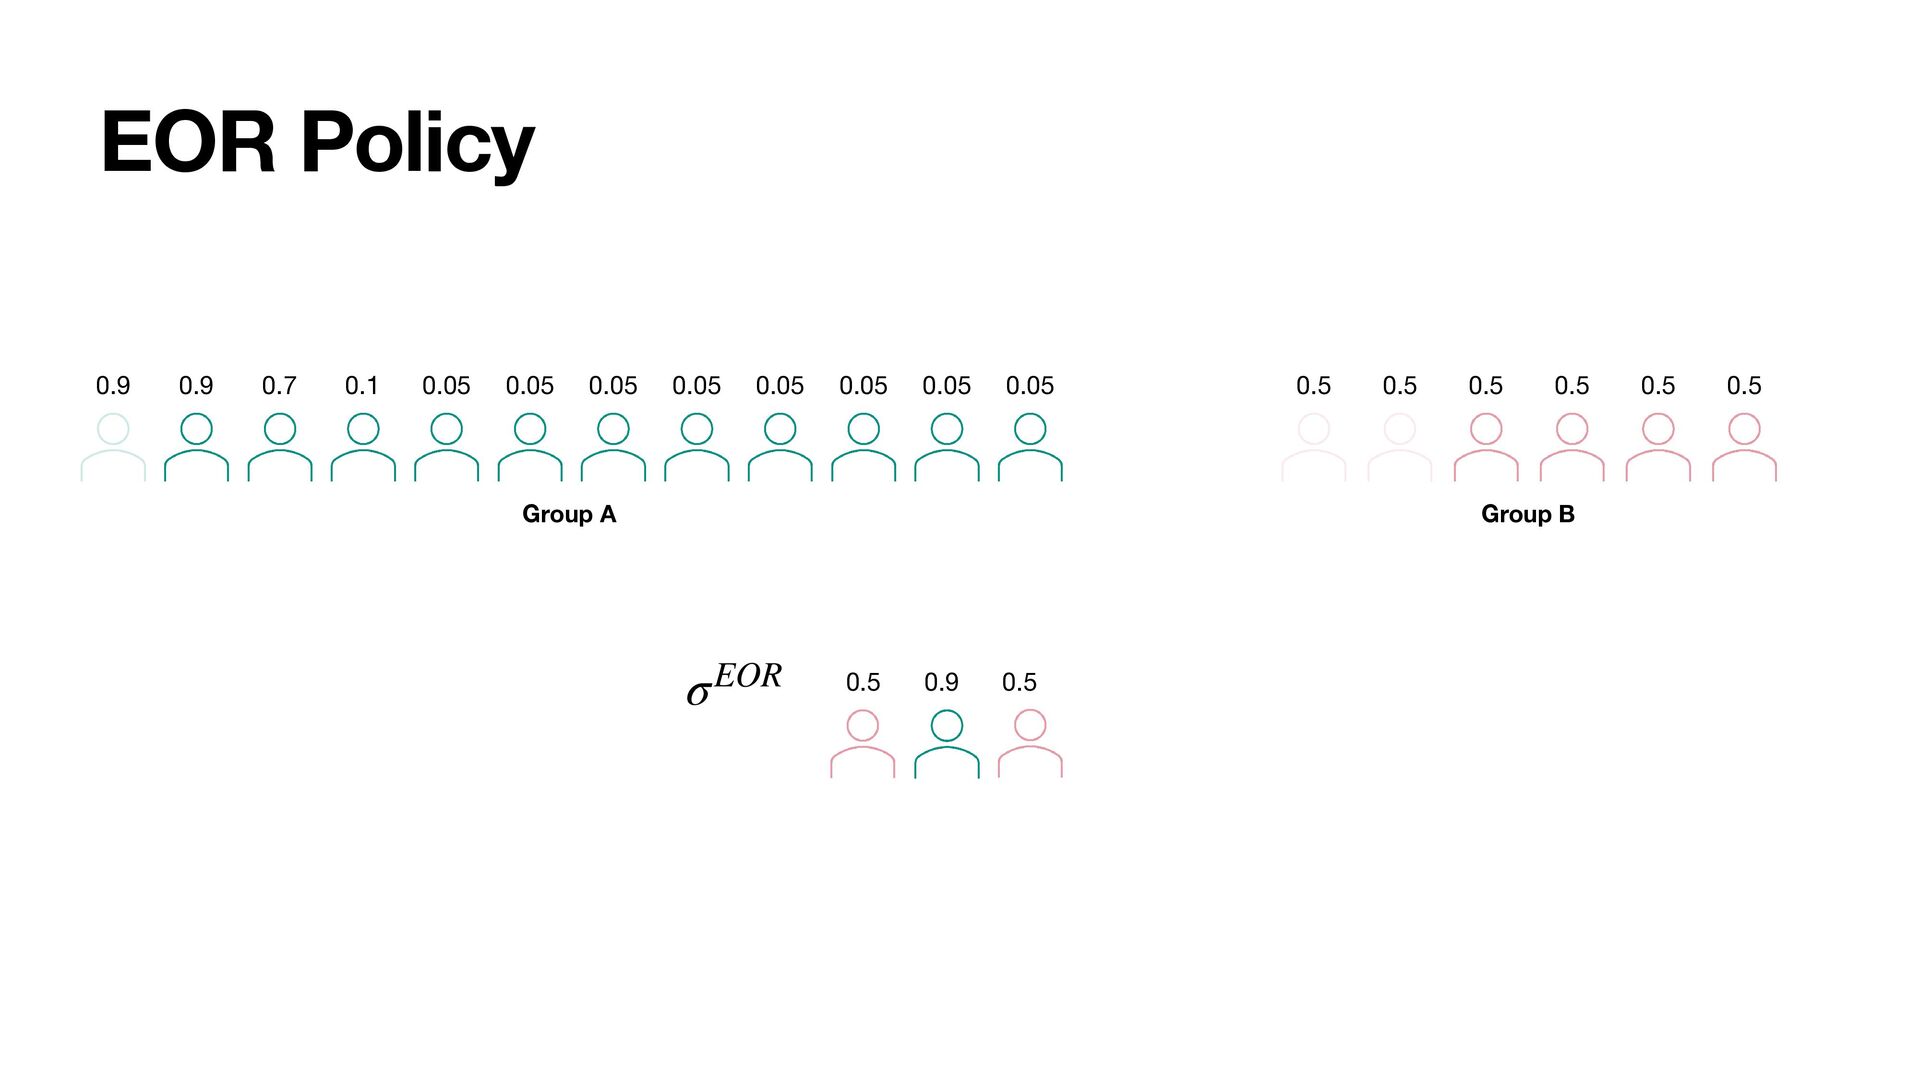
from group A Selected relevant candidates in expectation from group B Total relevant candidates in expectation from group A Total relevant candidates in expectation from group B nRel(B) = 3.0 nRel(A) = 3.0 0.7 0.9 0.9 0.1 0.05 0.05 0.05 0.05 0.05 0.05 0.05 0.05 0.5 0.5 0.5 0.5 0.5 0.5 -EOR-Fair Ranking Policy δ ∀k nRel(A|σk ) nRel(A) − nRel(B|σk ) nRel(B) ≤ δ
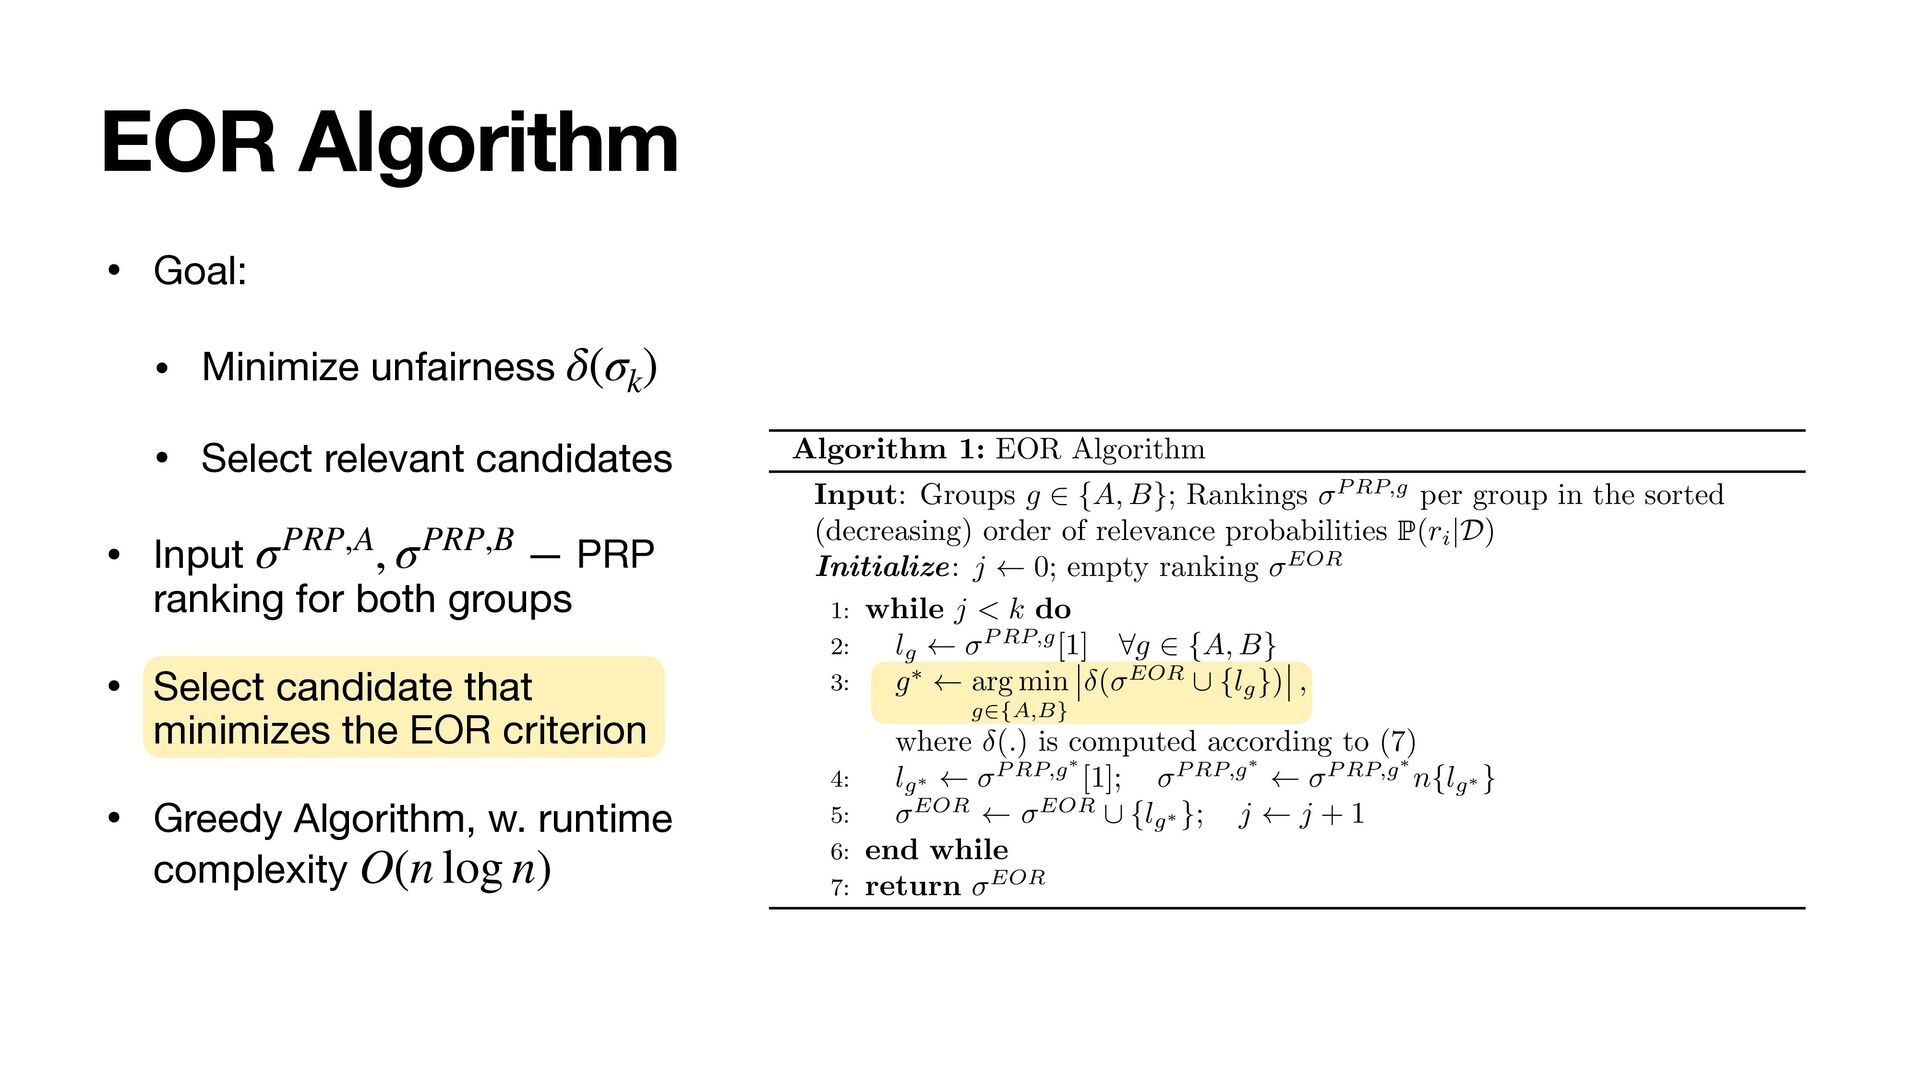
{A, B}; Rankings P RP,g per group in the sorted (decreasing) order of relevance probabilities P(r i |D) Initialize: j 0; empty ranking EOR 1: while j < k do 2: l g P RP,g[1] 8g 2 {A, B} 3: g⇤ arg min g2{A,B} ( EOR [ {l g }) , where (.) is computed according to (7) 4: l g⇤ P RP,g ⇤ [1]; P RP,g ⇤ P RP,g ⇤ n{l g⇤ } 5: EOR EOR [ {l g⇤ }; j j + 1 6: end while 7: return EOR • Goal: • Minimize unfairness • Select relevant candidates • Input — PRP ranking for both groups • Select candidate that minimizes the EOR criterion • Greedy Algorithm, w. runtime complexity δ(σk ) σPRP,A, σPRP,B O(n log n)
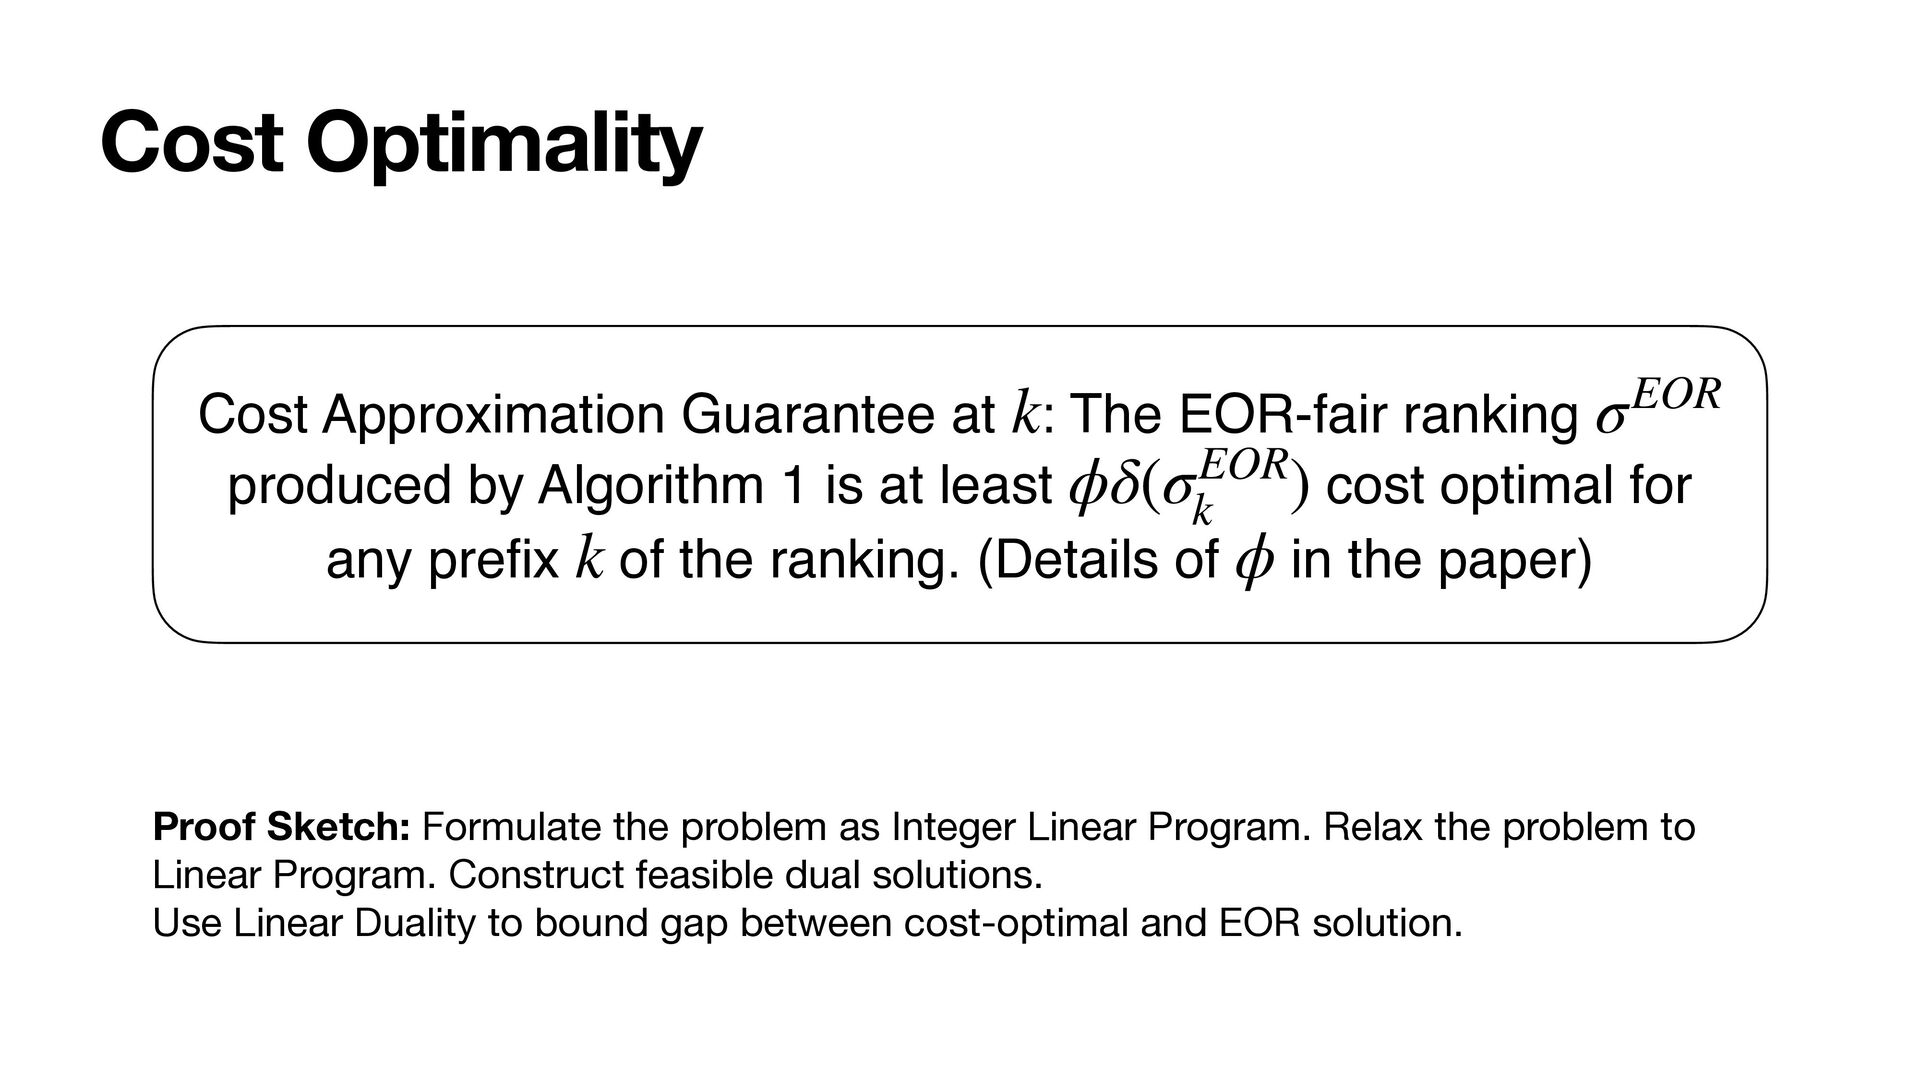
produced by Algorithm 1 is at least cost optimal for any pre fi x of the ranking. (Details of in the paper) k σEOR ϕδ(σEOR k ) k ϕ Proof Sketch: Formulate the problem as Integer Linear Program. Relax the problem to Linear Program. Construct feasible dual solutions. Use Linear Duality to bound gap between cost-optimal and EOR solution.
EOR is equivalent to group-fair lottery among the relevant candidates • Distributes more even cost burden on all stakeholders and provides effective rankings, even when true relevance labels are unknown • An approximation guarantee for cost optimality of EOR rankings to the decision maker • Checkout our paper for more !