Upgrade to Pro — share decks privately, control downloads, hide ads and more …

Sizing, Benchmarking and Performance Tuning Apa...

Sponsored · Ship Features Fearlessly Turn features on and off without deploys. Used by thousands of Ruby developers. →

Sizing, Benchmarking and Performance Tuning Apache Flink Clusters

A common question when adopting Apache Flink is about sizing the workload: How many CPUs, how much memory will Flink require for a particular use-case? What throughput and latency can you expect given your hardware?

We’ll kick off this talk discussing why these questions are extremely difficult to answer for a generic stream processing framework like Flink. But we won’t stop there. The best approach to answer sizing questions is to benchmark your Flink workload. We will present how we’ve set up a Flink SQL-based benchmarking environment and some benchmarking results for attendees to correlate our results with their workloads to approximate their resource requirements.

Naturally when benchmarking, the topic of performance tuning comes up: Are you optimally using the allocated resources? How to identify performance bottlenecks? What are the most common performance issues, and how to resolve them? In our case, a few configuration drastically improved the performance. How many CPU cores are needed for that in Flink? Attend the talk to find out, less than you would expect.

This talk is for both Flink beginners wanting to get an idea about Flink’s performance and operational behavior, as well as for advanced users looking for best practices to improve performance and efficiency.

Avatar for Robert Metzger

Robert Metzger

November 05, 2026

More Decks by Robert Metzger

Other Decks in Technology

Transcript

  1. Sizing, Benchmarking and Performance Tuning Apache Flink Clusters Robert Metzger

    Principal Software Engineer @ Confluent Committer and PMC @ Apache Flink
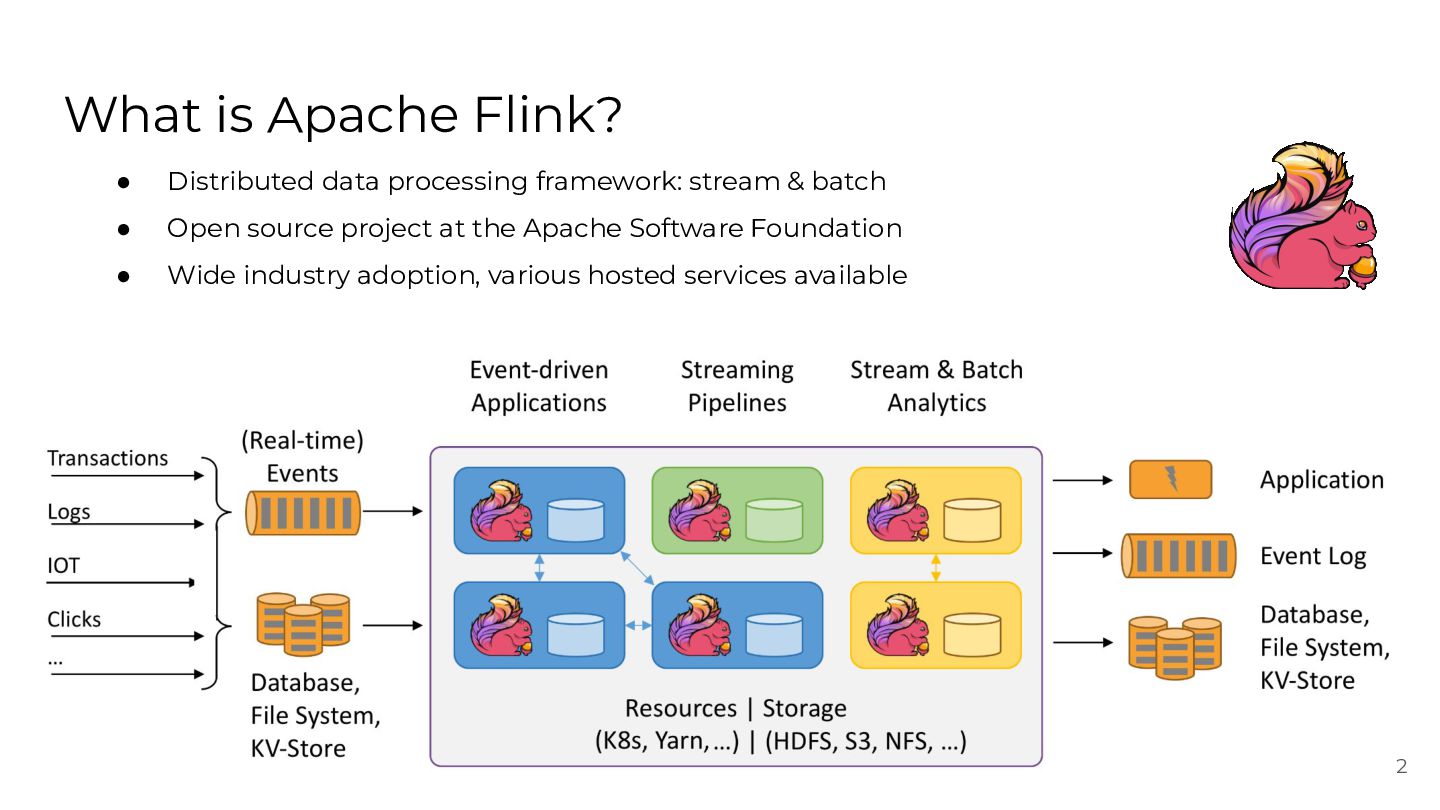
  2. What is Apache Flink? • Distributed data processing framework: stream

    & batch • Open source project at the Apache Software Foundation • Wide industry adoption, various hosted services available 2
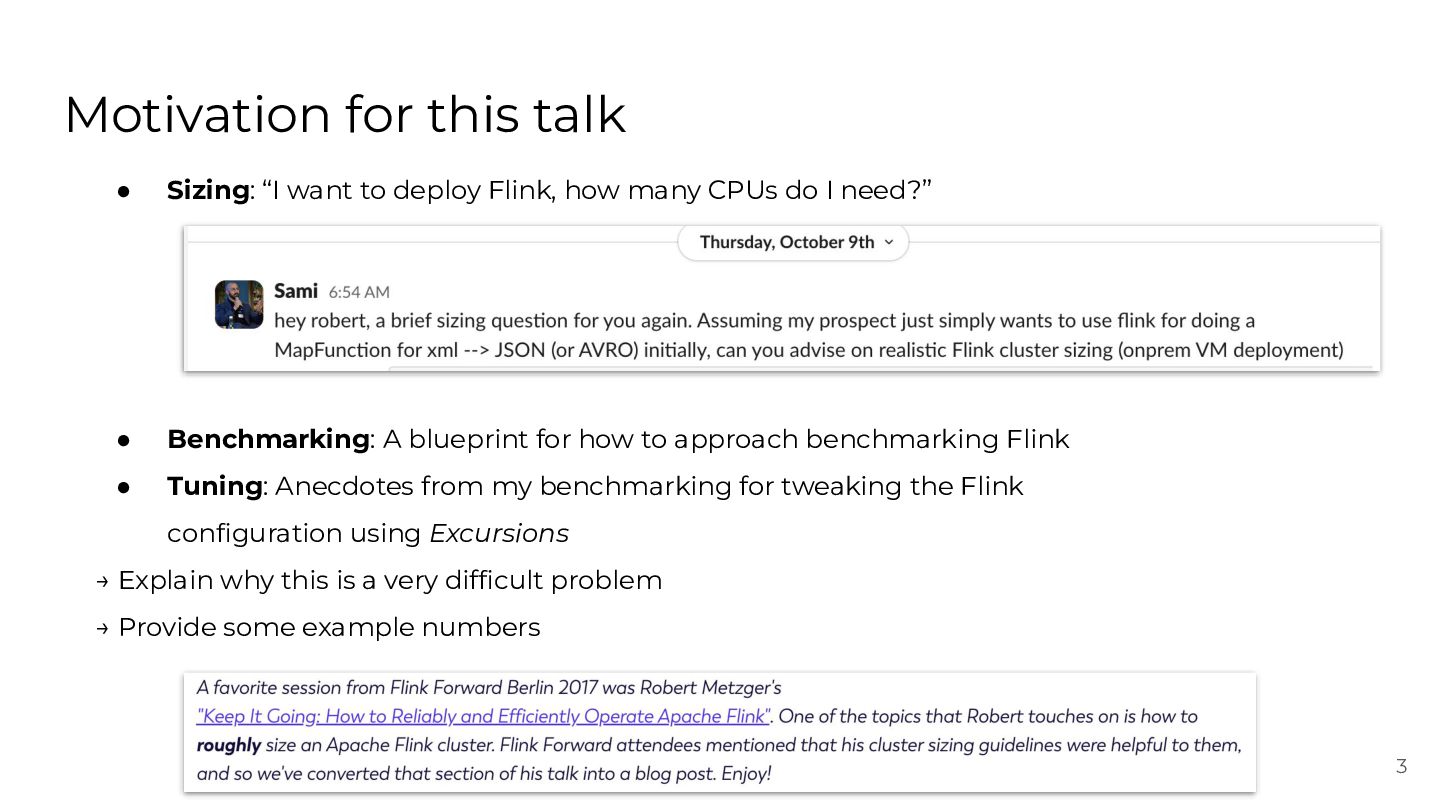
  3. Motivation for this talk • Sizing: “I want to deploy
    Flink, how many CPUs do I need?” • Benchmarking: A blueprint for how to approach benchmarking Flink • Tuning: Anecdotes from my benchmarking for tweaking the Flink configuration using Excursions → Explain why this is a very difficult problem → Provide some example numbers 3
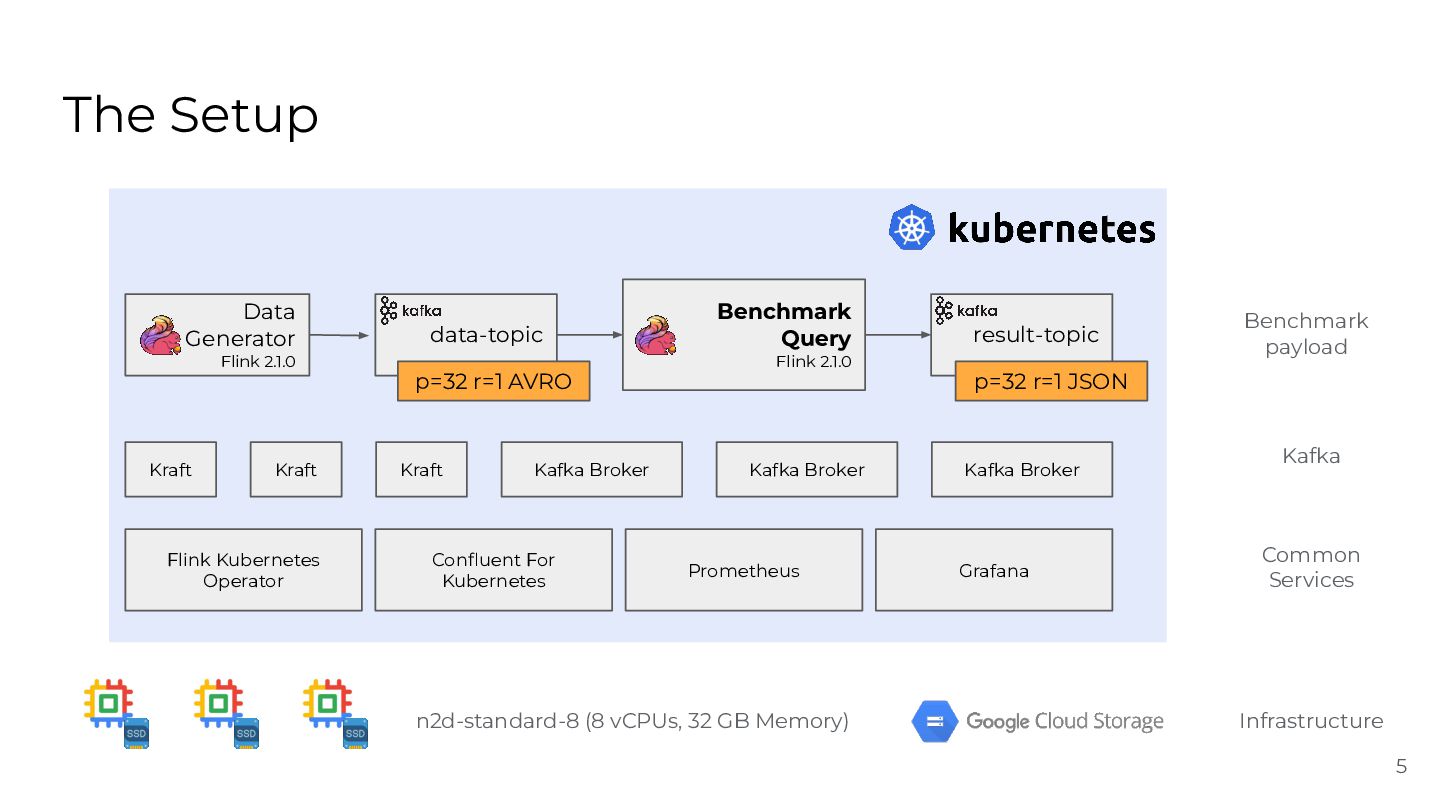
  4. The Setup Data Generator Flink 2.1.0 Kraft Kraft Flink Kubernetes

    Operator data-topic p=32 r=1 AVRO Kraft Kafka Broker Confluent For Kubernetes Benchmark Query Flink 2.1.0 Kafka Broker Prometheus n2d-standard-8 (8 vCPUs, 32 GB Memory) result-topic Benchmark payload p=32 r=1 JSON Kafka Broker Grafana Kafka Common Services Infrastructure 5
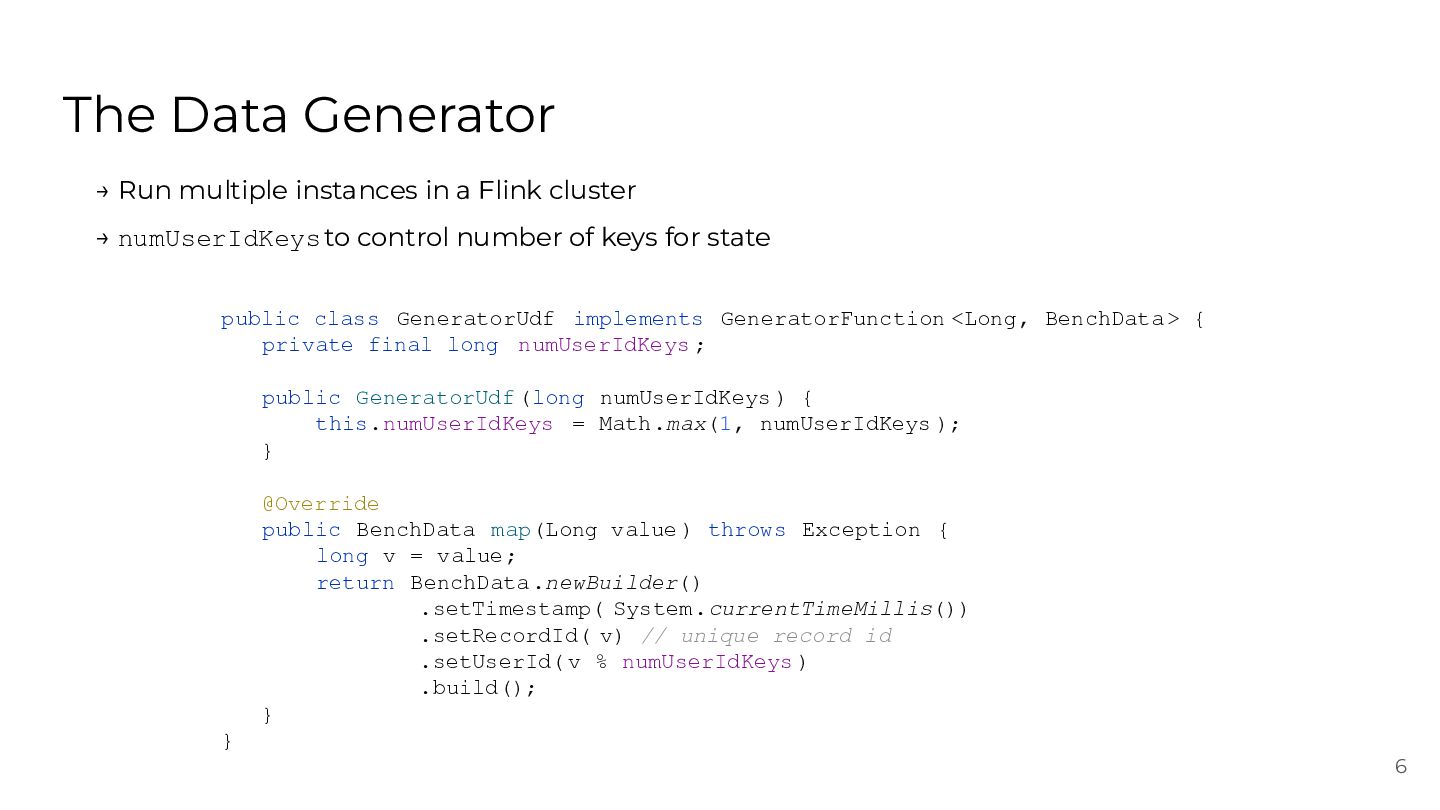
  5. The Data Generator → Run multiple instances in a Flink

    cluster → numUserIdKeys to control number of keys for state public class GeneratorUdf implements GeneratorFunction <Long, BenchData > { private final long numUserIdKeys ; public GeneratorUdf (long numUserIdKeys ) { this.numUserIdKeys = Math.max(1, numUserIdKeys ); } @Override public BenchData map(Long value ) throws Exception { long v = value; return BenchData .newBuilder() .setTimestamp( System.currentTimeMillis()) .setRecordId( v) // unique record id .setUserId( v % numUserIdKeys ) .build(); } } 6
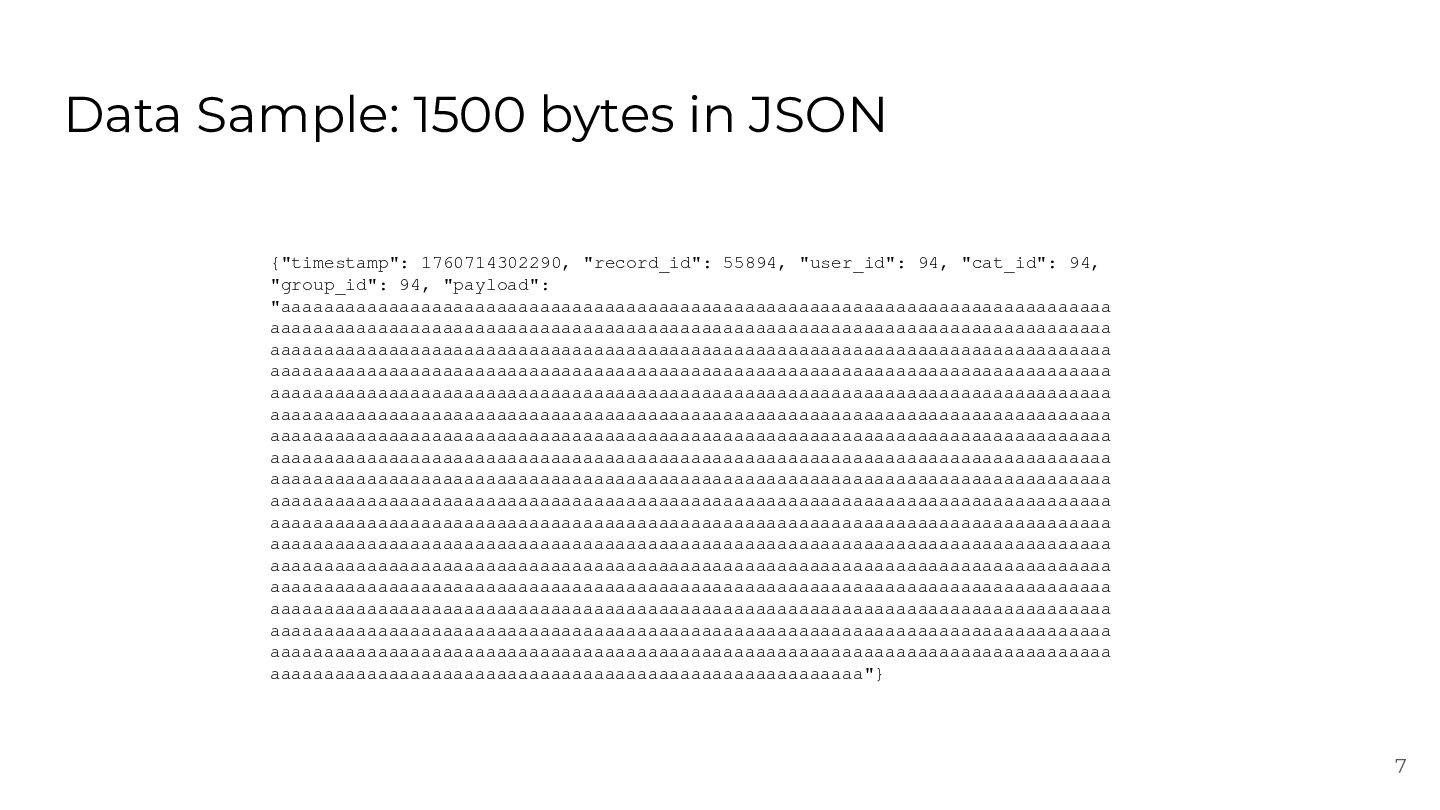
  6. Data Sample: 1500 bytes in JSON {"timestamp": 1760714302290, "record_id": 55894,

    "user_id": 94, "cat_id": 94, "group_id": 94, "payload": "aaaaaaaaaaaaaaaaaaaaaaaaaaaaaaaaaaaaaaaaaaaaaaaaaaaaaaaaaaaaaaaaaaaaaaaaaaaaa aaaaaaaaaaaaaaaaaaaaaaaaaaaaaaaaaaaaaaaaaaaaaaaaaaaaaaaaaaaaaaaaaaaaaaaaaaaaaa aaaaaaaaaaaaaaaaaaaaaaaaaaaaaaaaaaaaaaaaaaaaaaaaaaaaaaaaaaaaaaaaaaaaaaaaaaaaaa aaaaaaaaaaaaaaaaaaaaaaaaaaaaaaaaaaaaaaaaaaaaaaaaaaaaaaaaaaaaaaaaaaaaaaaaaaaaaa aaaaaaaaaaaaaaaaaaaaaaaaaaaaaaaaaaaaaaaaaaaaaaaaaaaaaaaaaaaaaaaaaaaaaaaaaaaaaa aaaaaaaaaaaaaaaaaaaaaaaaaaaaaaaaaaaaaaaaaaaaaaaaaaaaaaaaaaaaaaaaaaaaaaaaaaaaaa aaaaaaaaaaaaaaaaaaaaaaaaaaaaaaaaaaaaaaaaaaaaaaaaaaaaaaaaaaaaaaaaaaaaaaaaaaaaaa aaaaaaaaaaaaaaaaaaaaaaaaaaaaaaaaaaaaaaaaaaaaaaaaaaaaaaaaaaaaaaaaaaaaaaaaaaaaaa aaaaaaaaaaaaaaaaaaaaaaaaaaaaaaaaaaaaaaaaaaaaaaaaaaaaaaaaaaaaaaaaaaaaaaaaaaaaaa aaaaaaaaaaaaaaaaaaaaaaaaaaaaaaaaaaaaaaaaaaaaaaaaaaaaaaaaaaaaaaaaaaaaaaaaaaaaaa aaaaaaaaaaaaaaaaaaaaaaaaaaaaaaaaaaaaaaaaaaaaaaaaaaaaaaaaaaaaaaaaaaaaaaaaaaaaaa aaaaaaaaaaaaaaaaaaaaaaaaaaaaaaaaaaaaaaaaaaaaaaaaaaaaaaaaaaaaaaaaaaaaaaaaaaaaaa aaaaaaaaaaaaaaaaaaaaaaaaaaaaaaaaaaaaaaaaaaaaaaaaaaaaaaaaaaaaaaaaaaaaaaaaaaaaaa aaaaaaaaaaaaaaaaaaaaaaaaaaaaaaaaaaaaaaaaaaaaaaaaaaaaaaaaaaaaaaaaaaaaaaaaaaaaaa aaaaaaaaaaaaaaaaaaaaaaaaaaaaaaaaaaaaaaaaaaaaaaaaaaaaaaaaaaaaaaaaaaaaaaaaaaaaaa aaaaaaaaaaaaaaaaaaaaaaaaaaaaaaaaaaaaaaaaaaaaaaaaaaaaaaaaaaaaaaaaaaaaaaaaaaaaaa aaaaaaaaaaaaaaaaaaaaaaaaaaaaaaaaaaaaaaaaaaaaaaaaaaaaaaaaaaaaaaaaaaaaaaaaaaaaaa aaaaaaaaaaaaaaaaaaaaaaaaaaaaaaaaaaaaaaaaaaaaaaaaaaaaaaa"} 7
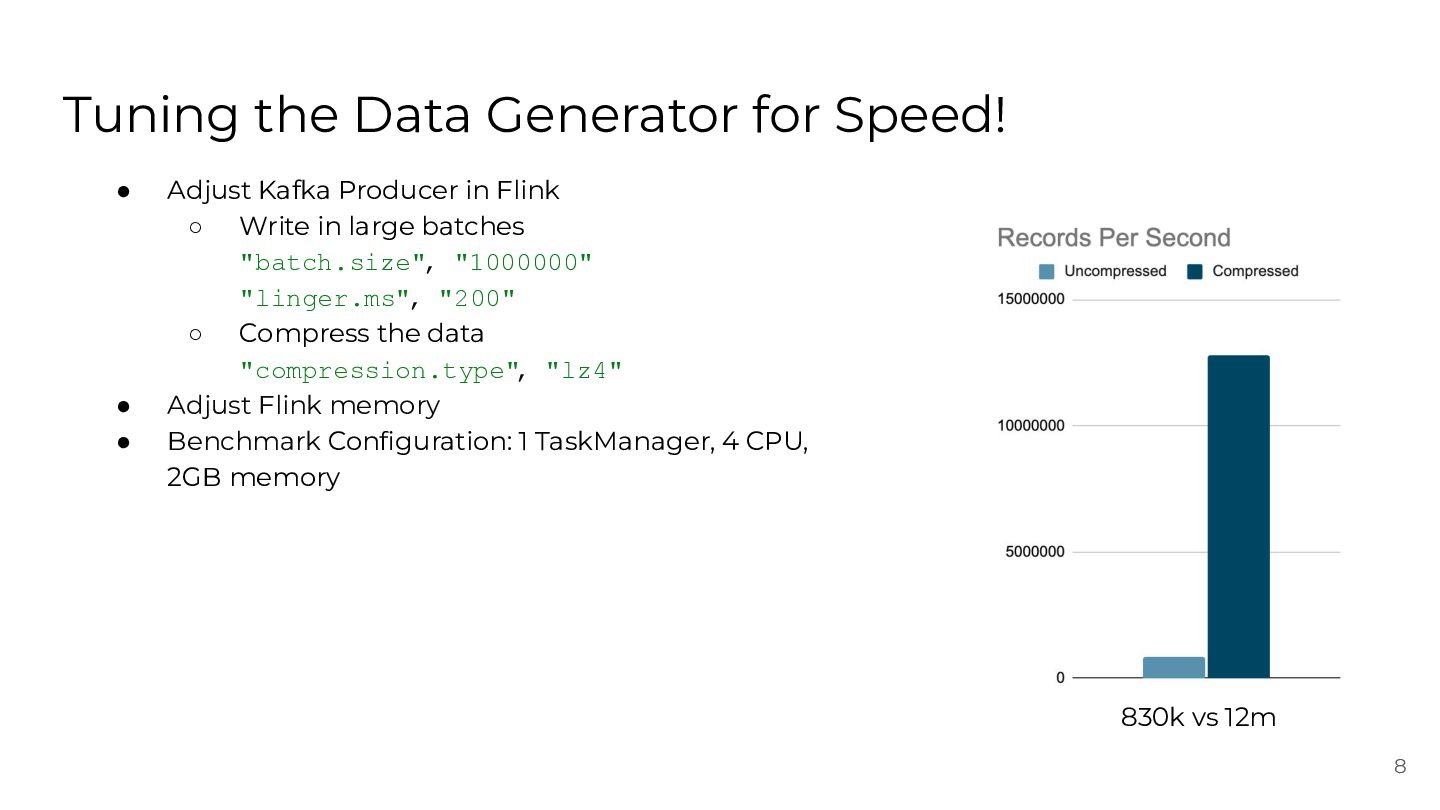
  7. Tuning the Data Generator for Speed! • • • Adjust

    Kafka Producer in Flink ◦ Write in large batches "batch.size", "1000000" "linger.ms", "200" ◦ Compress the data "compression.type", "lz4" Adjust Flink memory Benchmark Configuration: 1 TaskManager, 4 CPU, 2GB memory 830k vs 12m 8
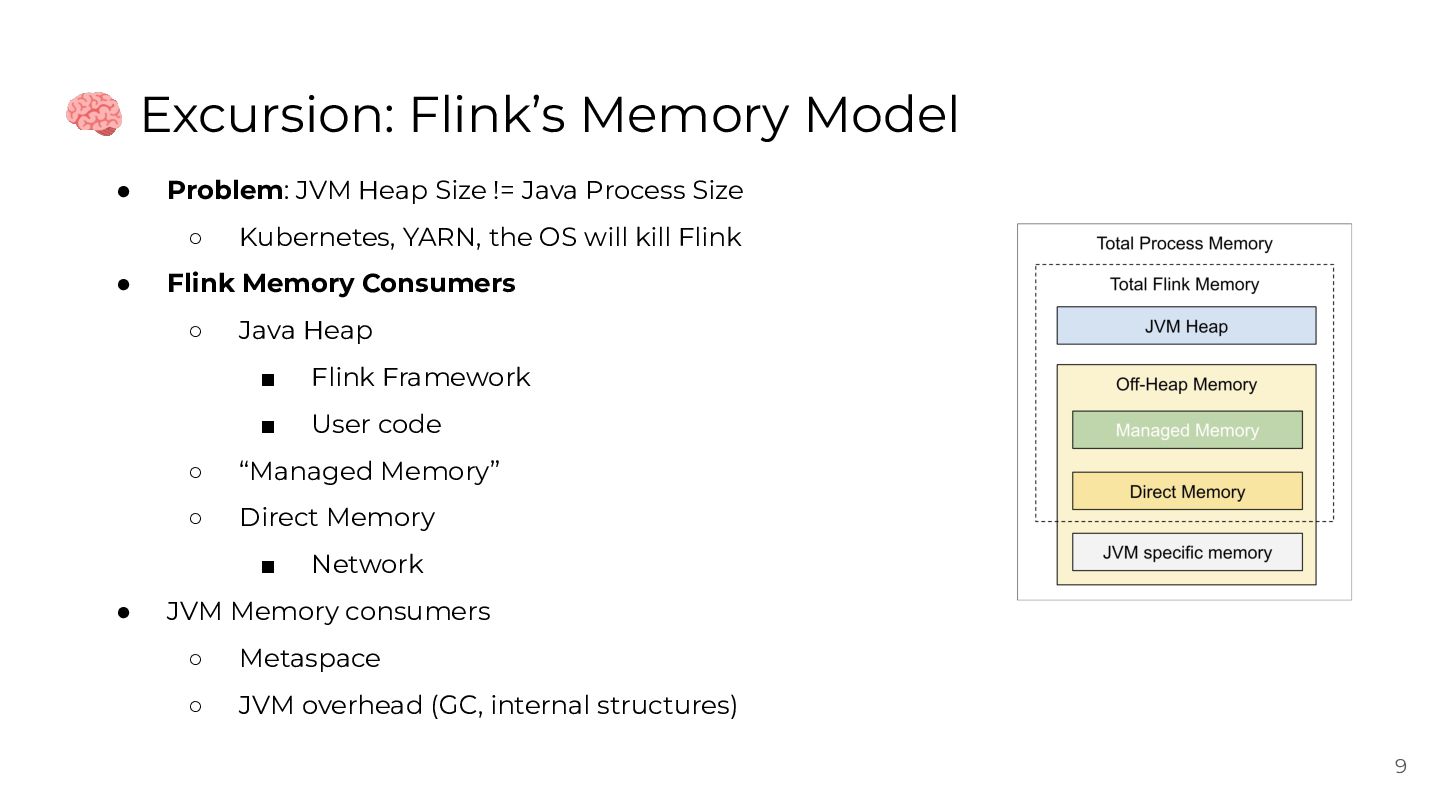
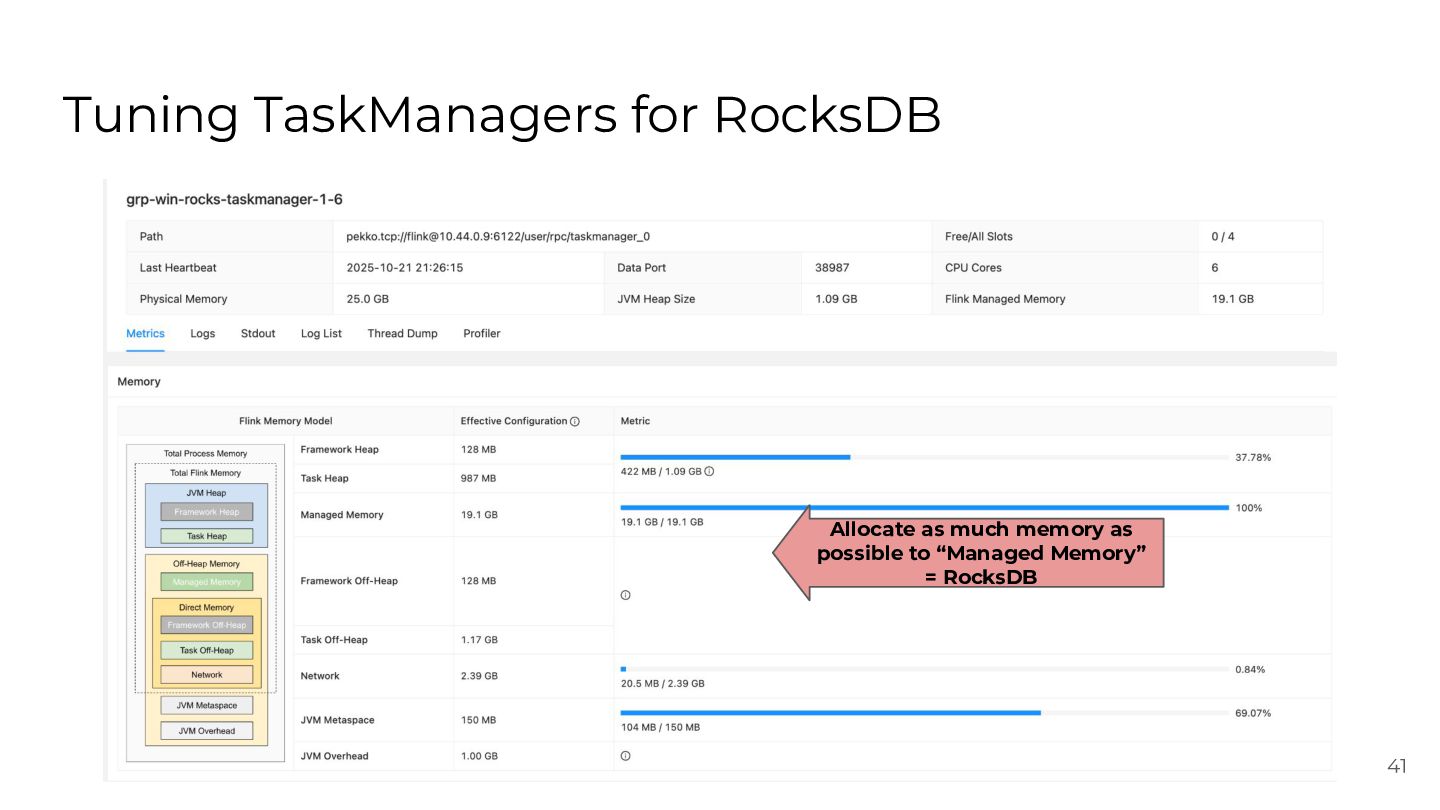
  8. 🧠 Excursion: Flink’s Memory Model • Problem: JVM Heap Size

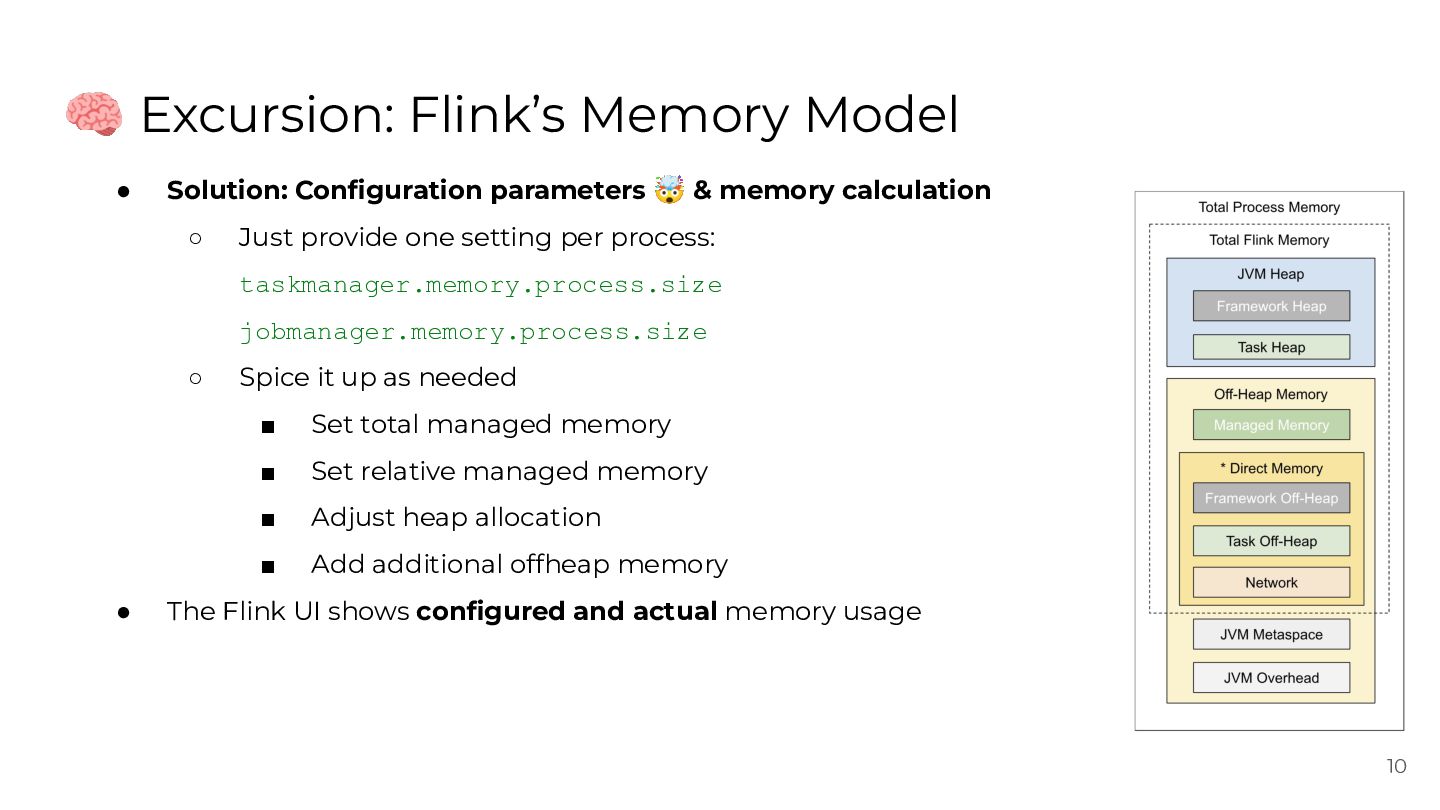
    != Java Process Size ◦ • Kubernetes, YARN, the OS will kill Flink Flink Memory Consumers ◦ Java Heap ▪ Flink Framework ▪ User code ◦ “Managed Memory” ◦ Direct Memory ▪ • Network JVM Memory consumers ◦ Metaspace ◦ JVM overhead (GC, internal structures) 9
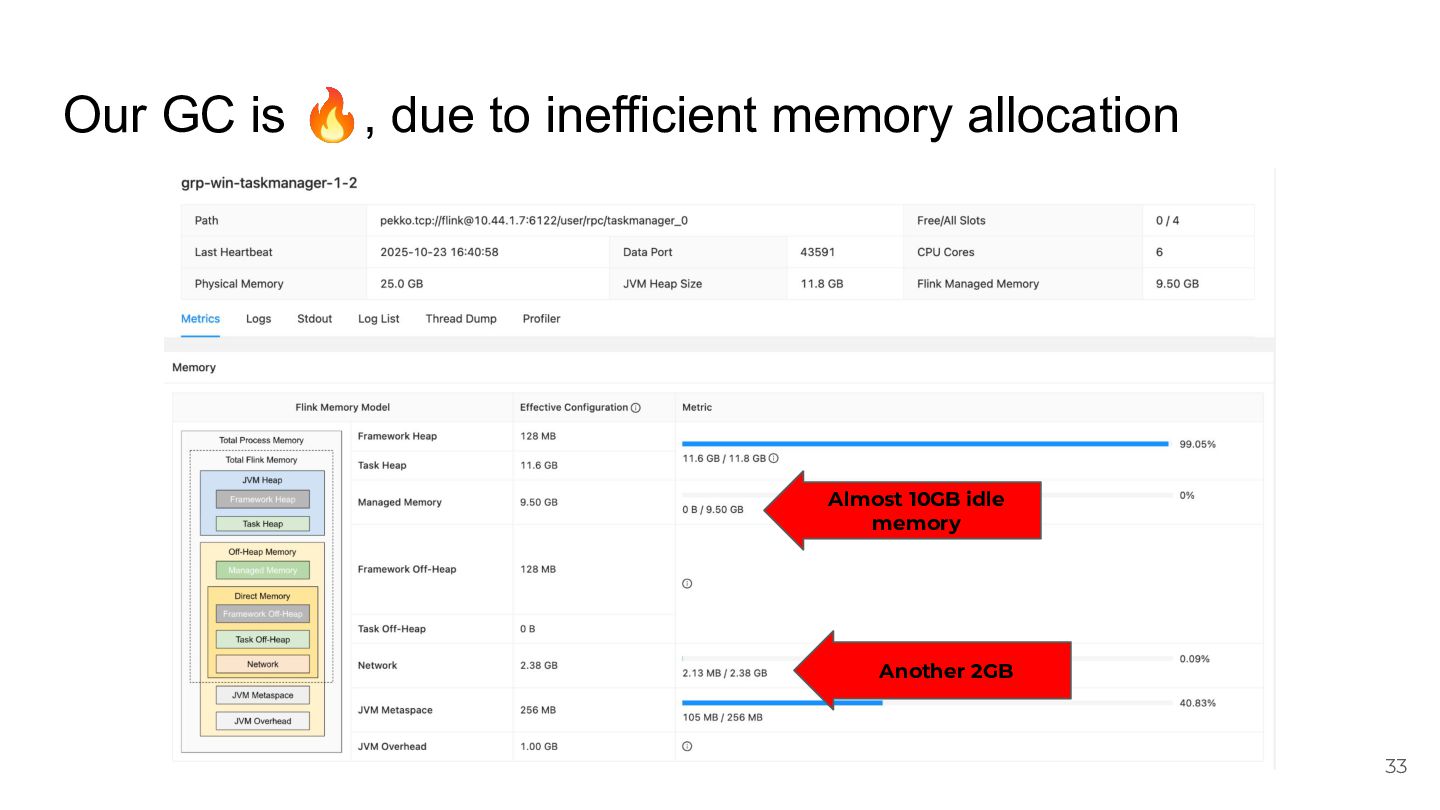
  9. 🧠 Excursion: Flink’s Memory Model • Solution: Configuration parameters 🤯

    & memory calculation ◦ Just provide one setting per process: taskmanager.memory.process.size jobmanager.memory.process.size ◦ • Spice it up as needed ▪ Set total managed memory ▪ Set relative managed memory ▪ Adjust heap allocation ▪ Add additional offheap memory The Flink UI shows configured and actual memory usage 10
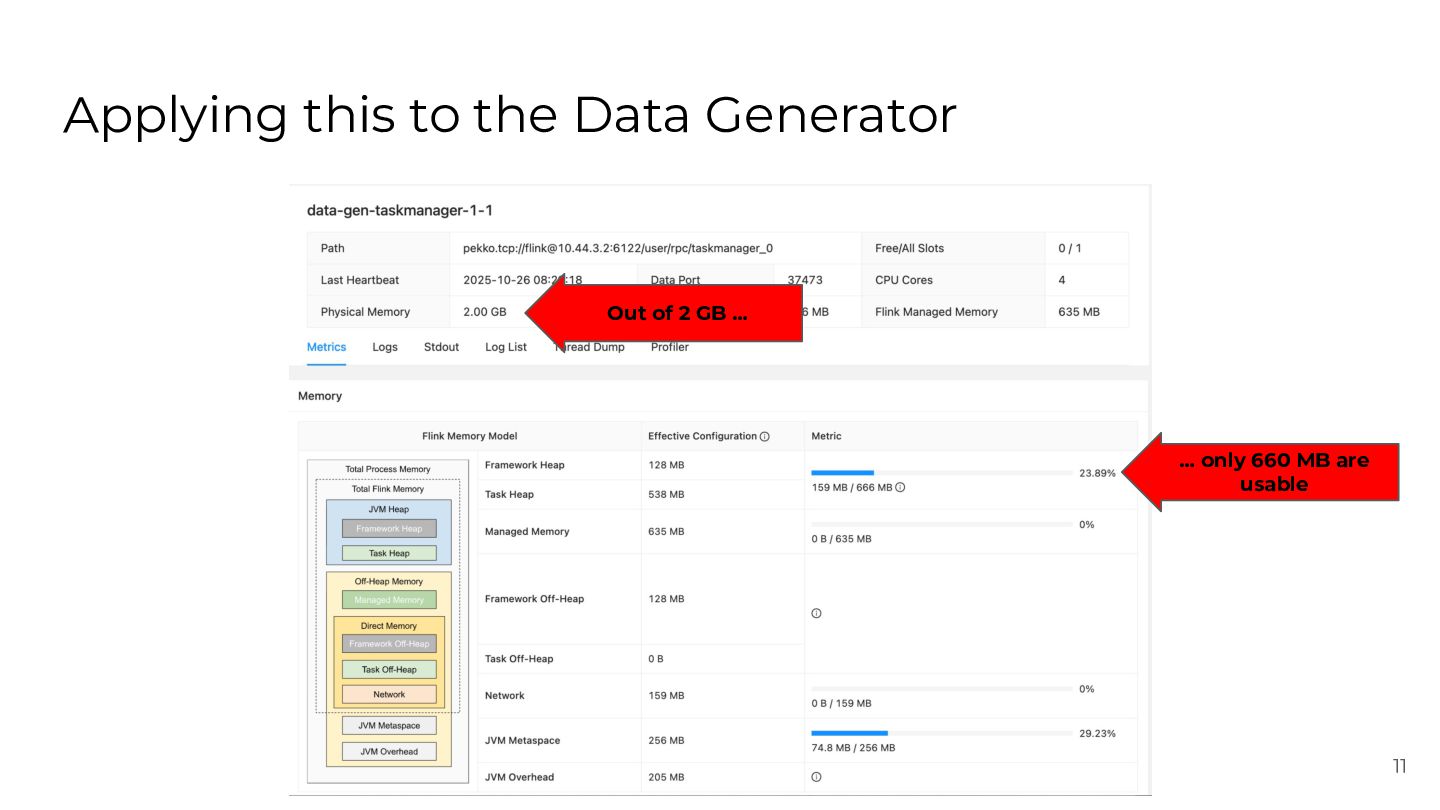
  10. Applying this to the Data Generator Out of 2 GB

    … … only 660 MB are usable 11
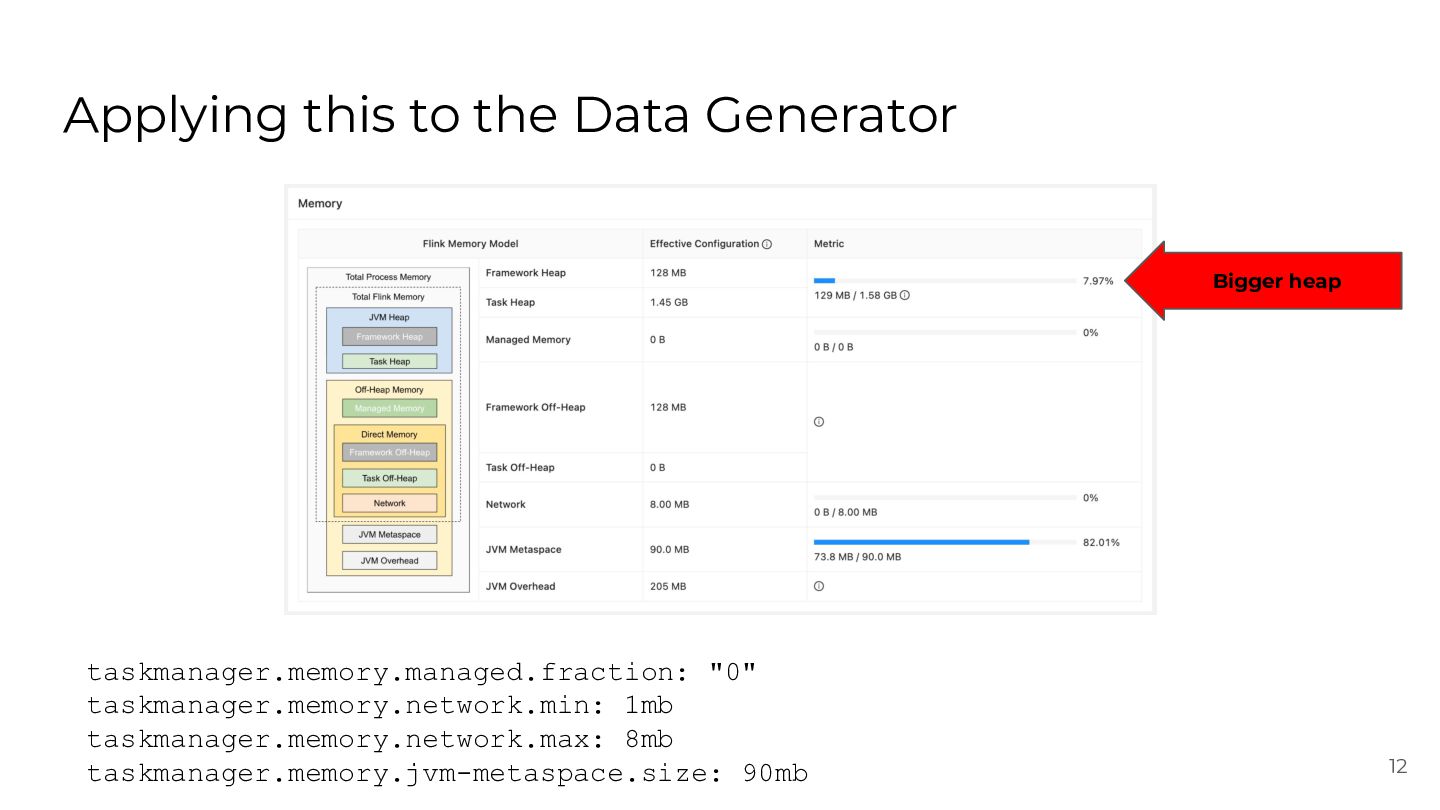
  11. Applying this to the Data Generator Bigger heap taskmanager.memory.managed.fraction: "0"

    taskmanager.memory.network.min: 1mb taskmanager.memory.network.max: 8mb taskmanager.memory.jvm-metaspace.size: 90mb 12
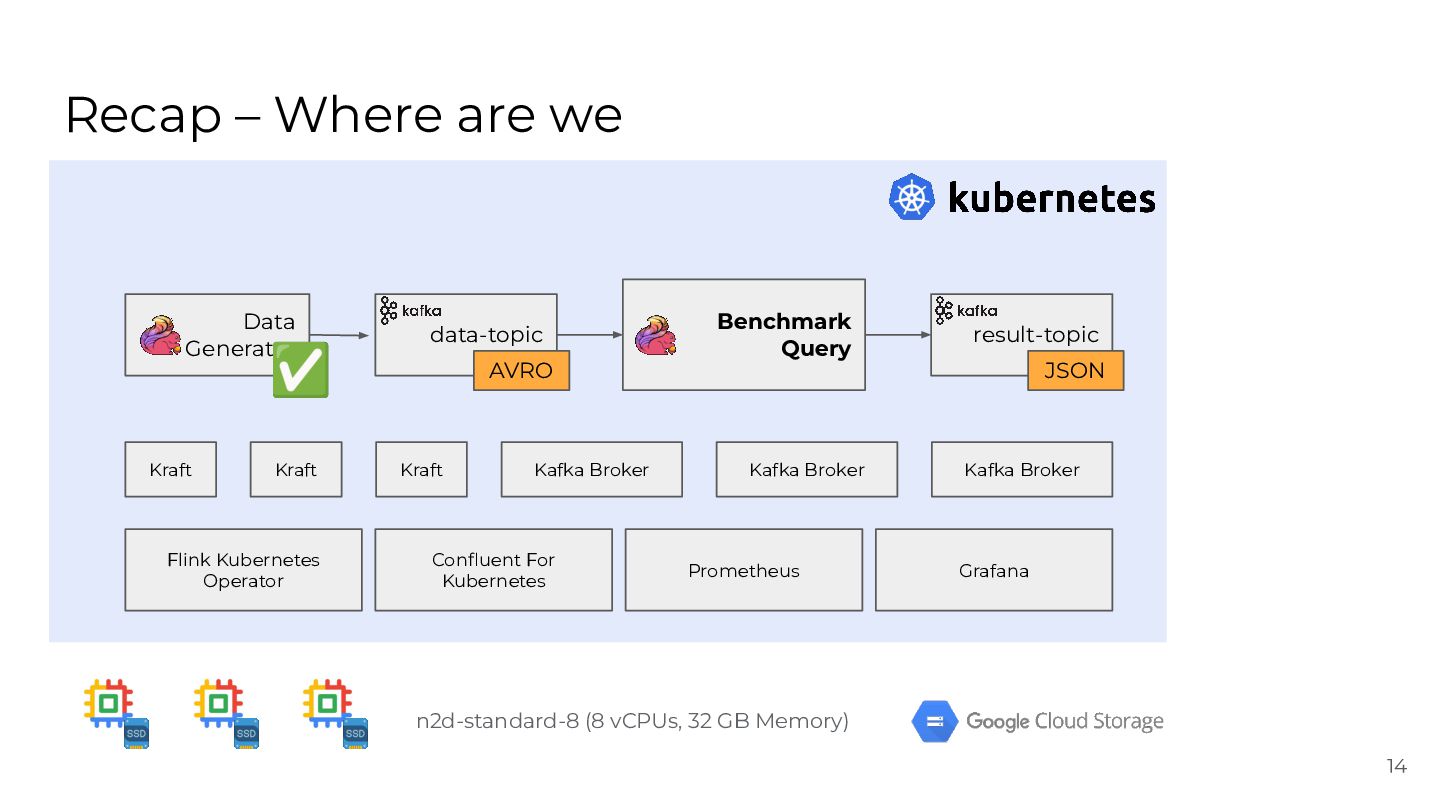
  12. Recap – Where are we Data Generator ✅ Kraft Kraft

    Flink Kubernetes Operator data-topic AVRO Kraft Kafka Broker Confluent For Kubernetes Benchmark Query Kafka Broker Prometheus result-topic JSON Kafka Broker Grafana n2d-standard-8 (8 vCPUs, 32 GB Memory) 14
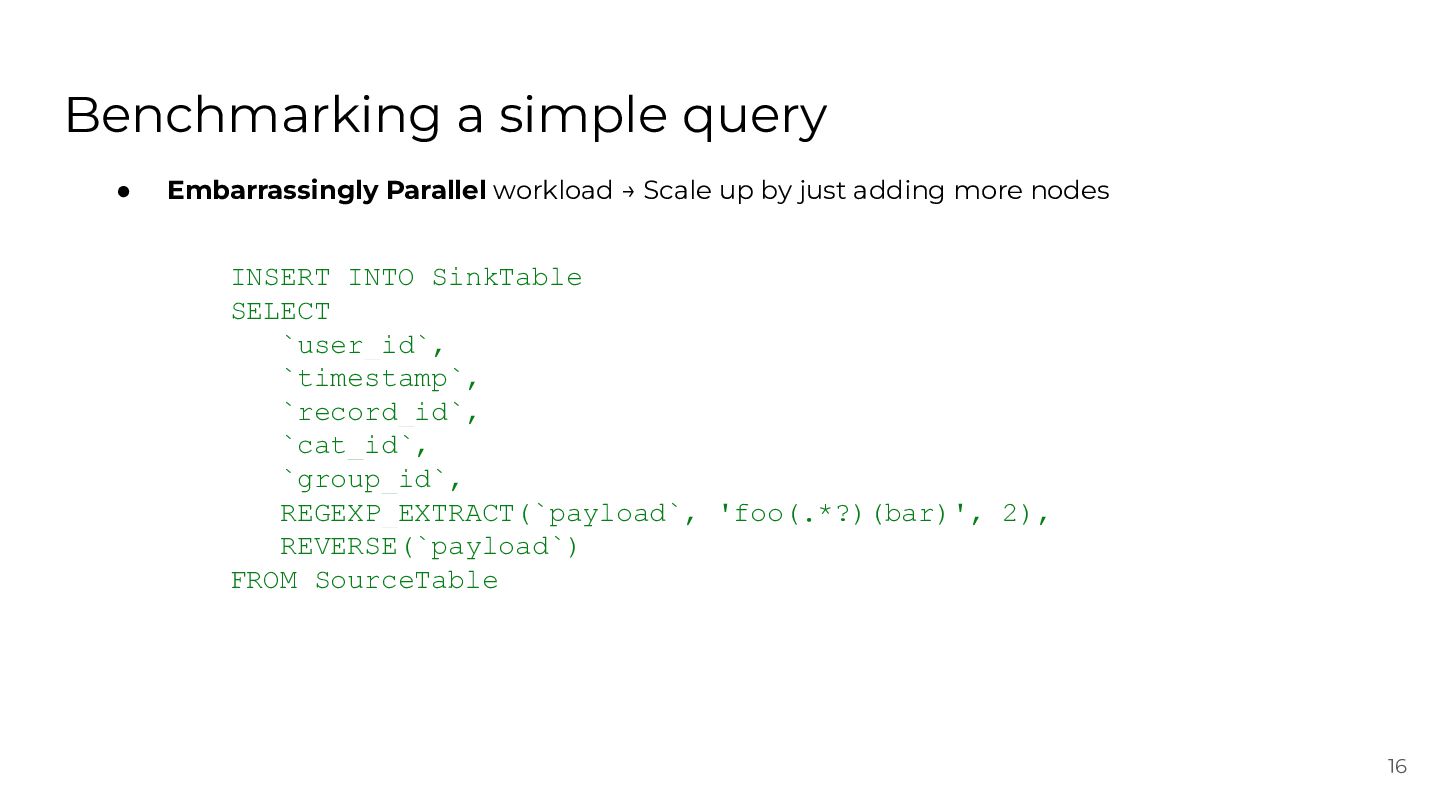
  13. Benchmarking a simple query • Embarrassingly Parallel workload → Scale

    up by just adding more nodes INSERT INTO SinkTable SELECT `user_id`, `timestamp`, `record_id`, `cat_id`, `group_id`, REGEXP_EXTRACT(`payload`, 'foo(.*?)(bar)', 2), REVERSE(`payload`) FROM SourceTable 16
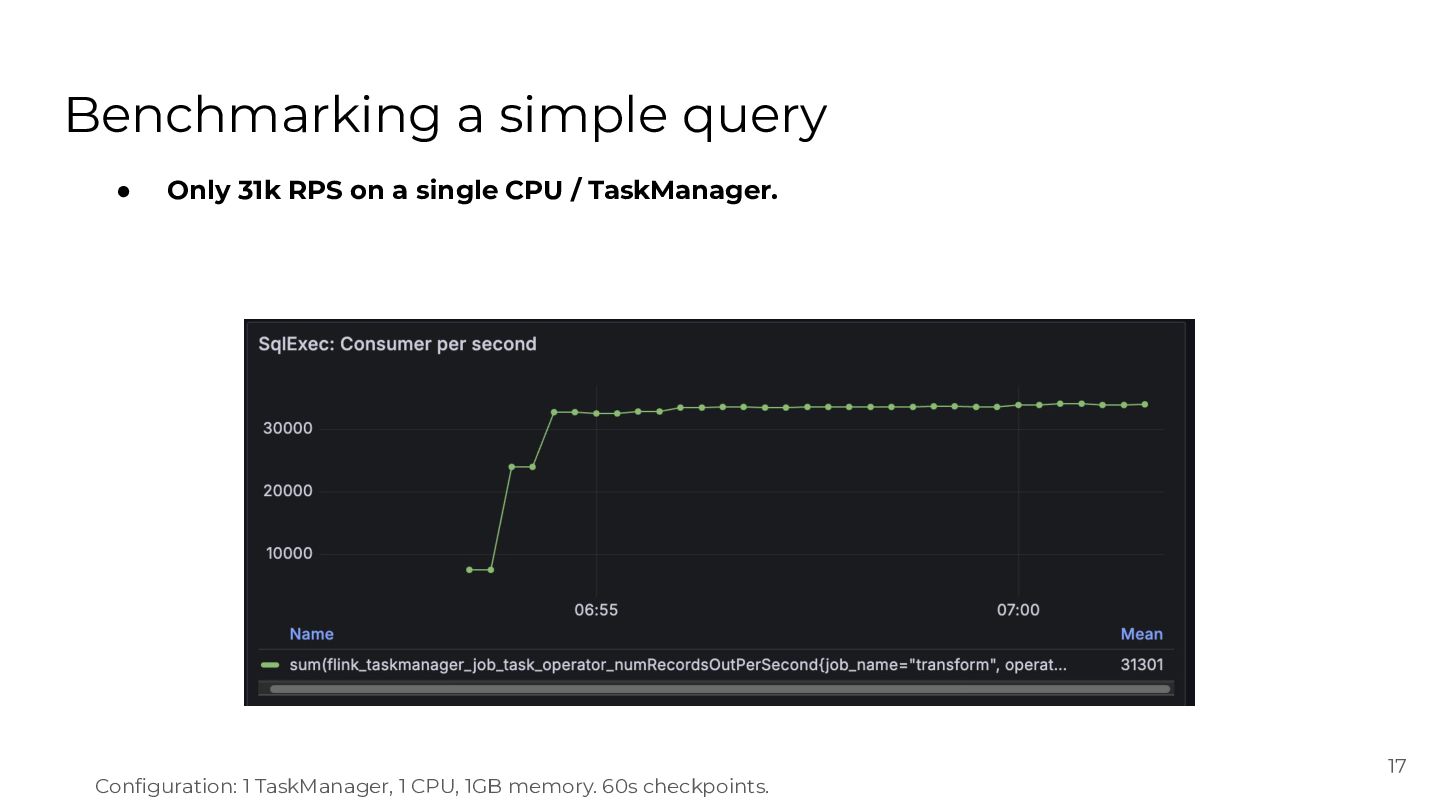
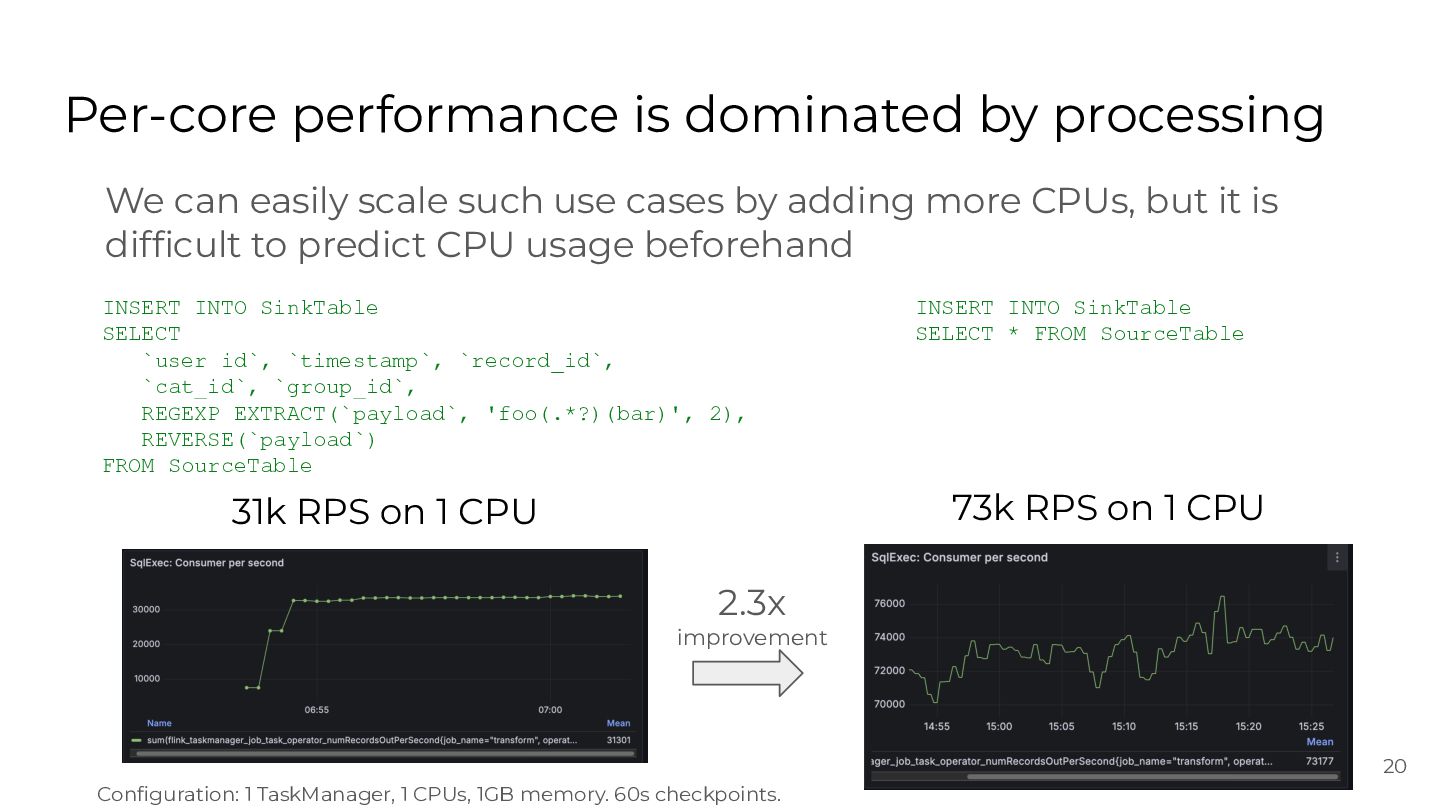
  14. Benchmarking a simple query • Only 31k RPS on a

    single CPU / TaskManager. Configuration: 1 TaskManager, 1 CPU, 1GB memory. 60s checkpoints. 17
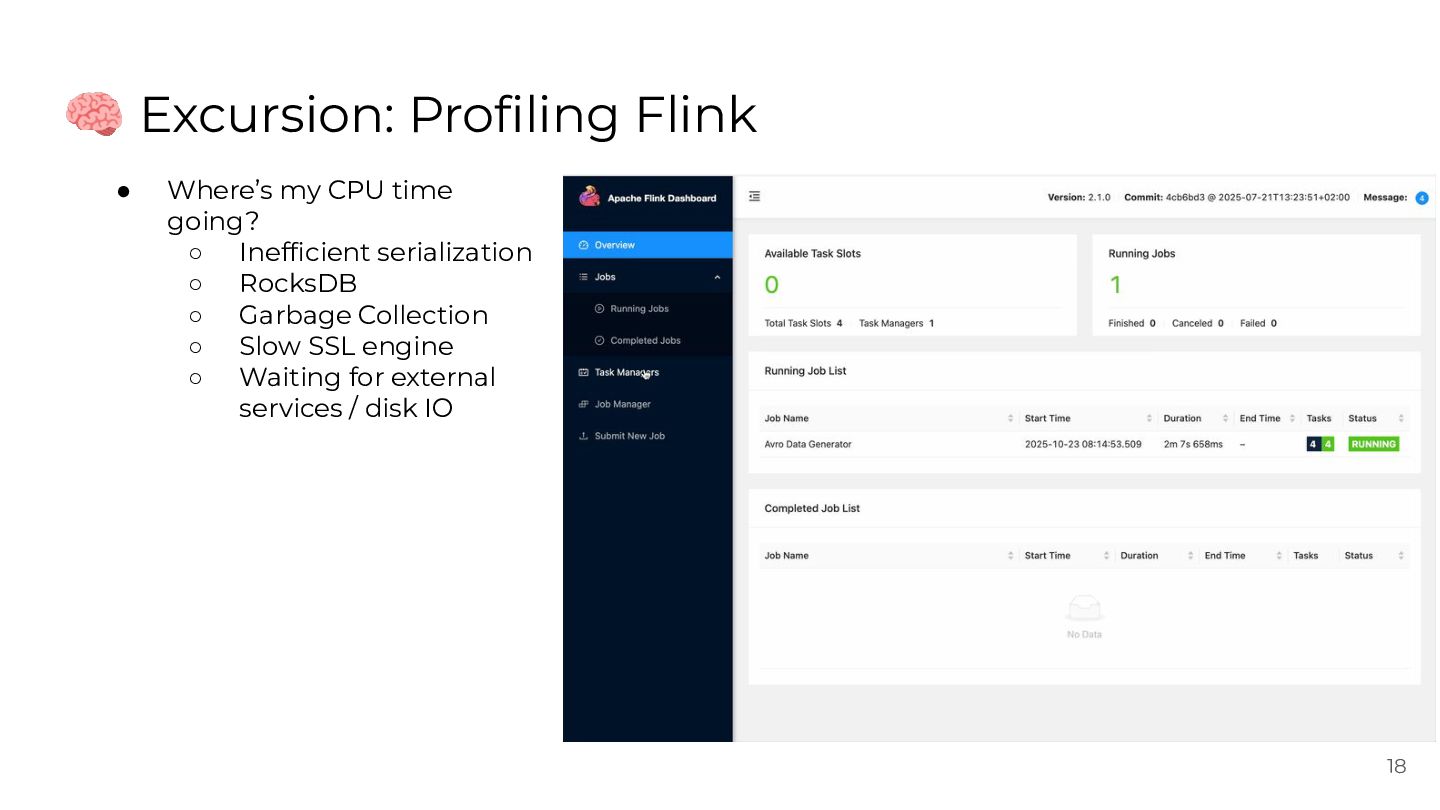
  15. 🧠 Excursion: Profiling Flink • Where’s my CPU time going?

    ◦ Inefficient serialization ◦ RocksDB ◦ Garbage Collection ◦ Slow SSL engine ◦ Waiting for external services / disk IO 18
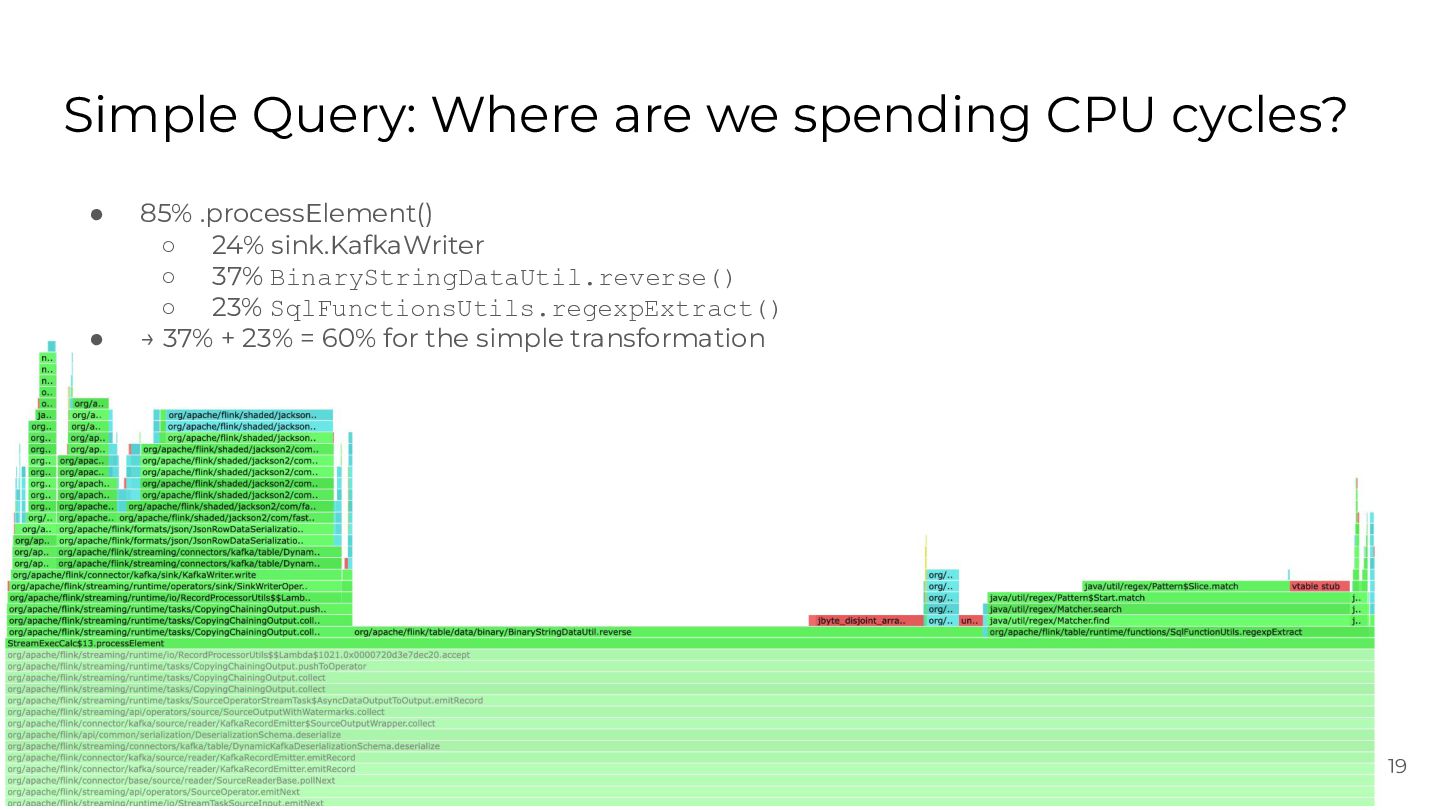
  16. Simple Query: Where are we spending CPU cycles? • •

    85% .processElement() ◦ 24% sink.KafkaWriter ◦ 37% BinaryStringDataUtil.reverse() ◦ 23% SqlFunctionsUtils.regexpExtract() → 37% + 23% = 60% for the simple transformation 19
  17. Per-core performance is dominated by processing We can easily scale

    such use cases by adding more CPUs, but it is difficult to predict CPU usage beforehand INSERT INTO SinkTable SELECT `user_id`, `timestamp`, `record_id`, `cat_id`, `group_id`, REGEXP_EXTRACT(`payload`, 'foo(.*?)(bar)', 2), REVERSE(`payload`) FROM SourceTable INSERT INTO SinkTable SELECT * FROM SourceTable 73k RPS on 1 CPU 31k RPS on 1 CPU 2.3x improvement 20 Configuration: 1 TaskManager, 1 CPUs, 1GB memory. 60s checkpoints.
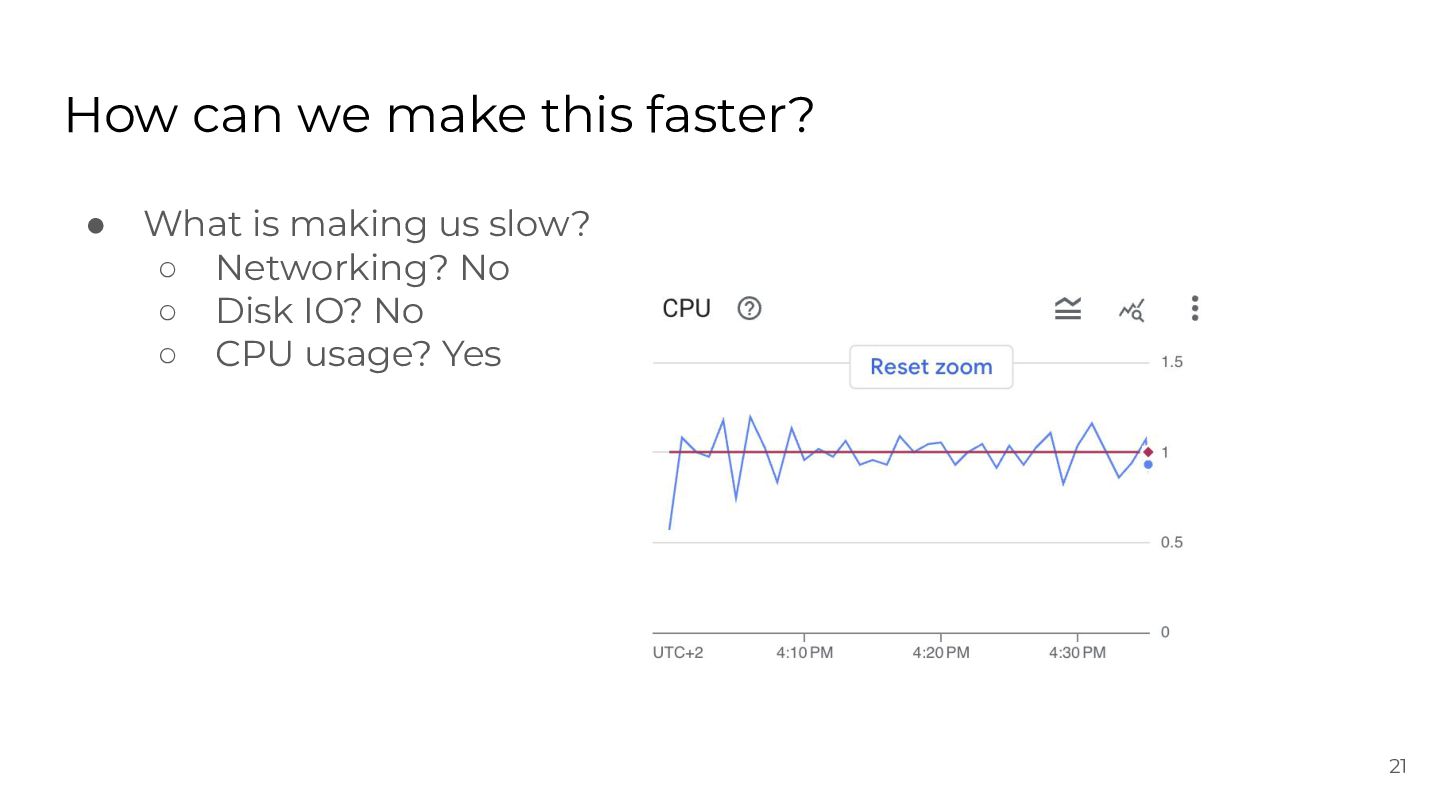
  18. How can we make this faster? • What is making

    us slow? ◦ Networking? No ◦ Disk IO? No ◦ CPU usage? Yes 21
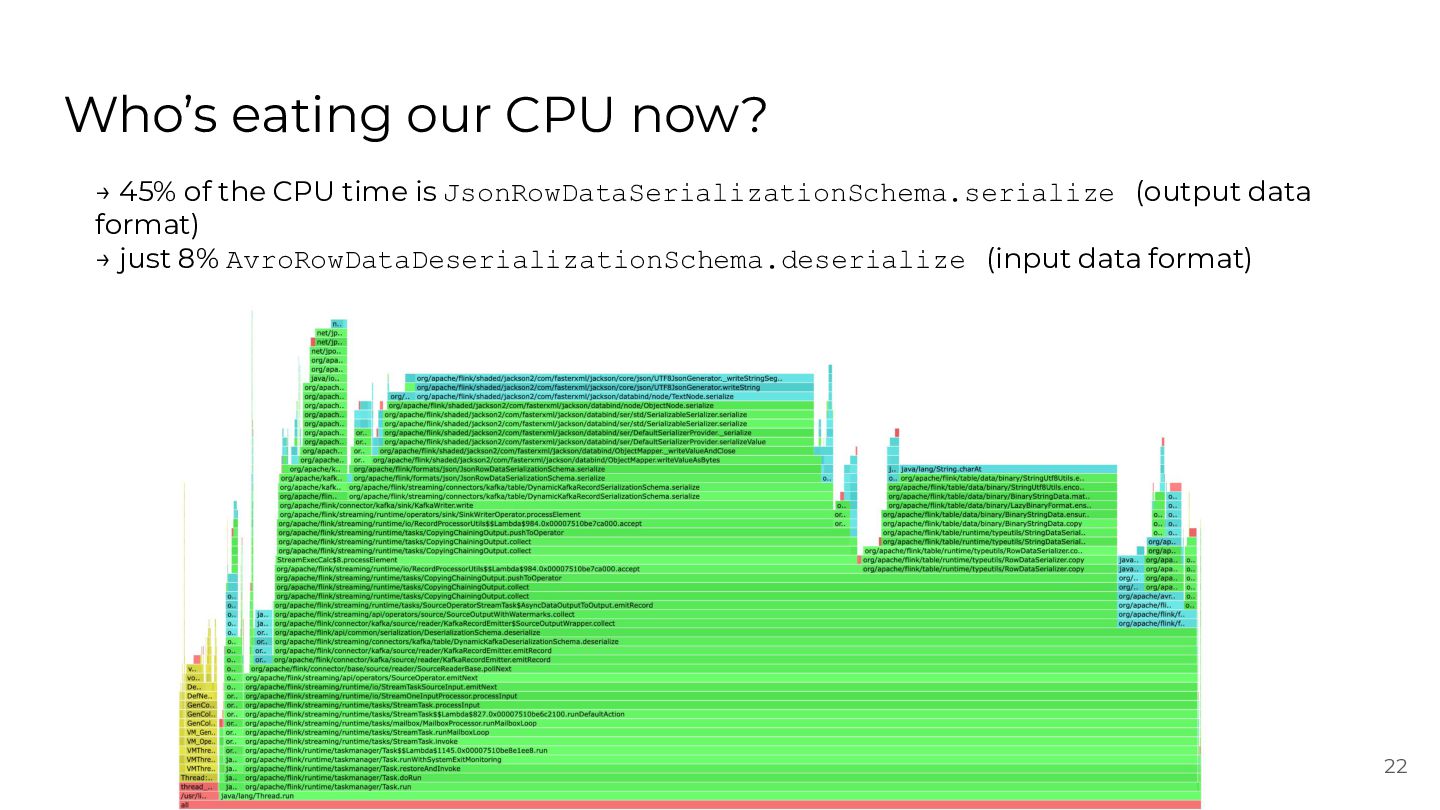
  19. Who’s eating our CPU now? → 45% of the CPU

    time is JsonRowDataSerializationSchema.serialize (output data format) → just 8% AvroRowDataDeserializationSchema.deserialize (input data format) 22
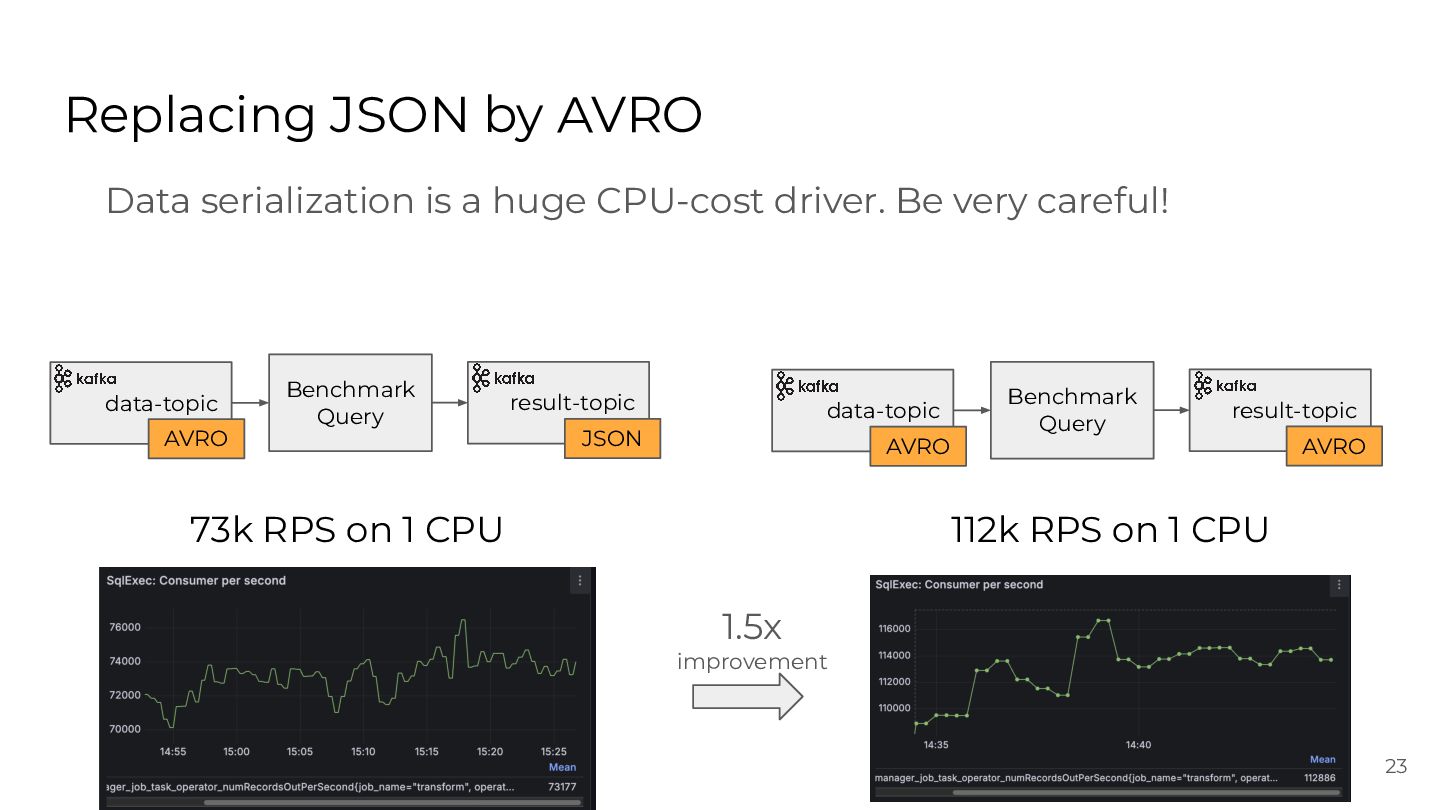
  20. Replacing JSON by AVRO Data serialization is a huge CPU-cost

    driver. Be very careful! data-topic AVRO Benchmark Query result-topic data-topic JSON AVRO Benchmark Query result-topic AVRO 112k RPS on 1 CPU 73k RPS on 1 CPU 1.5x improvement 23
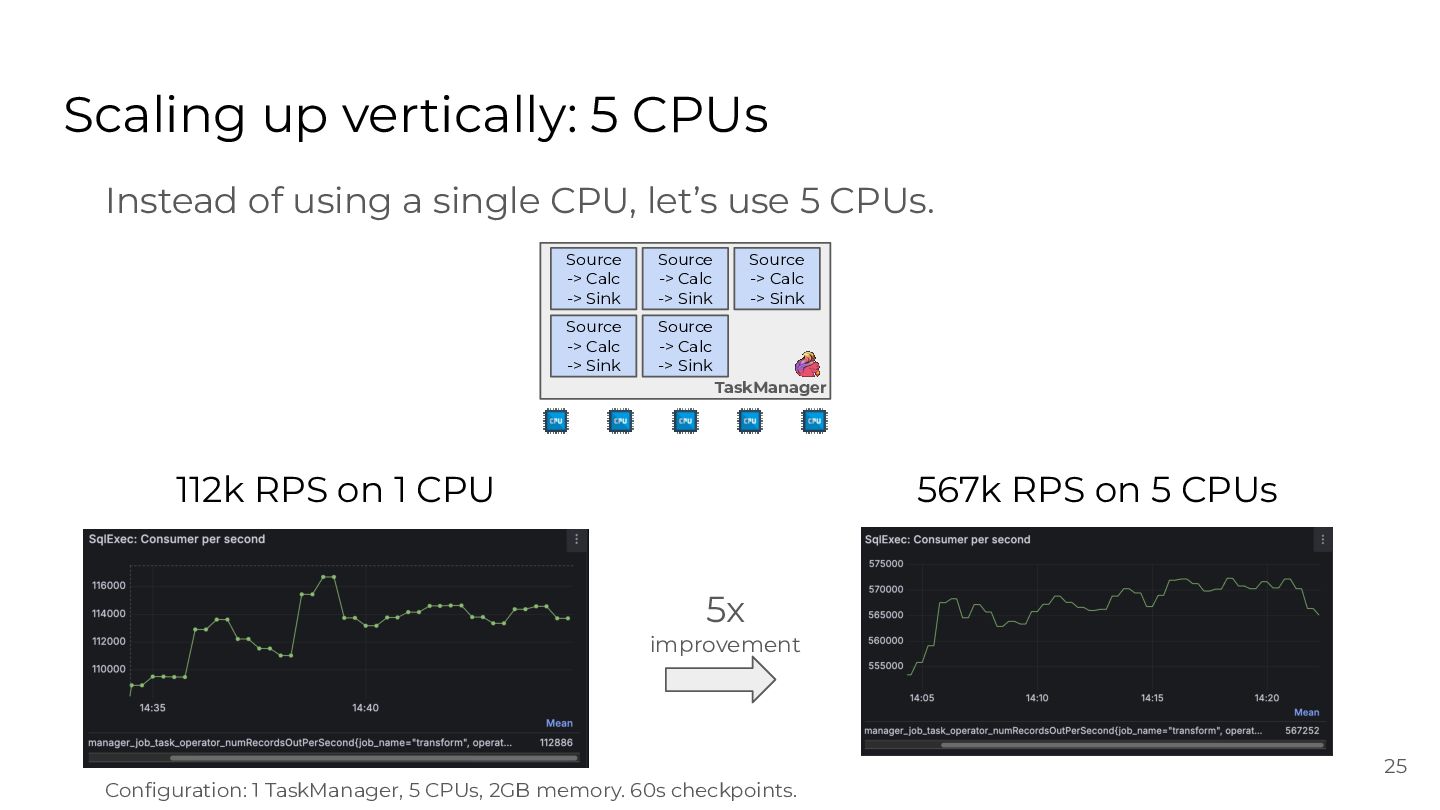
  21. Scaling up vertically: 5 CPUs Instead of using a single

    CPU, let’s use 5 CPUs. Source -> Calc -> Sink Source -> Calc -> Sink Source -> Calc -> Sink Source -> Calc -> Sink Source -> Calc -> Sink TaskManager 112k RPS on 1 CPU 567k RPS on 5 CPUs 5x 522k RPS on 5 CPUs improvement 25 Configuration: 1 TaskManager, 5 CPUs, 2GB memory. 60s checkpoints.
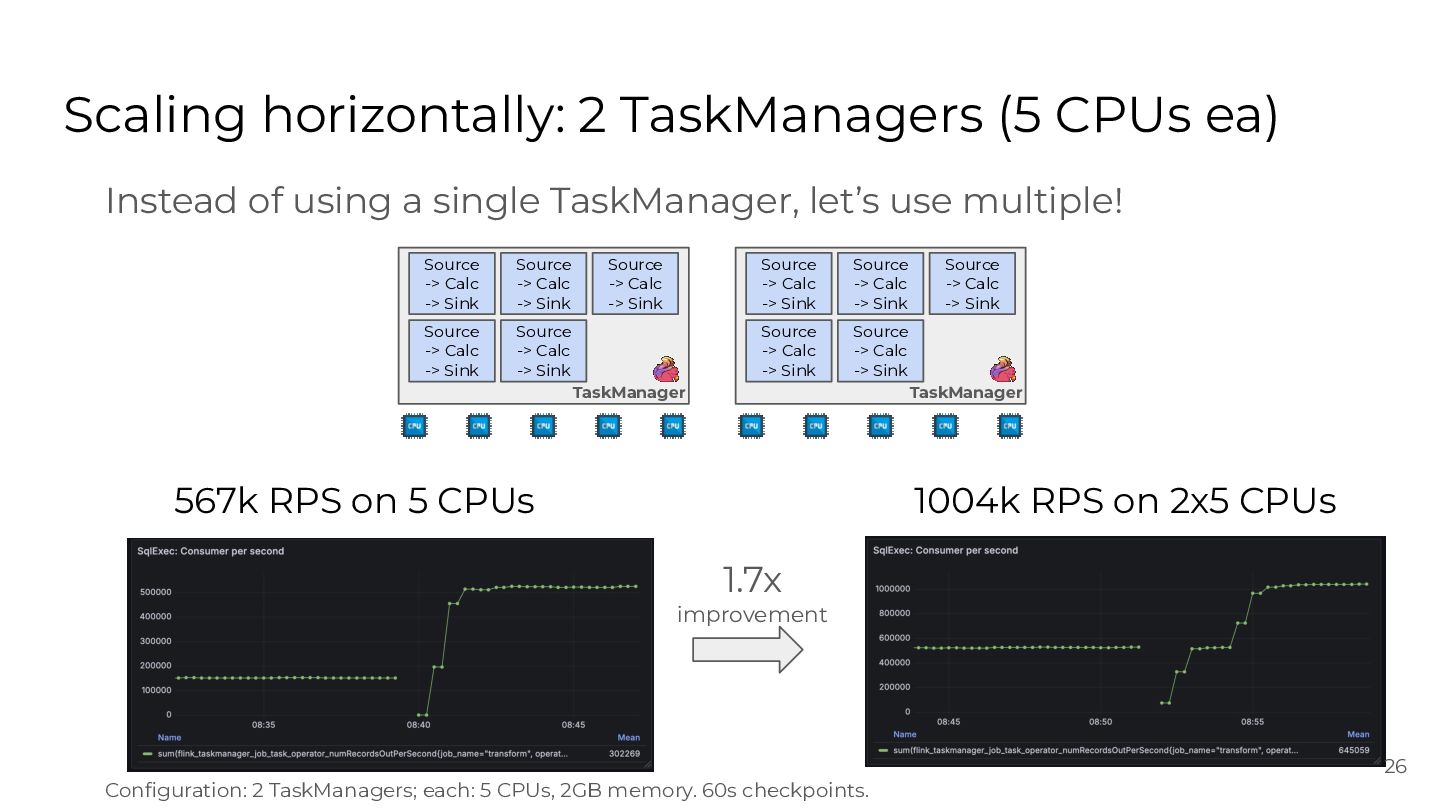
  22. Scaling horizontally: 2 TaskManagers (5 CPUs ea) Instead of using

    a single TaskManager, let’s use multiple! Source -> Calc -> Sink Source -> Calc -> Sink Source -> Calc -> Sink Source -> Calc -> Sink Source -> Calc -> Sink Source -> Calc -> Sink Source -> Calc -> Sink Source -> Calc -> Sink Source -> Calc -> Sink TaskManager Source -> Calc -> Sink TaskManager 567k RPS on 5 CPUs 1004k RPS on 2x5 CPUs 1.7x improvement 26 Configuration: 2 TaskManagers; each: 5 CPUs, 2GB memory. 60s checkpoints.
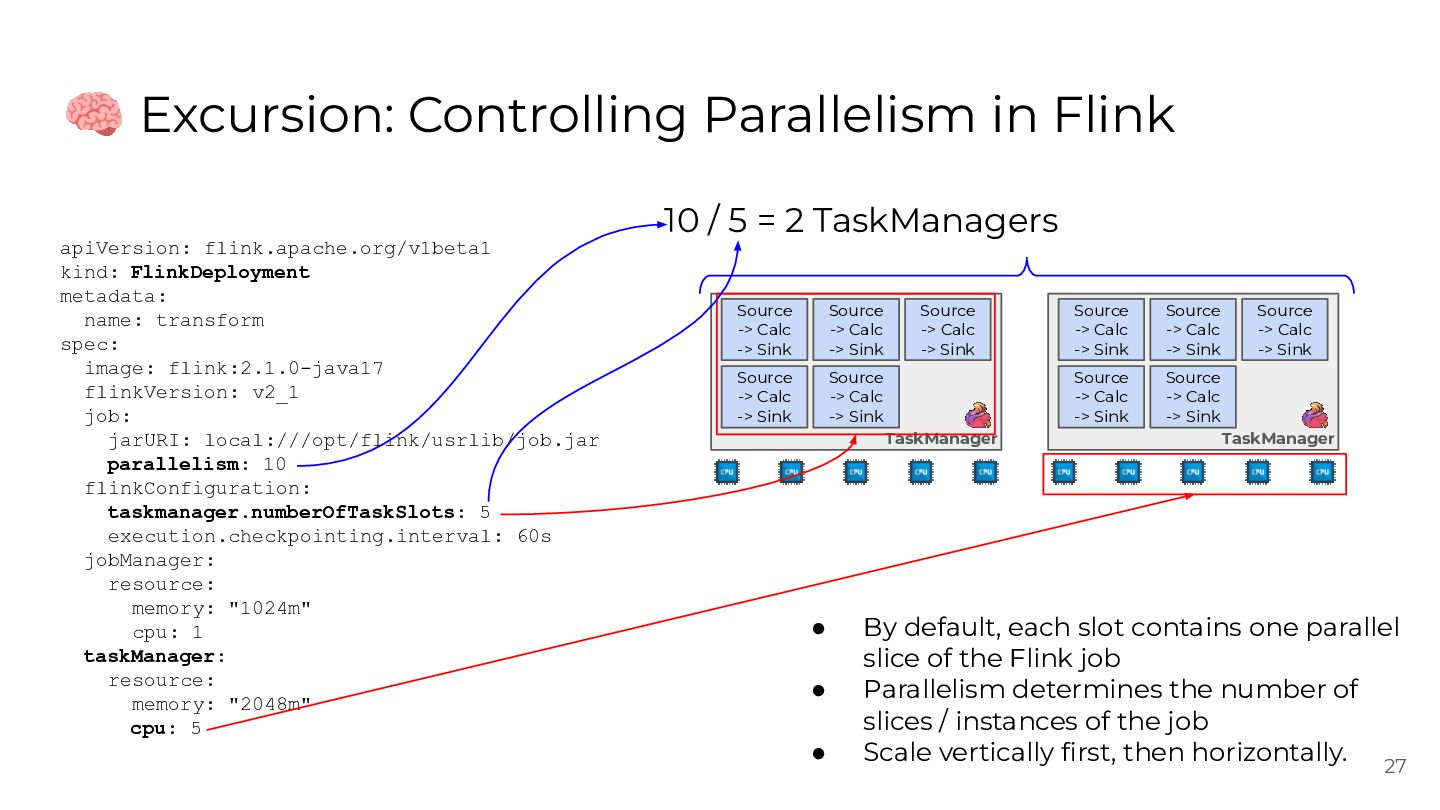
  23. 🧠 Excursion: Controlling Parallelism in Flink 10 / 5 =

    2 TaskManagers apiVersion: flink.apache.org/v1beta1 kind: FlinkDeployment metadata: name: transform spec: image: flink:2.1.0-java17 flinkVersion: v2_1 job: jarURI: local:///opt/flink/usrlib/job.jar parallelism: 10 flinkConfiguration: taskmanager.numberOfTaskSlots: 5 execution.checkpointing.interval: 60s jobManager: resource: memory: "1024m" cpu: 1 taskManager: resource: memory: "2048m" cpu: 5 Source -> Calc -> Sink Source -> Calc -> Sink Source -> Calc -> Sink Source -> Calc -> Sink Source -> Calc -> Sink TaskManager • • • Source -> Calc -> Sink Source -> Calc -> Sink Source -> Calc -> Sink Source -> Calc -> Sink Source -> Calc -> Sink TaskManager By default, each slot contains one parallel slice of the Flink job Parallelism determines the number of slices / instances of the job Scale vertically first, then horizontally. 27
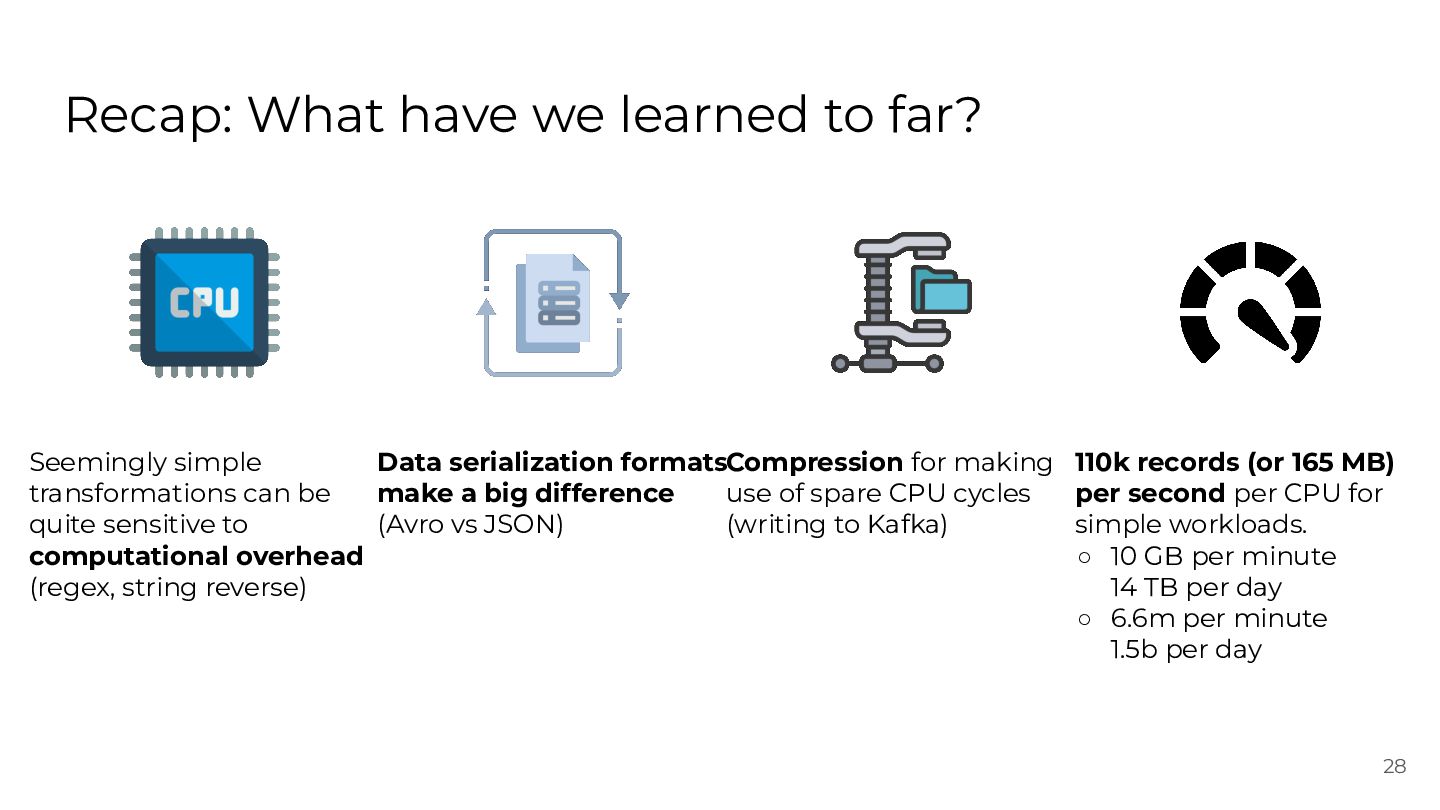
  24. Recap: What have we learned to far? Seemingly simple Data

    serialization formatsCompression for making transformations can be make a big difference use of spare CPU cycles quite sensitive to (Avro vs JSON) (writing to Kafka) computational overhead (regex, string reverse) 110k records (or 165 MB) per second per CPU for simple workloads. ◦ 10 GB per minute 14 TB per day ◦ 6.6m per minute 1.5b per day 28
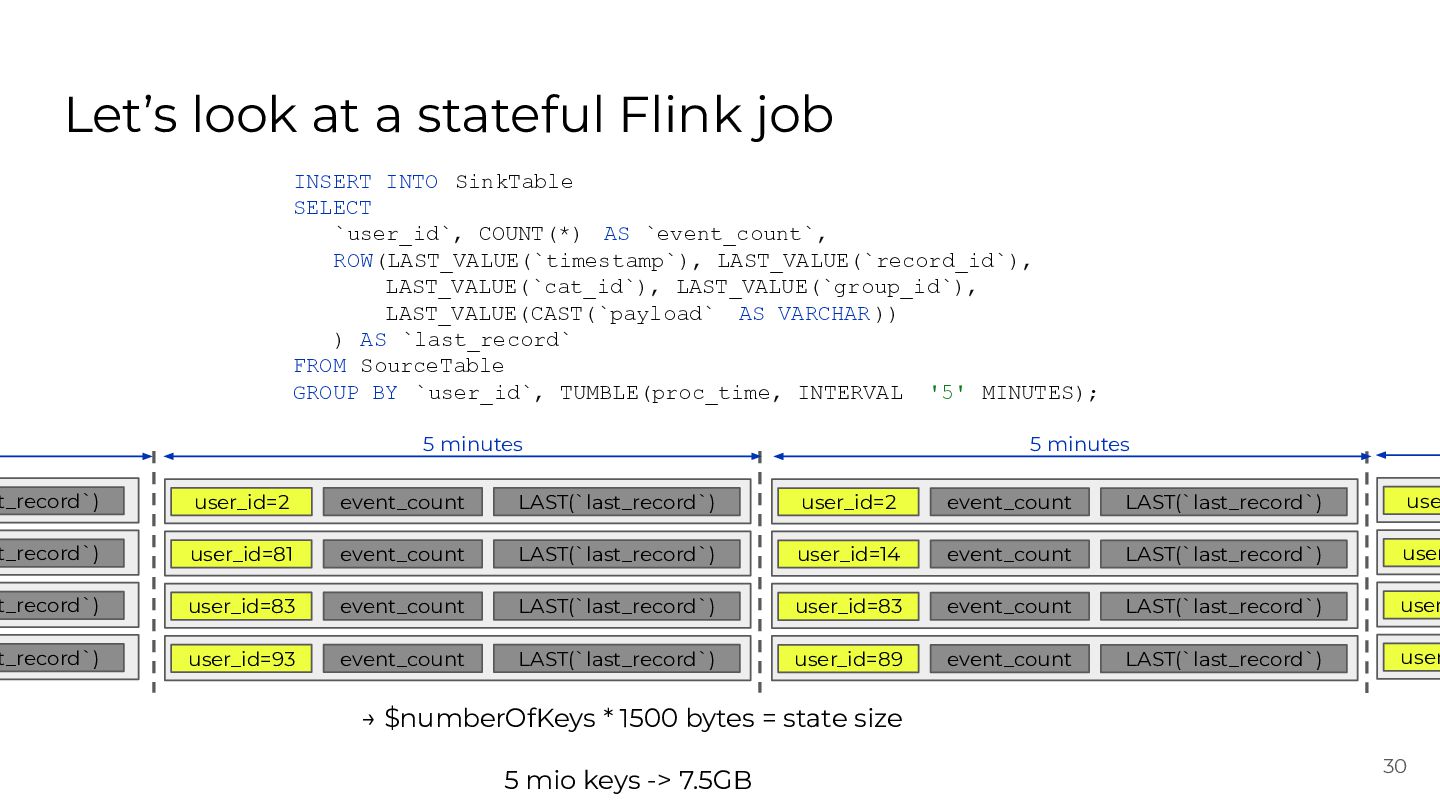
  25. Let’s look at a stateful Flink job INSERT INTO SinkTable

    SELECT `user_id`, COUNT(*) AS `event_count`, ROW(LAST_VALUE(`timestamp`), LAST_VALUE(`record_id`), LAST_VALUE(`cat_id`), LAST_VALUE(`group_id`), LAST_VALUE(CAST(`payload` AS VARCHAR )) ) AS `last_record` FROM SourceTable GROUP BY `user_id`, TUMBLE(proc_time, INTERVAL '5' MINUTES); 5 minutes 5 minutes t_record`) user_id=2 event_count LAST(`last_record`) user_id=2 event_count LAST(`last_record`) use t_record`) user_id=81 event_count LAST(`last_record`) user_id=14 event_count LAST(`last_record`) user t_record`) user_id=83 event_count LAST(`last_record`) user_id=83 event_count LAST(`last_record`) user t_record`) user_id=93 event_count LAST(`last_record`) user_id=89 event_count LAST(`last_record`) user → $numberOfKeys * 1500 bytes = state size 5 mio keys -> 7.5GB 30
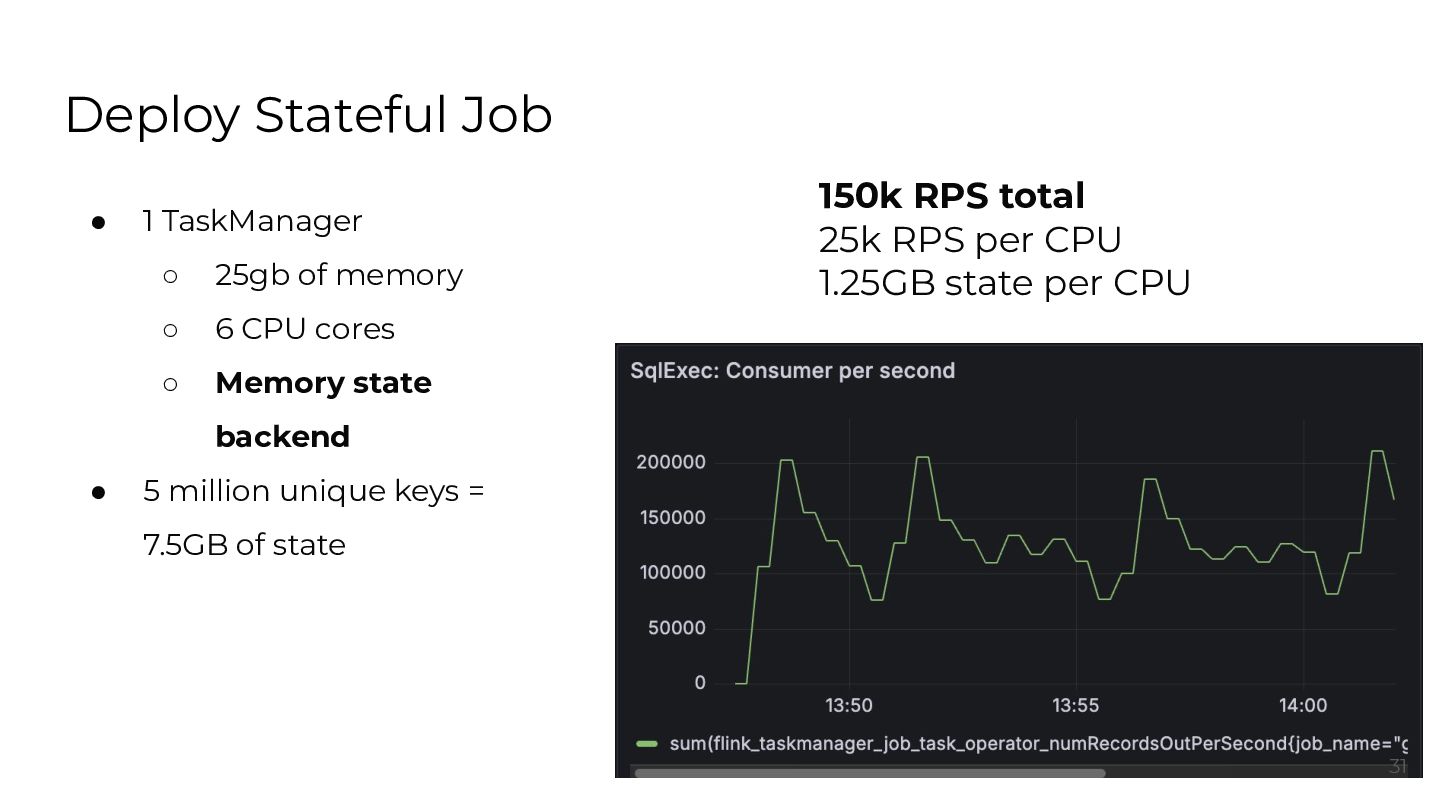
  26. Deploy Stateful Job • 1 TaskManager ◦ 25gb of memory

    ◦ 6 CPU cores ◦ Memory state 150k RPS total 25k RPS per CPU 1.25GB state per CPU backend • 5 million unique keys = 7.5GB of state 31
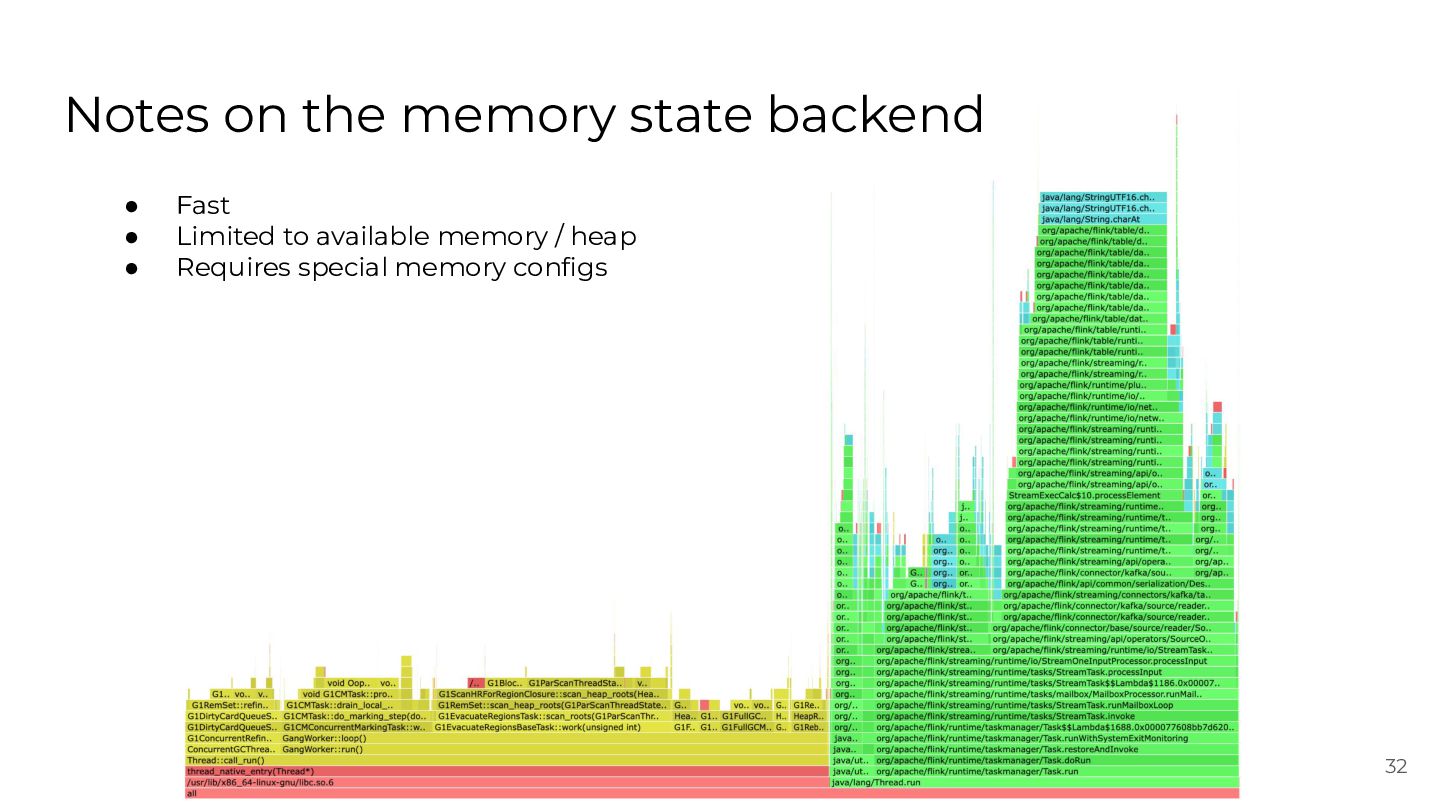
  27. Notes on the memory state backend • • • Fast

    Limited to available memory / heap Requires special memory configs 32
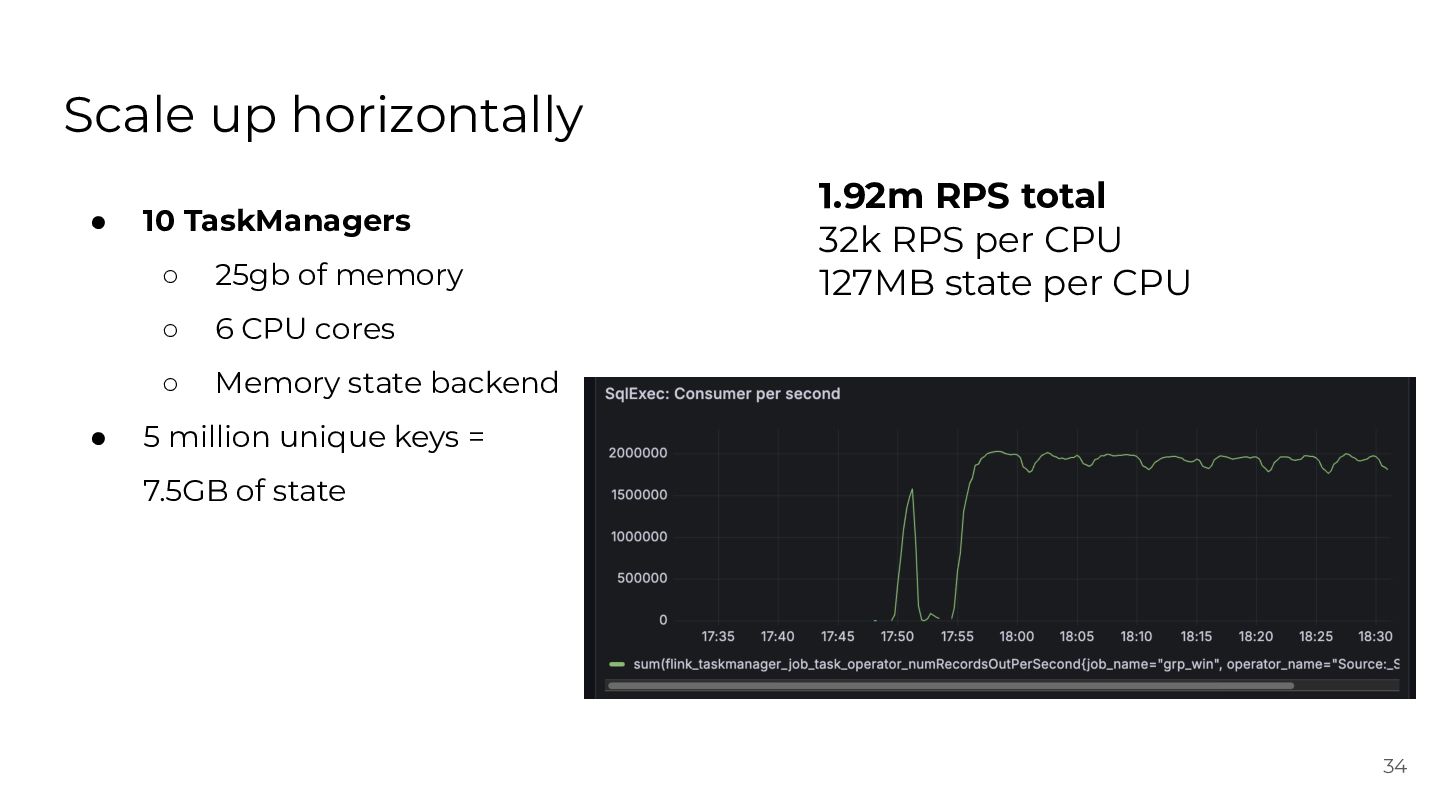
  28. Scale up horizontally • • 10 TaskManagers ◦ 25gb of

    memory ◦ 6 CPU cores ◦ Memory state backend 1.92m RPS total 32k RPS per CPU 127MB state per CPU 5 million unique keys = 7.5GB of state 34
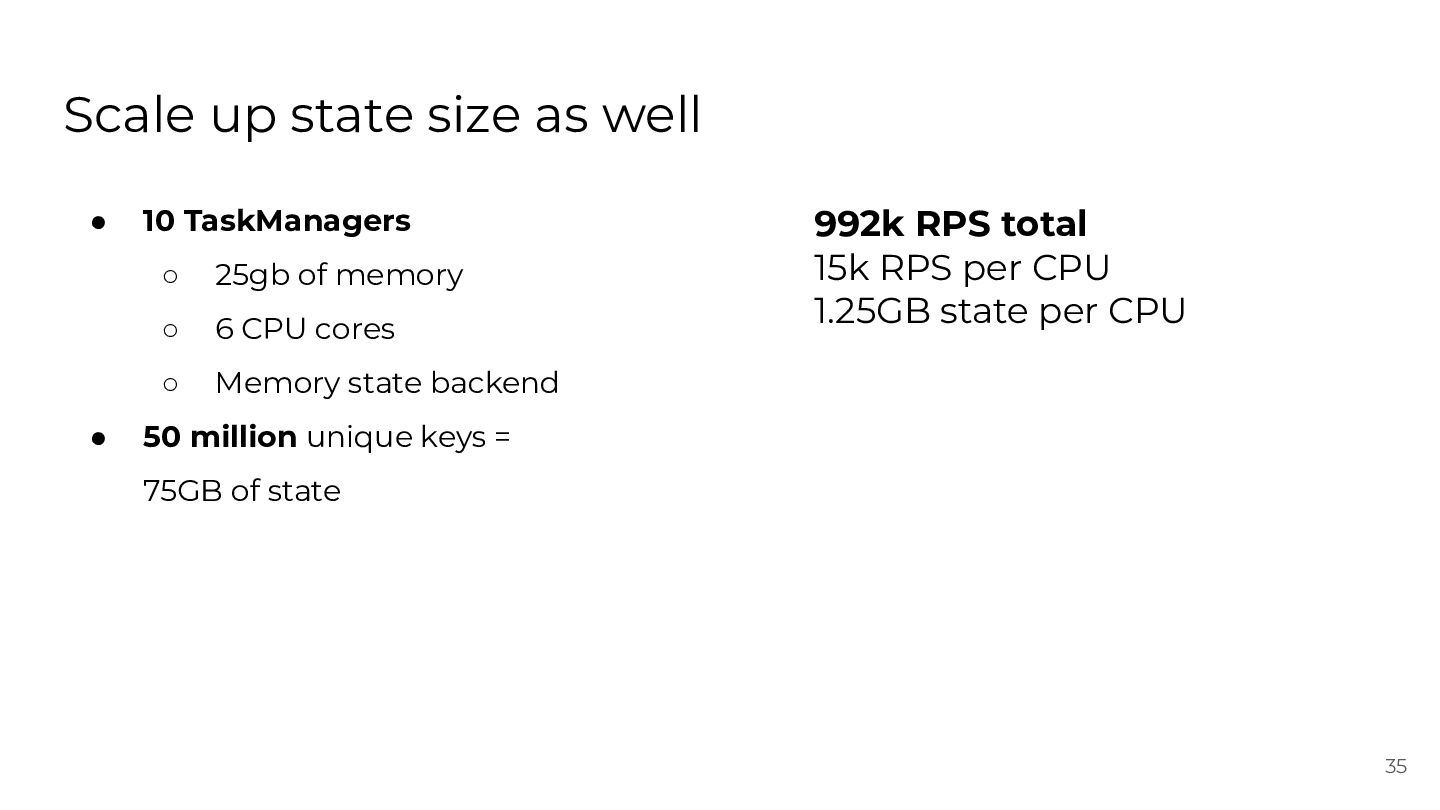
  29. Scale up state size as well • • 10 TaskManagers

    ◦ 25gb of memory ◦ 6 CPU cores ◦ Memory state backend 992k RPS total 15k RPS per CPU 1.25GB state per CPU 50 million unique keys = 75GB of state 35
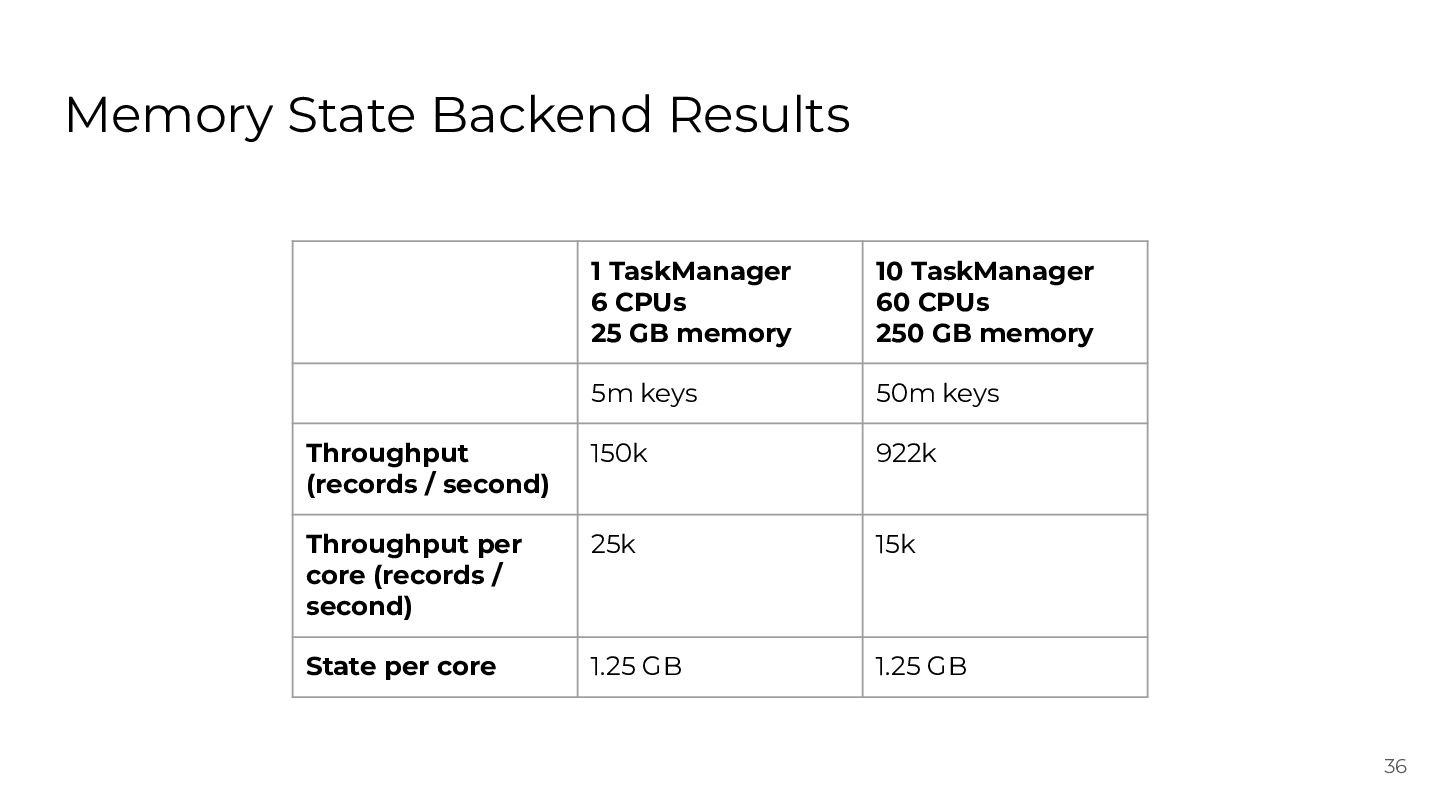
  30. Memory State Backend Results 1 TaskManager 6 CPUs 25 GB

    memory 10 TaskManager 60 CPUs 250 GB memory 5m keys 50m keys Throughput (records / second) 150k 922k Throughput per core (records / second) 25k 15k State per core 1.25 GB 1.25 GB 36
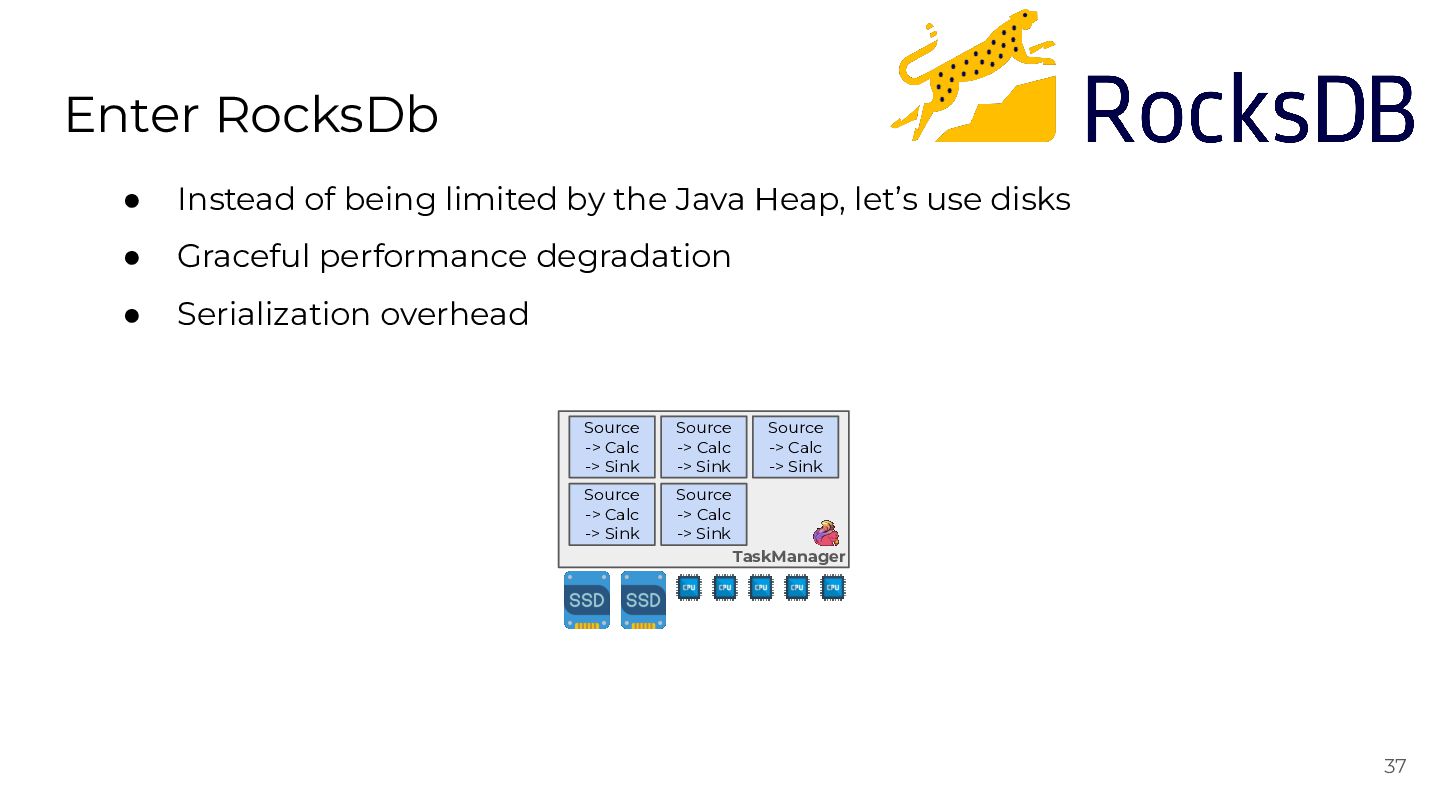
  31. Enter RocksDb • Instead of being limited by the Java

    Heap, let’s use disks • Graceful performance degradation • Serialization overhead Source -> Calc -> Sink Source -> Calc -> Sink Source -> Calc -> Sink Source -> Calc -> Sink Source -> Calc -> Sink TaskManager 37
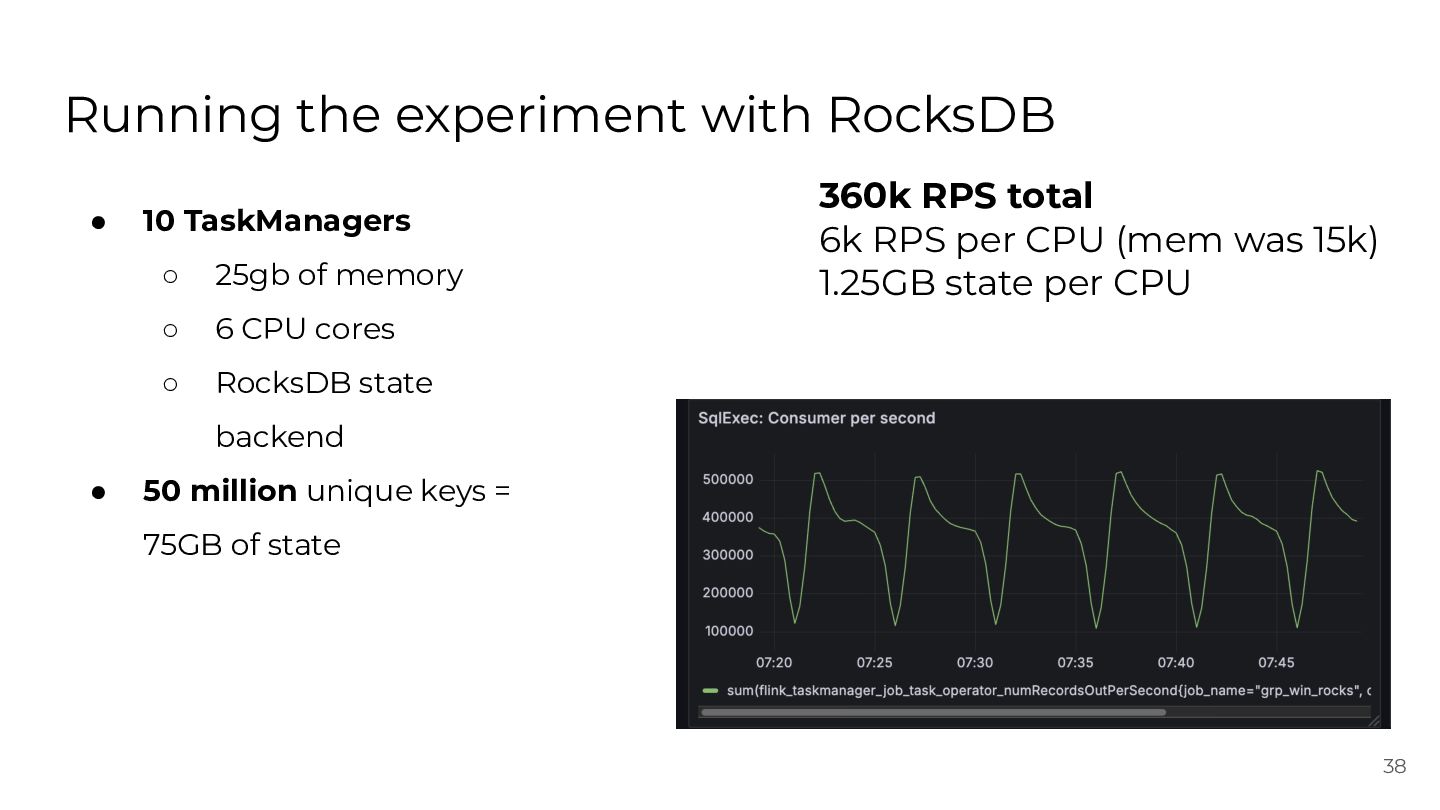
  32. Running the experiment with RocksDB • 10 TaskManagers ◦ 25gb

    of memory ◦ 6 CPU cores ◦ RocksDB state 360k RPS total 6k RPS per CPU (mem was 15k) 1.25GB state per CPU backend • 50 million unique keys = 75GB of state 38
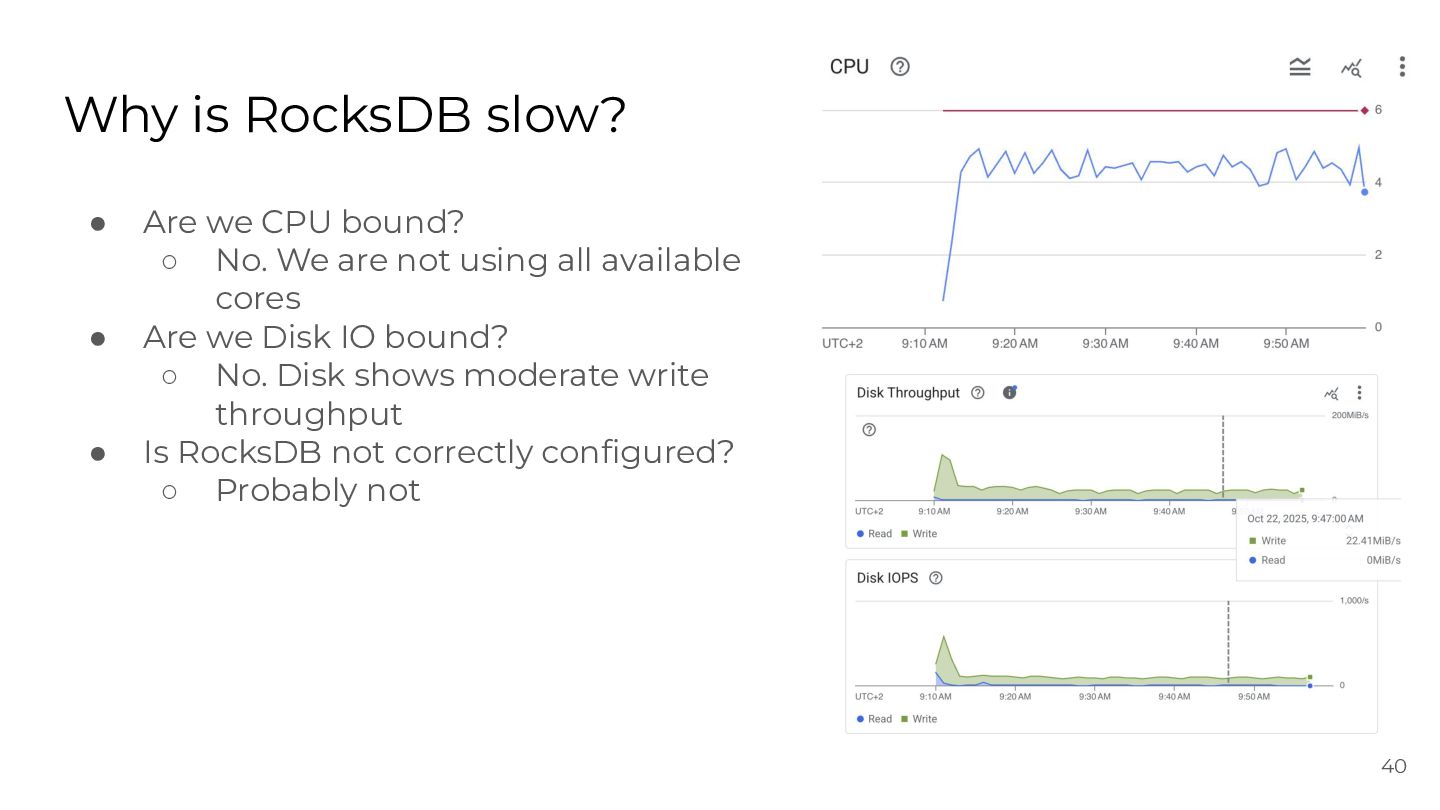
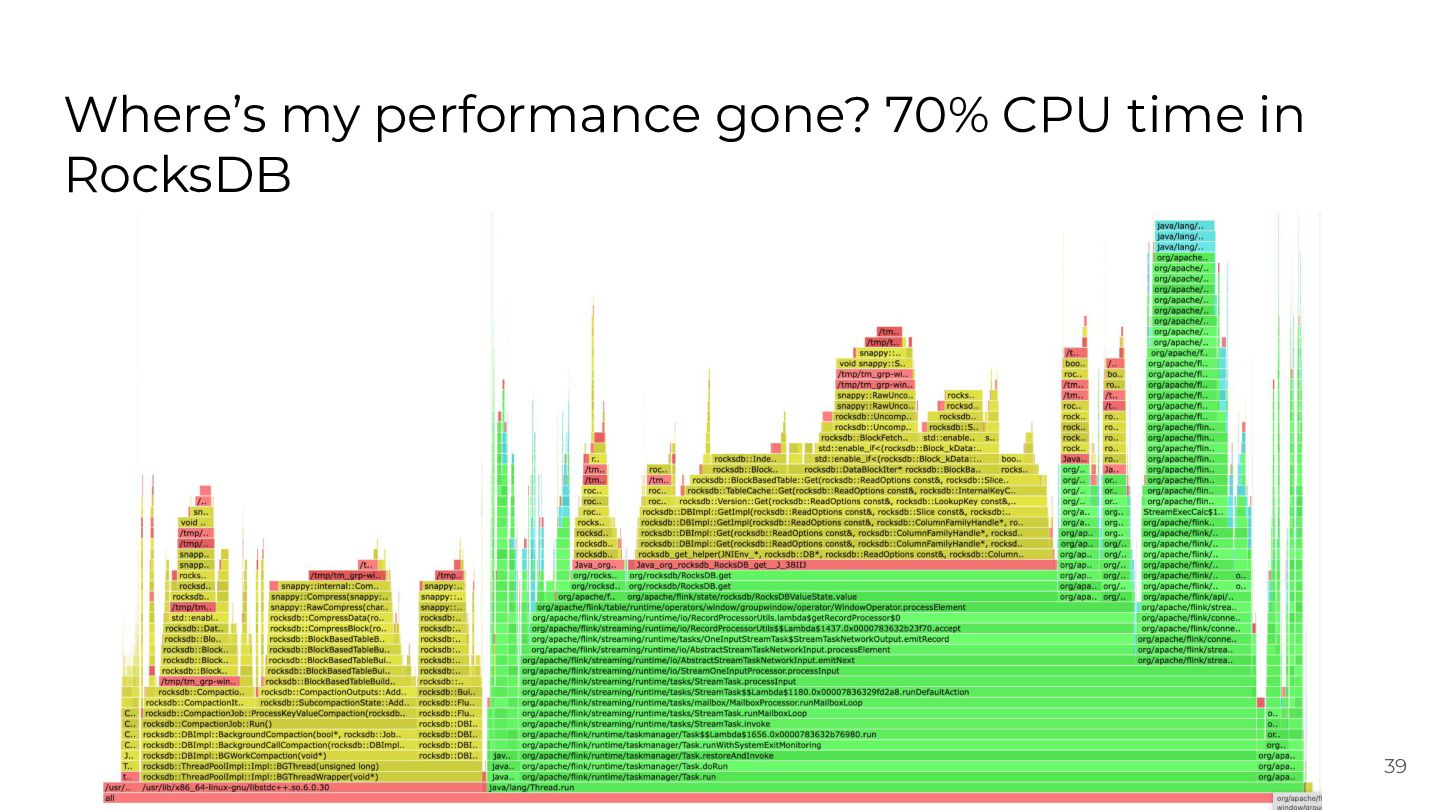
  33. Why is RocksDB slow? • • • Are we CPU

    bound? ◦ No. We are not using all available cores Are we Disk IO bound? ◦ No. Disk shows moderate write throughput Is RocksDB not correctly configured? ◦ Probably not 40
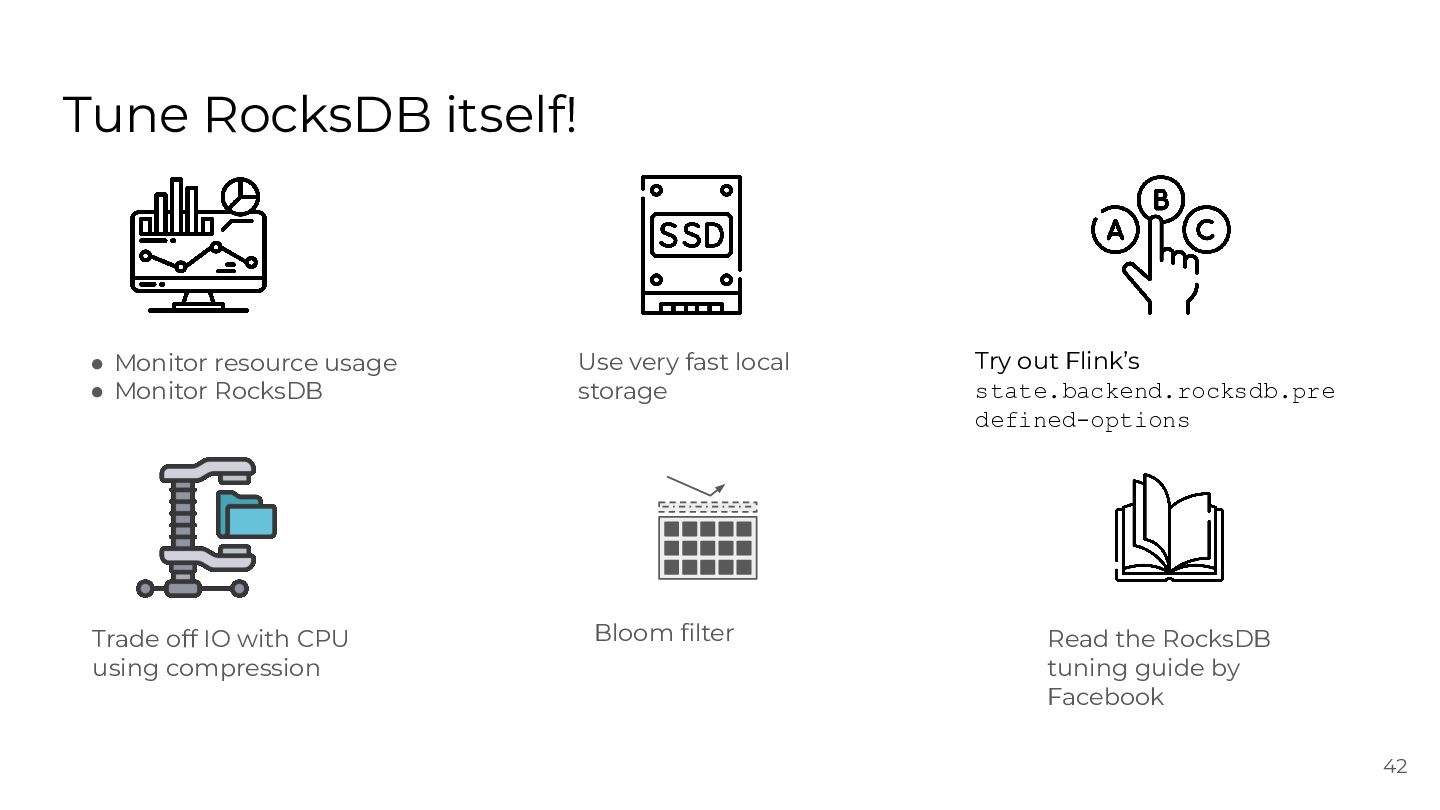
  34. Tune RocksDB itself! • Monitor resource usage • Monitor RocksDB

    Use very fast local storage Trade off IO with CPU using compression Bloom filter Try out Flink’s state.backend.rocksdb.pre defined-options Read the RocksDB tuning guide by Facebook 42
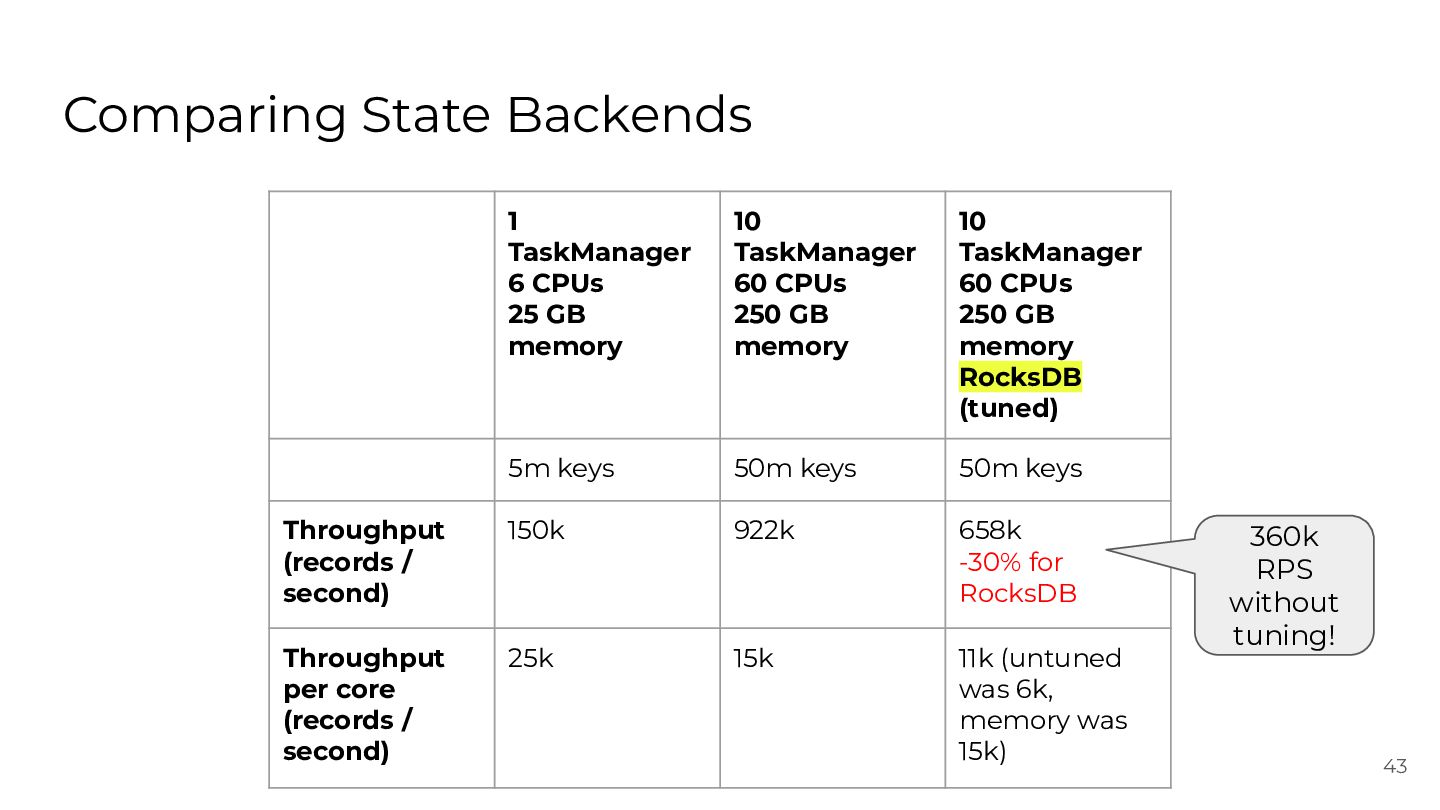
  35. Comparing State Backends 1 TaskManager 6 CPUs 25 GB memory

    10 TaskManager 60 CPUs 250 GB memory 10 TaskManager 60 CPUs 250 GB memory RocksDB (tuned) 5m keys 50m keys 50m keys Throughput (records / second) 150k 922k 658k -30% for RocksDB Throughput per core (records / second) 25k 15k 11k (untuned was 6k, memory was 15k) 360k RPS without tuning! 43
  36. 44

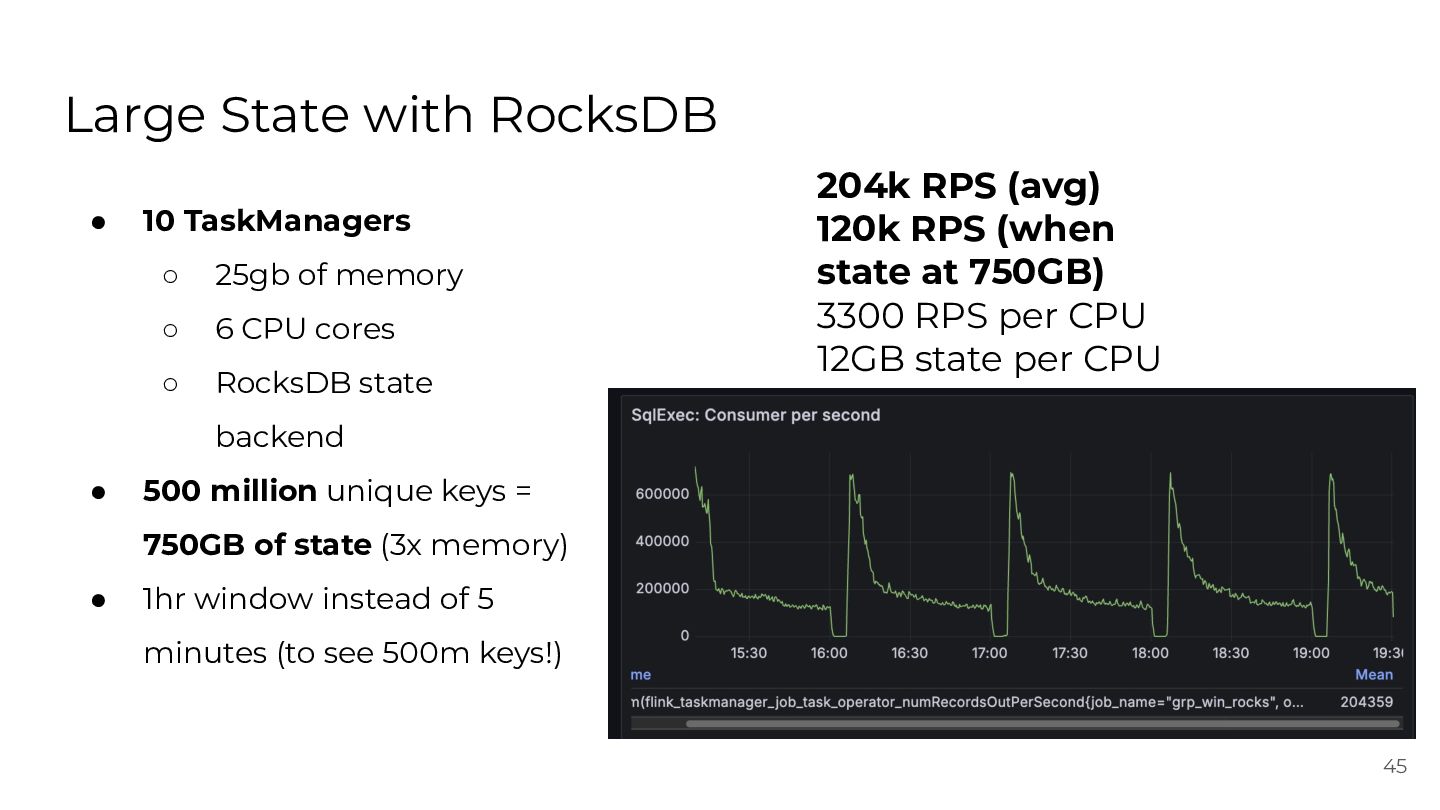
  37. Large State with RocksDB • 10 TaskManagers ◦ 25gb of

    memory ◦ 6 CPU cores ◦ RocksDB state 204k RPS (avg) 120k RPS (when state at 750GB) 3300 RPS per CPU 12GB state per CPU backend • 500 million unique keys = 750GB of state (3x memory) • 1hr window instead of 5 minutes (to see 500m keys!) 45
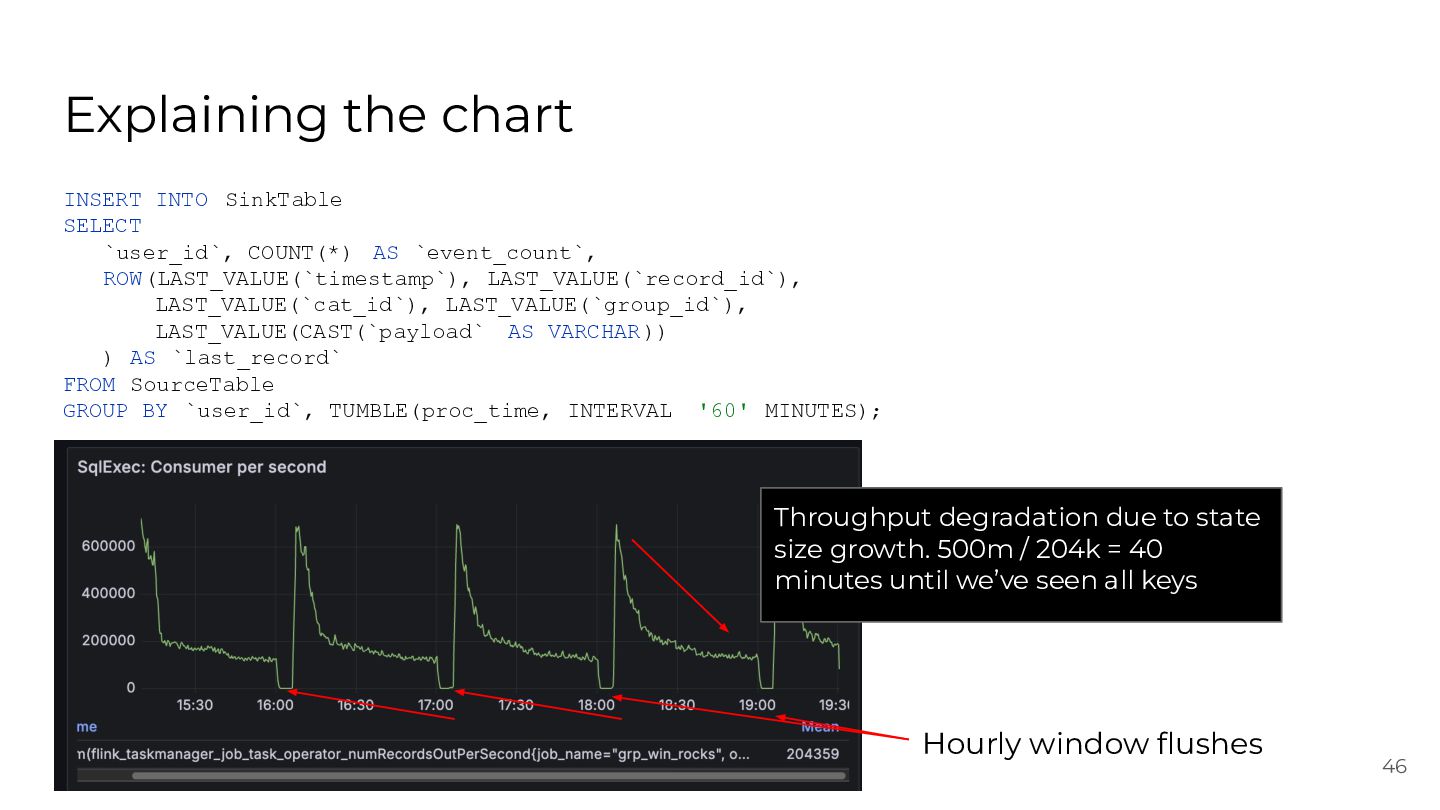
  38. Explaining the chart INSERT INTO SinkTable SELECT `user_id`, COUNT(*) AS

    `event_count`, ROW(LAST_VALUE(`timestamp`), LAST_VALUE(`record_id`), LAST_VALUE(`cat_id`), LAST_VALUE(`group_id`), LAST_VALUE(CAST(`payload` AS VARCHAR )) ) AS `last_record` FROM SourceTable GROUP BY `user_id`, TUMBLE(proc_time, INTERVAL '60' MINUTES); Throughput degradation due to state size growth. 500m / 204k = 40 minutes until we’ve seen all keys Hourly window flushes 46
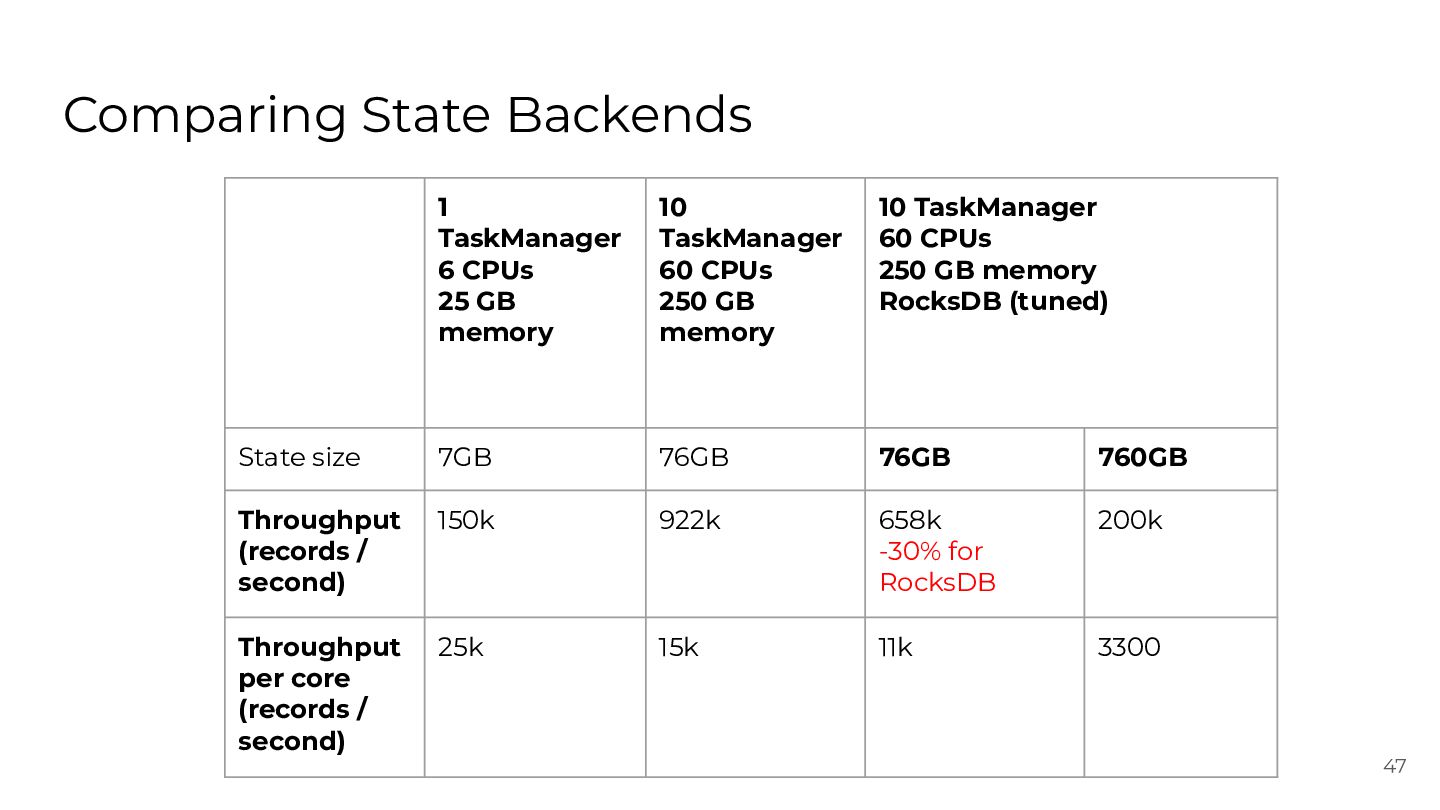
  39. Comparing State Backends 1 TaskManager 6 CPUs 25 GB memory

    10 TaskManager 60 CPUs 250 GB memory 10 TaskManager 60 CPUs 250 GB memory RocksDB (tuned) State size 7GB 76GB 76GB 760GB Throughput (records / second) 150k 922k 658k -30% for RocksDB 200k Throughput per core (records / second) 25k 15k 11k 3300 47
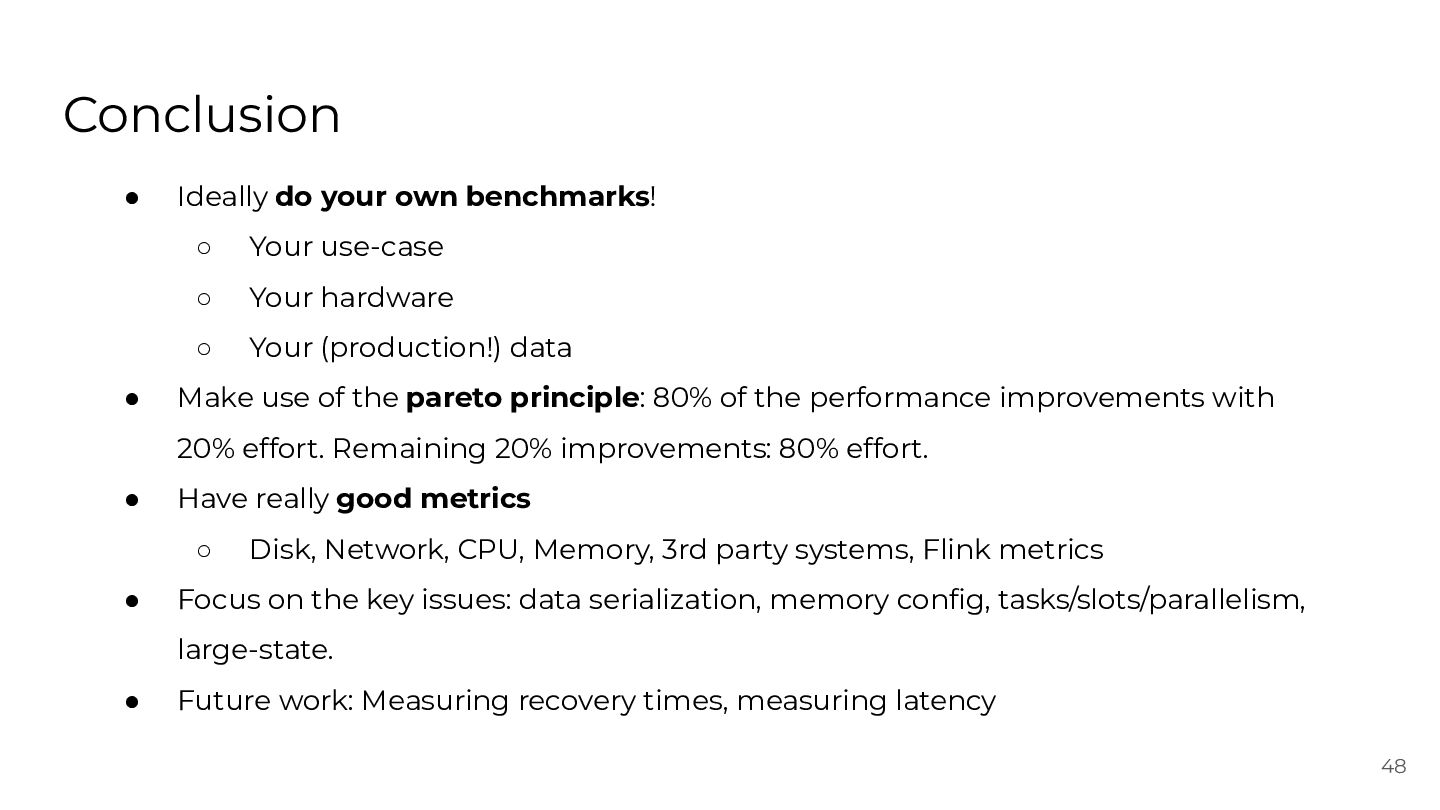
  40. Conclusion • • Ideally do your own benchmarks! ◦ Your

    use-case ◦ Your hardware ◦ Your (production!) data Make use of the pareto principle: 80% of the performance improvements with 20% effort. Remaining 20% improvements: 80% effort. • Have really good metrics ◦ • Disk, Network, CPU, Memory, 3rd party systems, Flink metrics Focus on the key issues: data serialization, memory config, tasks/slots/parallelism, large-state. • Future work: Measuring recovery times, measuring latency 48
  41. THE END Sizing, Benchmarking and Performance Tuning Apache Flink Clusters

    Add me on LinkedIn Robert Metzger Principal Software Engineer @ Confluent Committer and PMC @ Apache Flink [email protected]