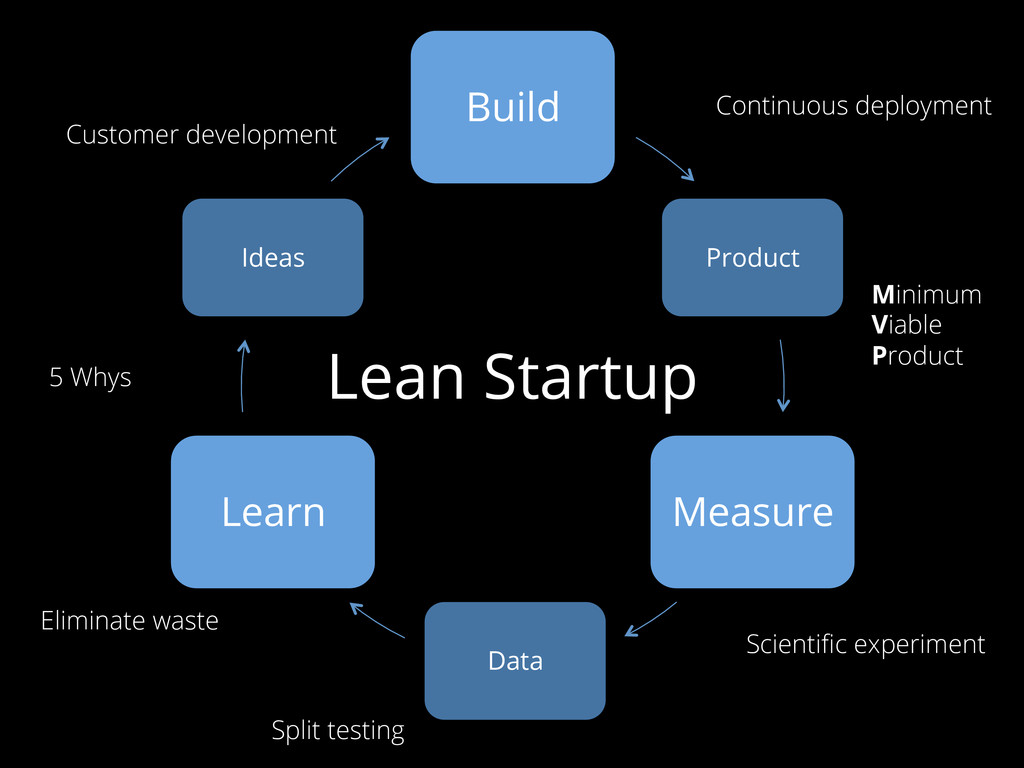
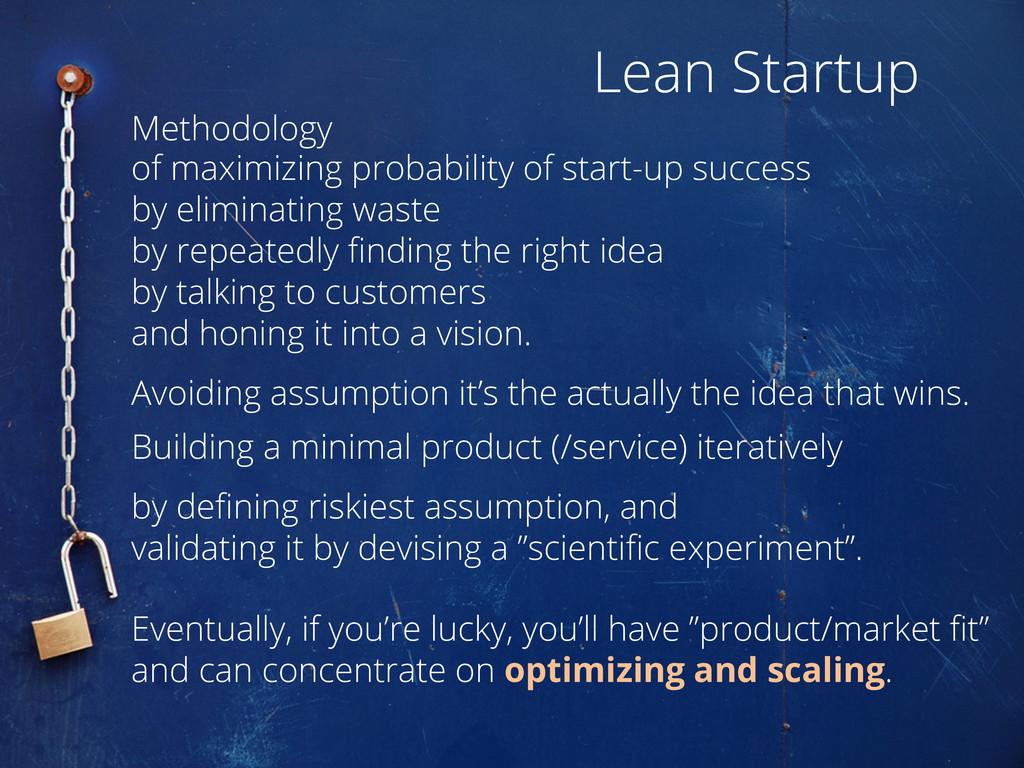
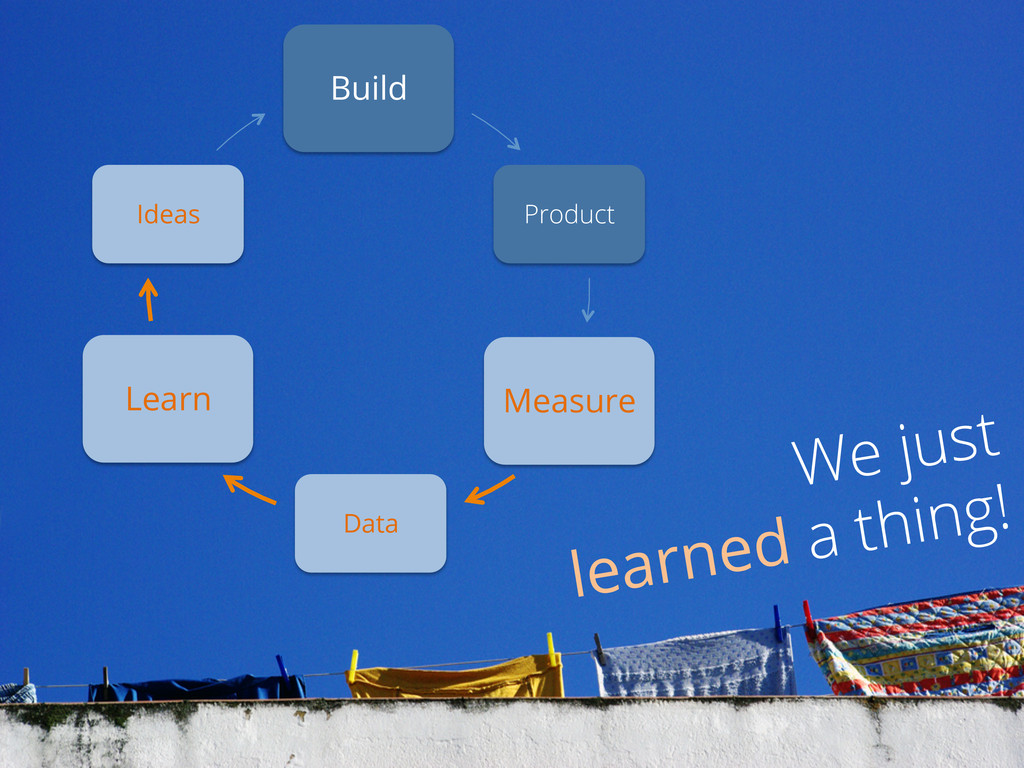
by repeatedly finding the right idea by talking to customers and honing it into a vision. Avoiding assumption it’s the actually the idea that wins. Lean Startup
by repeatedly finding the right idea by talking to customers and honing it into a vision. Avoiding assumption it’s the actually the idea that wins. Building a minimal product (/service) iteratively Lean Startup
by repeatedly finding the right idea by talking to customers and honing it into a vision. Avoiding assumption it’s the actually the idea that wins. Building a minimal product (/service) iteratively by defining riskiest assumption Lean Startup
eliminating waste by repeatedly finding the right idea by talking to customers and honing it into a vision. Avoiding assumption it’s the actually the idea that wins. Building a minimal product (/service) iteratively by defining riskiest assumption, and validating it by devising a ”scientific experiment”.
eliminating waste by repeatedly finding the right idea by talking to customers and honing it into a vision. Avoiding assumption it’s the actually the idea that wins. Building a minimal product (/service) iteratively by defining riskiest assumption, and validating it by devising a ”scientific experiment”. Eventually, if you’re lucky
eliminating waste by repeatedly finding the right idea by talking to customers and honing it into a vision. Avoiding assumption it’s the actually the idea that wins. Building a minimal product (/service) iteratively by defining riskiest assumption, and validating it by devising a ”scientific experiment”. Eventually, if you’re lucky, you’ll have ”product/market fit”
eliminating waste by repeatedly finding the right idea by talking to customers and honing it into a vision. Avoiding assumption it’s the actually the idea that wins. Building a minimal product (/service) iteratively by defining riskiest assumption, and validating it by devising a ”scientific experiment”. Eventually, if you’re lucky, you’ll have ”product/market fit” and can concentrate on optimizing and scaling.
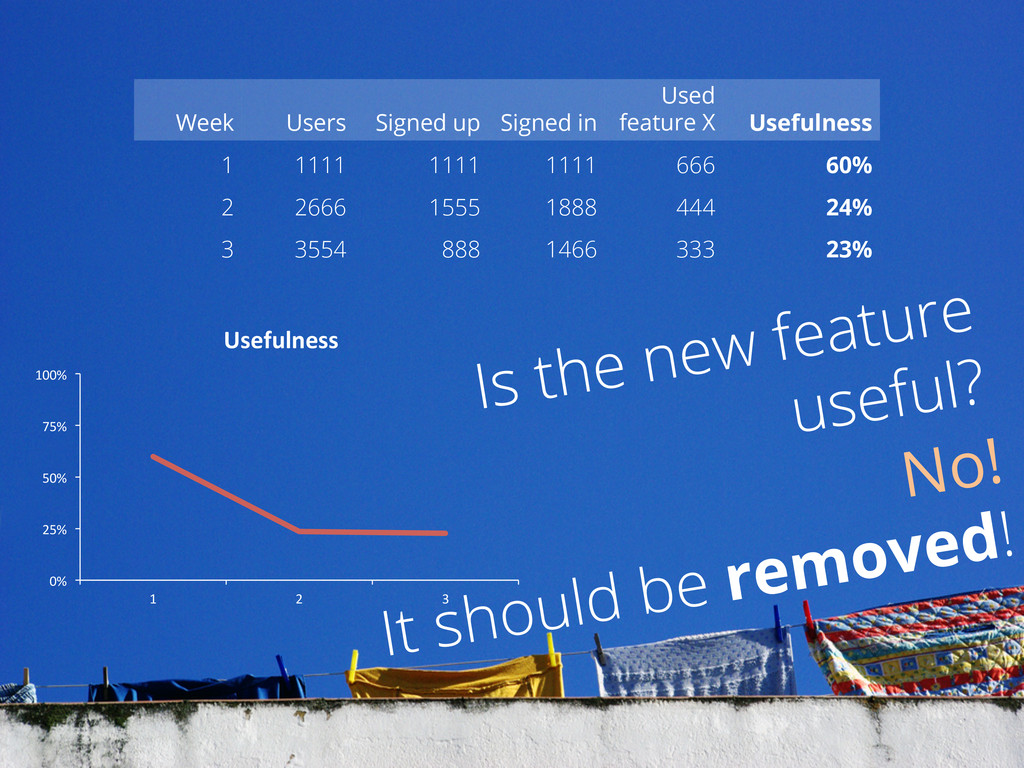
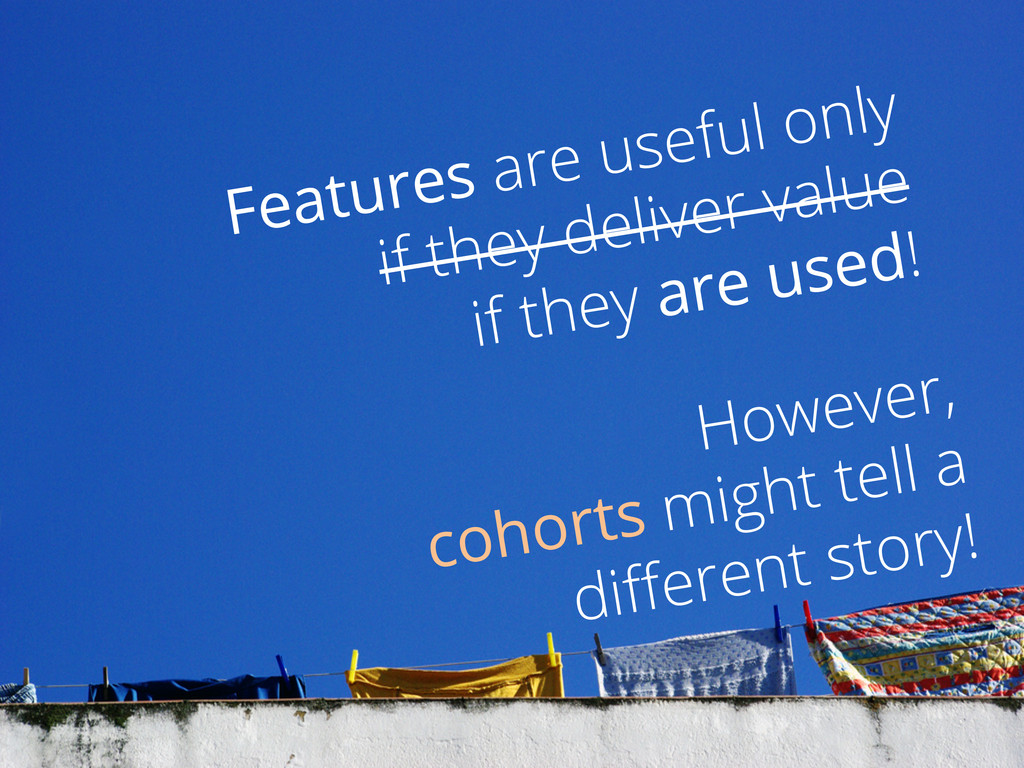
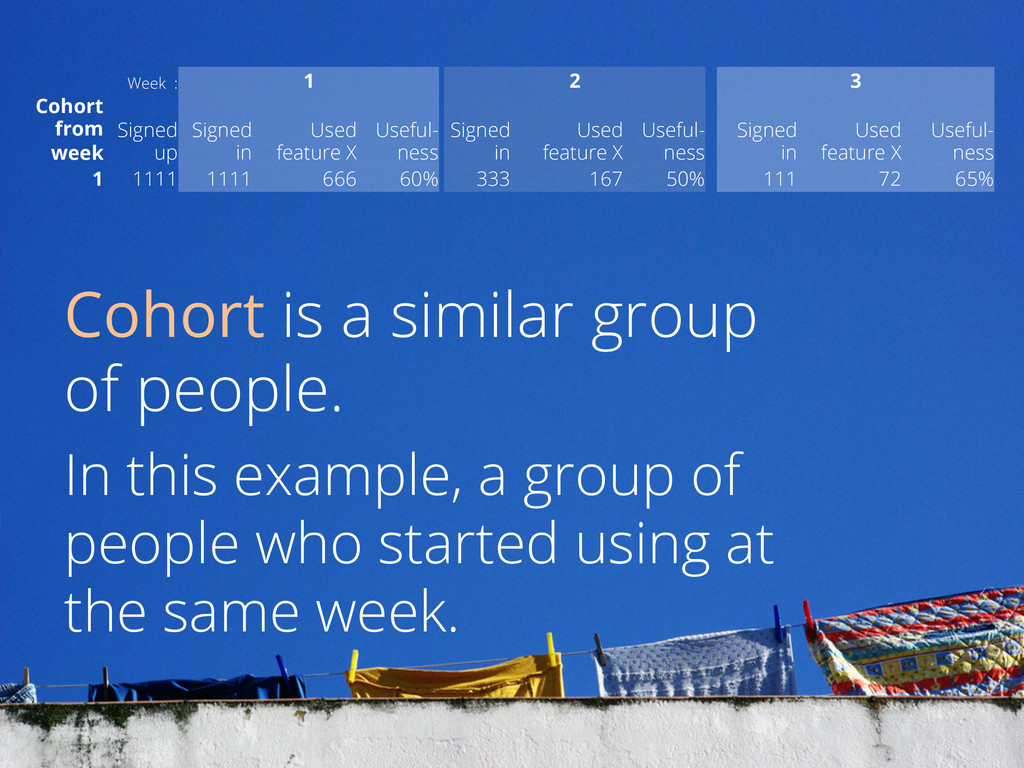
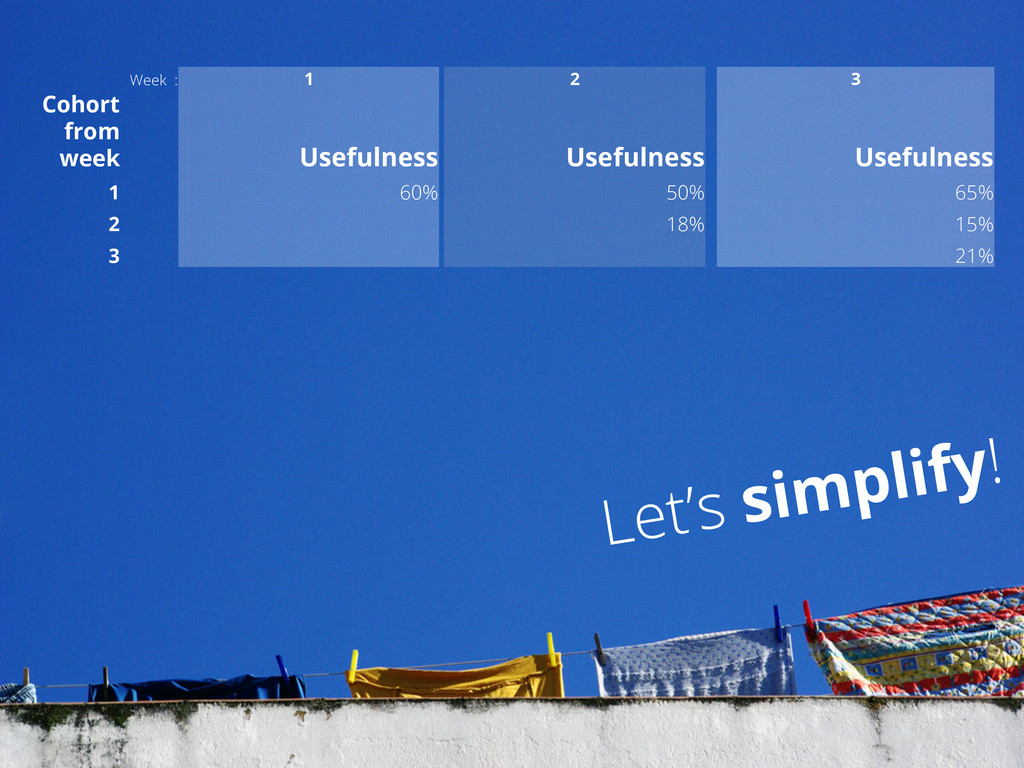
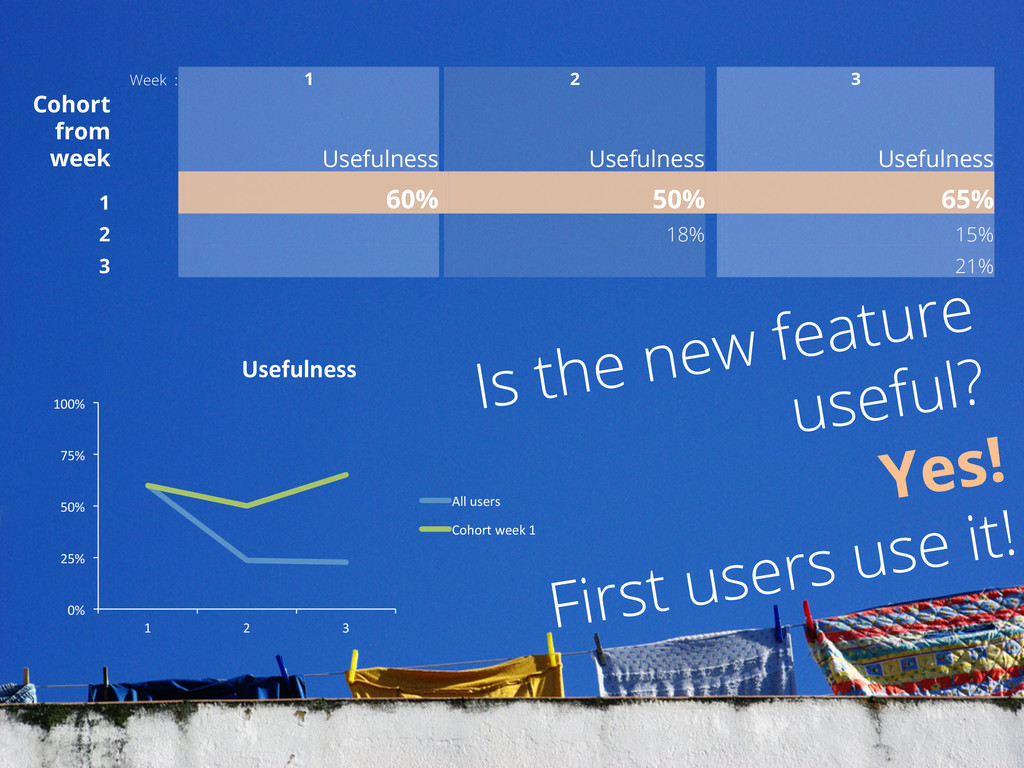
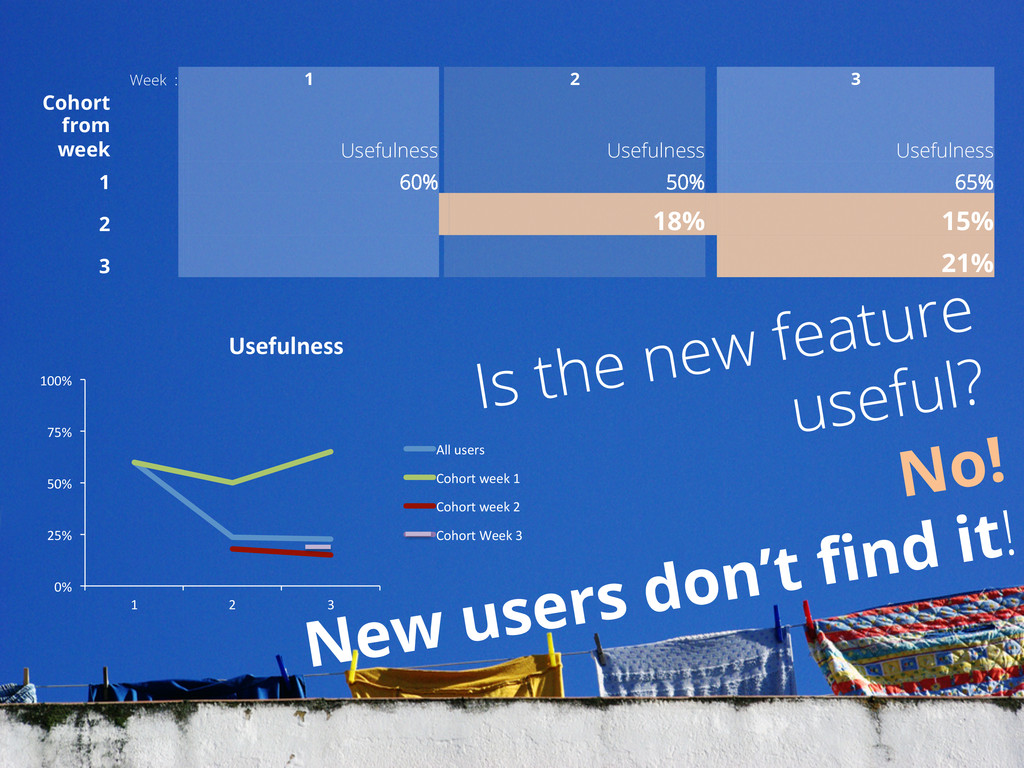
a group of people who started using at the same week. Week : 1 2 3 Cohort from week Signed up Signed in Used feature X Useful- ness Signed in Used feature X Useful- ness Signed in Used feature X Useful- ness 1 1111 1111 666 60% 333 167 50% 111 72 65% 2 1555 1555 277 18% 467 70 15% 3 888 888 191 21% Sums: 3554 1111 666 1888 444 1466 333
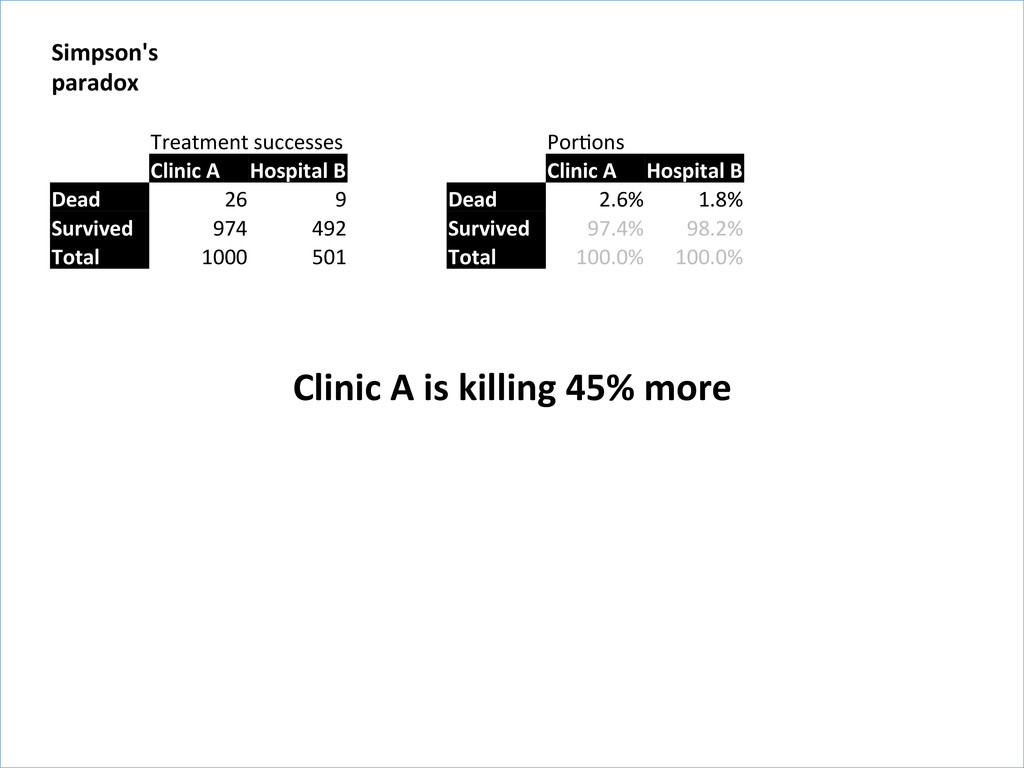
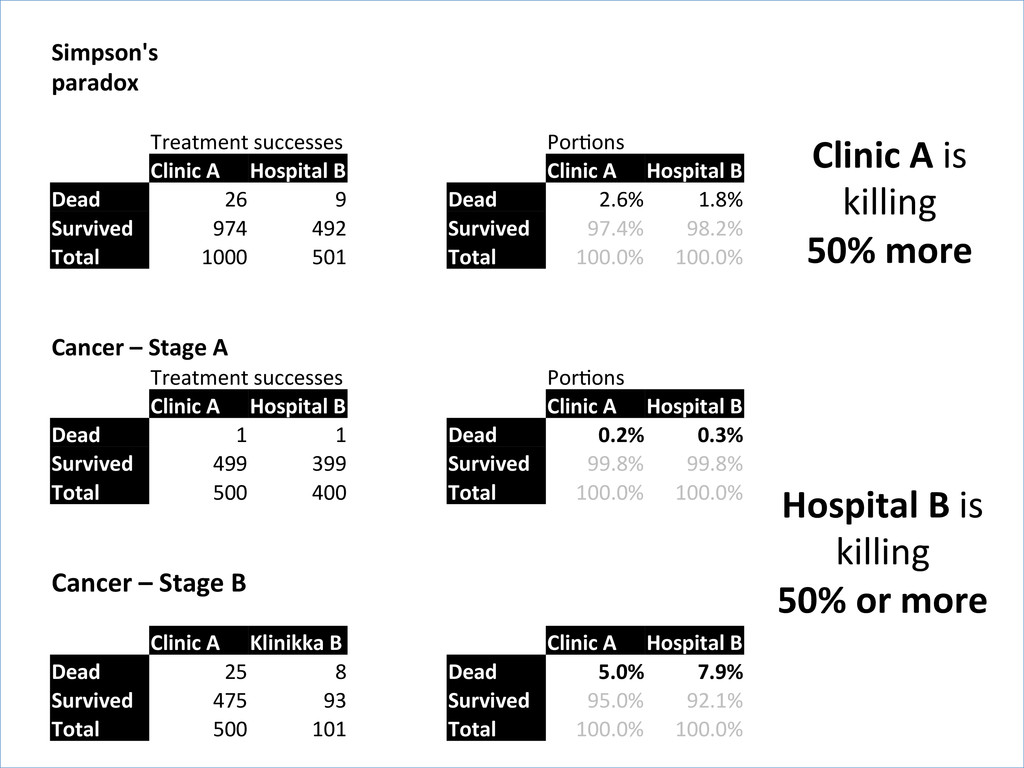
Treatment successes PorBons Clinic A Hospital B Clinic A Hospital B Dead 26 9 Dead 2.6% 1.8% Survived 974 492 Survived 97.4% 98.2% Total 1000 501 Total 100.0% 100.0%
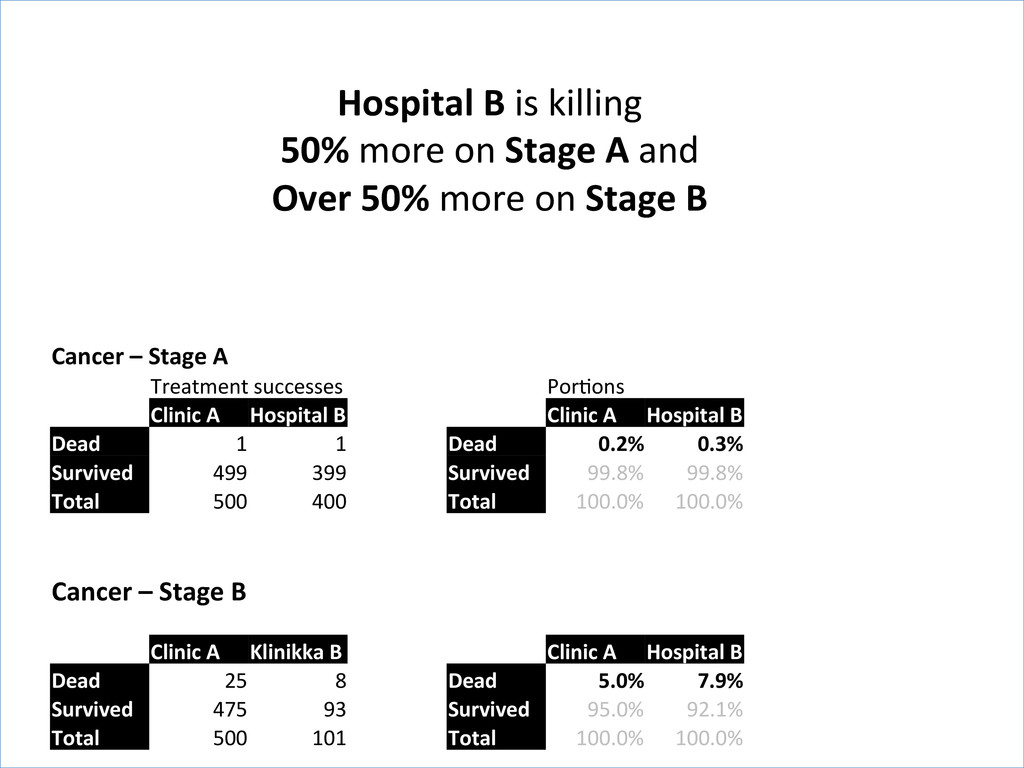
Clinic A Hospital B Clinic A Hospital B Dead 1 1 Dead 0.2% 0.3% Survived 499 399 Survived 99.8% 99.8% Total 500 400 Total 100.0% 100.0% Cancer – Stage B Clinic A Klinikka B Clinic A Hospital B Dead 25 8 Dead 5.0% 7.9% Survived 475 93 Survived 95.0% 92.1% Total 500 101 Total 100.0% 100.0% Hospital B is killing 50% more on Stage A and Over 50% more on Stage B
A Hospital B Clinic A Hospital B Dead 26 9 Dead 2.6% 1.8% Survived 974 492 Survived 97.4% 98.2% Total 1000 501 Total 100.0% 100.0% Cancer – Stage A Treatment successes PorBons Clinic A Hospital B Clinic A Hospital B Dead 1 1 Dead 0.2% 0.3% Survived 499 399 Survived 99.8% 99.8% Total 500 400 Total 100.0% 100.0% Cancer – Stage B Clinic A Klinikka B Clinic A Hospital B Dead 25 8 Dead 5.0% 7.9% Survived 475 93 Survived 95.0% 92.1% Total 500 101 Total 100.0% 100.0% Hospital B is killing 50% or more Clinic A is killing 50% more
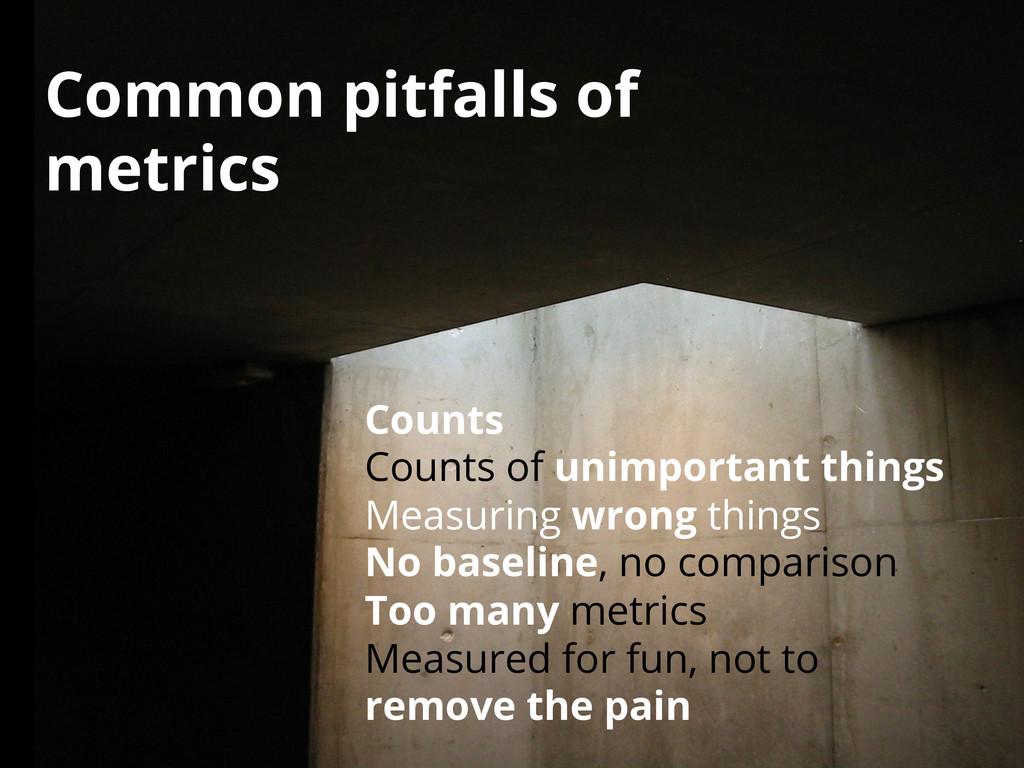
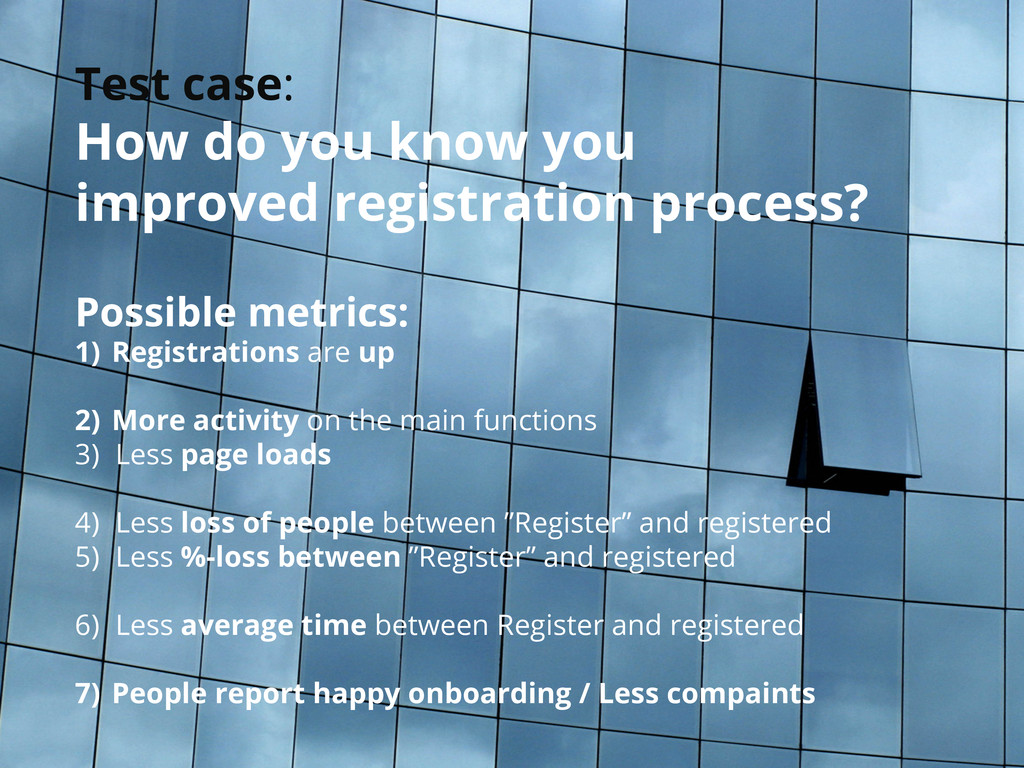
Possible metrics: 1) Registrations are up 2) More activity on the main functions 3) Less page loads 4) Less loss of people between ”Register” and registered 5) Less %-loss between ”Register” and registered 6) Less average time between Register and registered 7) People report happy onboarding / Less compaints


 rossi
 fj_yoshimura_kosuke
 atalie2m
 tsukuboshi
 harutiro
 hatahata021
 takaha4k
 staka121
 shadowhat
 minorun365
 manabuseki
 oracle4engineer
 nicholsjasper
 jakevdp
 lindahogenes
 codingconduct
 rasmusluckow
 samtorres
 chrislema
 katiecoart
 aleyda
 madoxten
 sferik
 inesmontani
 baasie