Upgrade to Pro
— share decks privately, control downloads, hide ads and more …
Speaker Deck
Features
Speaker Deck
PRO
Sign in
Sign up for free
Search
Search
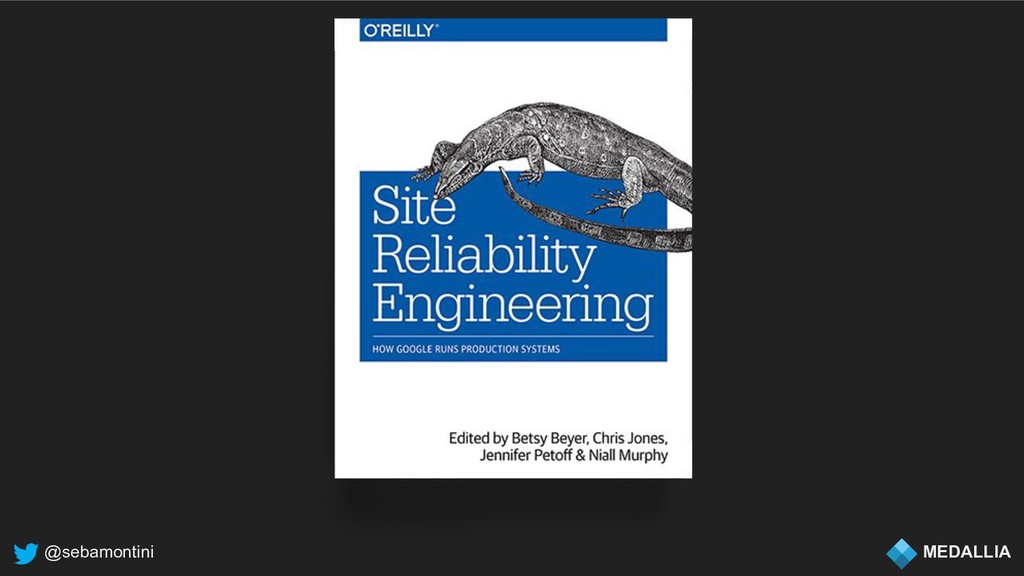
Monitoring is dead
Search
Sponsored
·
SiteGround - Reliable hosting with speed, security, and support you can count on.
→
Sebastian Montini
September 21, 2018
Technology
250
0
Share
Embed
Copy iframe code
Copy JS code
Copy link
Start on current slide
Monitoring is dead
Sebastian Montini
September 21, 2018
More Decks by Sebastian Montini
See All by Sebastian Montini
AWS Community Day BA 2019
sebamontini
0
88
Giraffe: our journey to support 1 million metrics per second
sebamontini
0
190
Nomad-PyCon2017
sebamontini
0
100
Atlas, a PaaS with batteries included
sebamontini
0
83
Nomad: The sequel
sebamontini
1
180
Nomad, a love story
sebamontini
0
170
Aurora: 5 Tb later ...
sebamontini
0
92
Ansible 202 - Sysarmy Meetup
sebamontini
0
110
Cloud Computing: All that glitters is not AWS - Nerdear.la 2016
sebamontini
0
72
Other Decks in Technology
See All in Technology
Data + AI Summit 2026 イベントレポート: 「AIがビジネスで意思決定するデータ基盤」へ
nek0128
0
150
CIで使うClaude
iwatatomoya
0
260
オブザーバビリティ、本当に活用できてる? 〜API連携×生成AIで成熟度を自動評価〜
dmmsre
1
3.2k
Devsumi 2026 Summer 人もAIも使える共通基盤を事業の加速装置にする~デザインシステム運用に学ぶ組織レバレッジ~ 渡辺 凌央
legalontechnologies
PRO
0
140
非定型なドキュメントを効率よくリファクタする 〜えぇ!?仕様書27本の移行が1日で終わったって!?〜
subroh0508
2
410
Claude Code公式skillで 自分の仕事を少しずつ手放そう!(Claude Code開発ノウハウ大公開スペシャル by クラスメソッド)
kaym
1
350
10年目を迎えた「ABEMA」がどのように AI 活用を推進して、AI 駆動開発にシフトしているのか / How ABEMA, entering its 10th year, is promoting the use of AI and shifting toward AI-driven development
miyukki
0
150
CDKで書くECSのベストプラクティス、 改めて考え直す2026 #cdkconf2026
makies
0
300
LLM/Agent評価:トップ営業の発言を「正解」にする 〜暗黙的正解による評価を営業資産に変える〜
takkuhiro
1
220
Claude Code 珍プレー好プレー
shinyasaita
0
330
誤解だらけの開発生産性 / Myths and Misconceptions about Developer Productivity
i35_267
2
600
Alphaモジュール使っていいのかい!?いけないのかい!?どっちなんだいっ!?
watany
1
140
Featured
See All Featured
Utilizing Notion as your number one productivity tool
mfonobong
4
390
GraphQLとの向き合い方2022年版
quramy
50
15k
We Are The Robots
honzajavorek
0
280
The World Runs on Bad Software
bkeepers
PRO
72
12k
Introduction to Domain-Driven Design and Collaborative software design
baasie
1
890
How to Think Like a Performance Engineer
csswizardry
28
2.7k
Navigating Team Friction
lara
192
16k
How to optimise 3,500 product descriptions for ecommerce in one day using ChatGPT
katarinadahlin
PRO
1
3.7k
Side Projects
sachag
455
43k
Large-scale JavaScript Application Architecture
addyosmani
515
110k
Building the Perfect Custom Keyboard
takai
2
810
Facilitating Awesome Meetings
lara
57
7k
Transcript
@sebamontini MEDALLIA Monitoring is Dead And why you’re (probably) doing
it wrong
@sebamontini MEDALLIA
@sebamontini MEDALLIA Why?
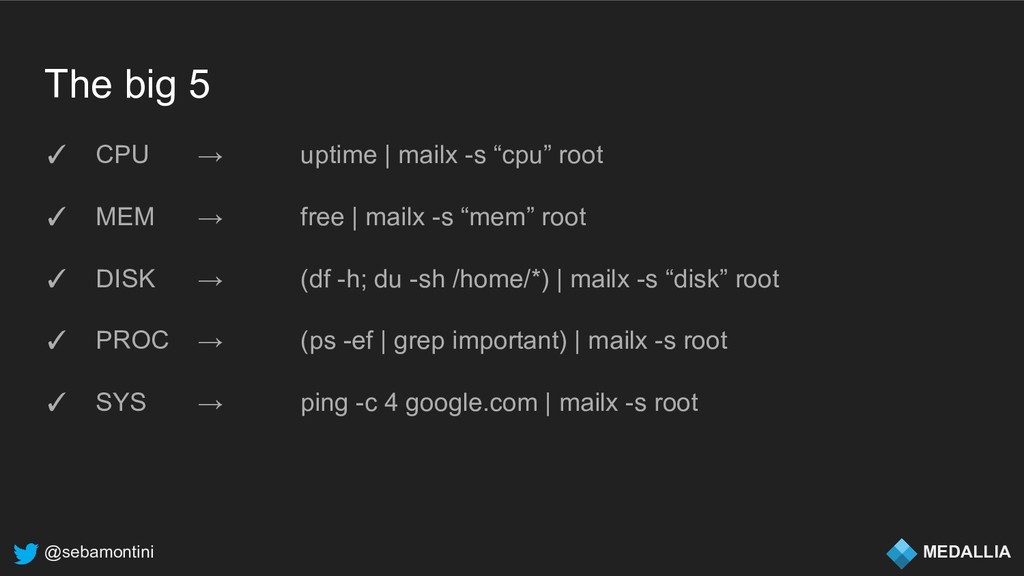
@sebamontini MEDALLIA The big 5
@sebamontini MEDALLIA The big 5 ✓ CPU → uptime |
mailx -s “cpu” root ✓ MEM → free | mailx -s “mem” root ✓ DISK → (df -h; du -sh /home/*) | mailx -s “disk” root ✓ PROC → (ps -ef | grep important) | mailx -s root ✓ SYS → ping -c 4 google.com | mailx -s root
@sebamontini MEDALLIA OK: x < something
@sebamontini MEDALLIA WARN: something < x < something
@sebamontini MEDALLIA CRITICAL: x > something
@sebamontini MEDALLIA
@sebamontini MEDALLIA Observability
@sebamontini MEDALLIA A system is observable if you can determine
the behavior of the system based on it’s outputs.
@sebamontini MEDALLIA A system is observable if you can determine
the behavior of the system based on it’s outputs.
@sebamontini MEDALLIA A system is a set of connected components.
@sebamontini MEDALLIA A system is observable if you can determine
the behavior of the system based on it’s outputs.
@sebamontini MEDALLIA The manner in which a system acts is
it’s behavior.
@sebamontini MEDALLIA A system is observable if you can determine
the behavior of the system based on it’s outputs.
@sebamontini MEDALLIA The outputs of a system are the concrete
results of it’s behaviors.
@sebamontini MEDALLIA Monitoring is the action of observing and checking
the behavior and outputs of a system and it’s components over time.
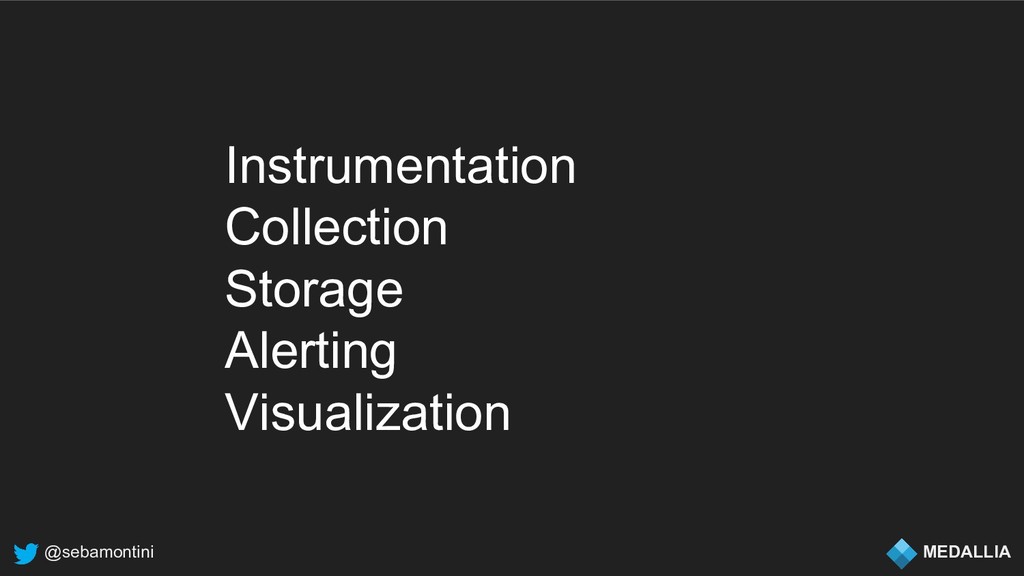
@sebamontini MEDALLIA The (real) big 5
@sebamontini MEDALLIA Instrumentation Collection Storage Alerting Visualization
@sebamontini MEDALLIA Instrumentation
@sebamontini MEDALLIA Gauges Counters Histogram Timers
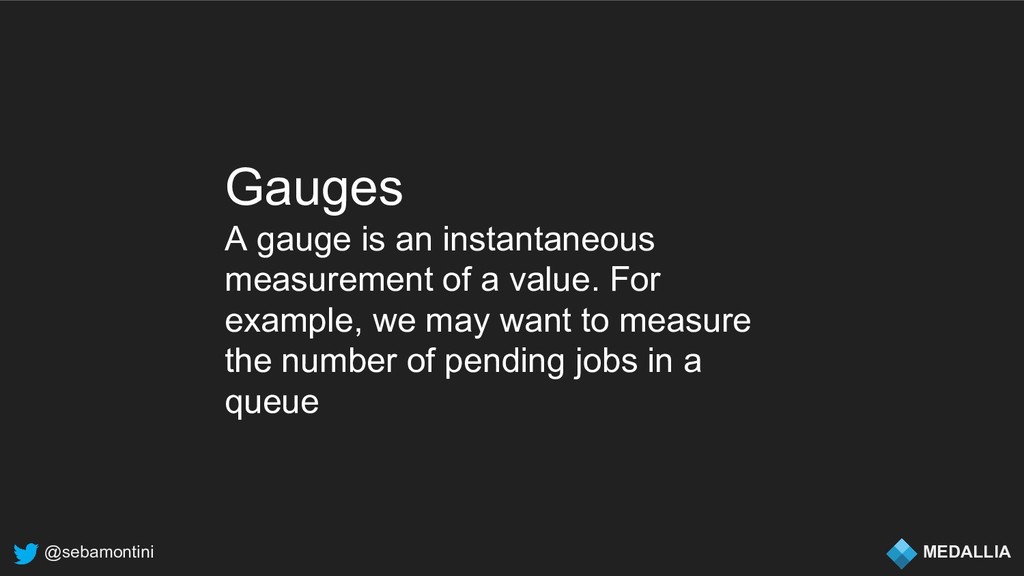
@sebamontini MEDALLIA Gauges A gauge is an instantaneous measurement of
a value. For example, we may want to measure the number of pending jobs in a queue
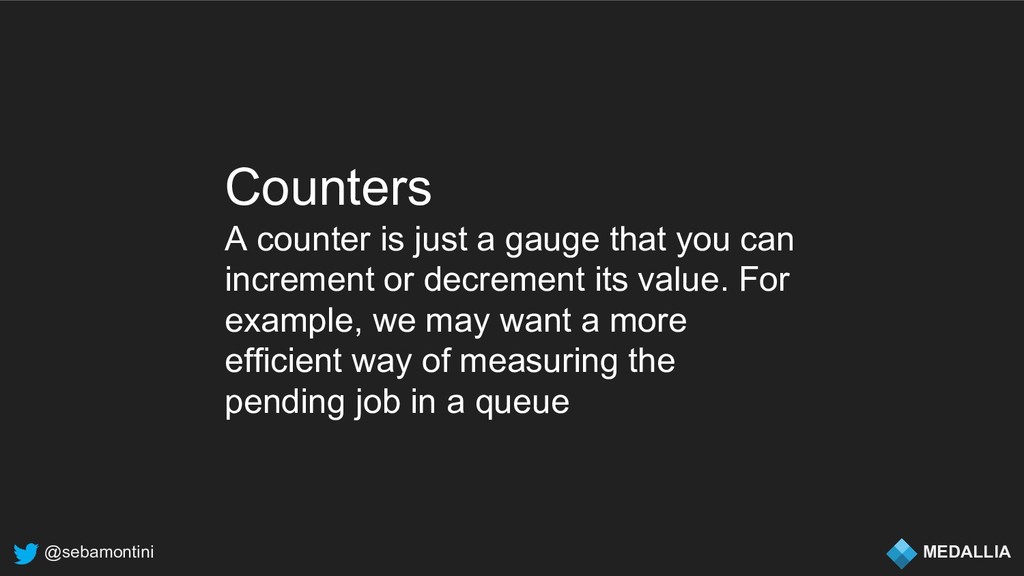
@sebamontini MEDALLIA Counters A counter is just a gauge that
you can increment or decrement its value. For example, we may want a more efficient way of measuring the pending job in a queue
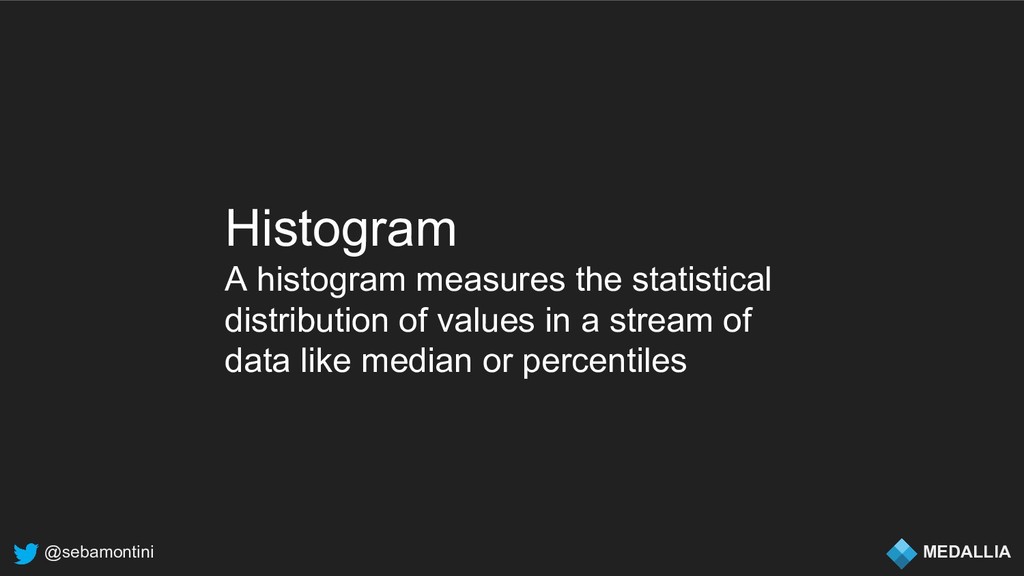
@sebamontini MEDALLIA Histogram A histogram measures the statistical distribution of
values in a stream of data like median or percentiles
@sebamontini MEDALLIA Timers A timer measures both the rate that
a particular piece of code is called and the distribution of its duration.
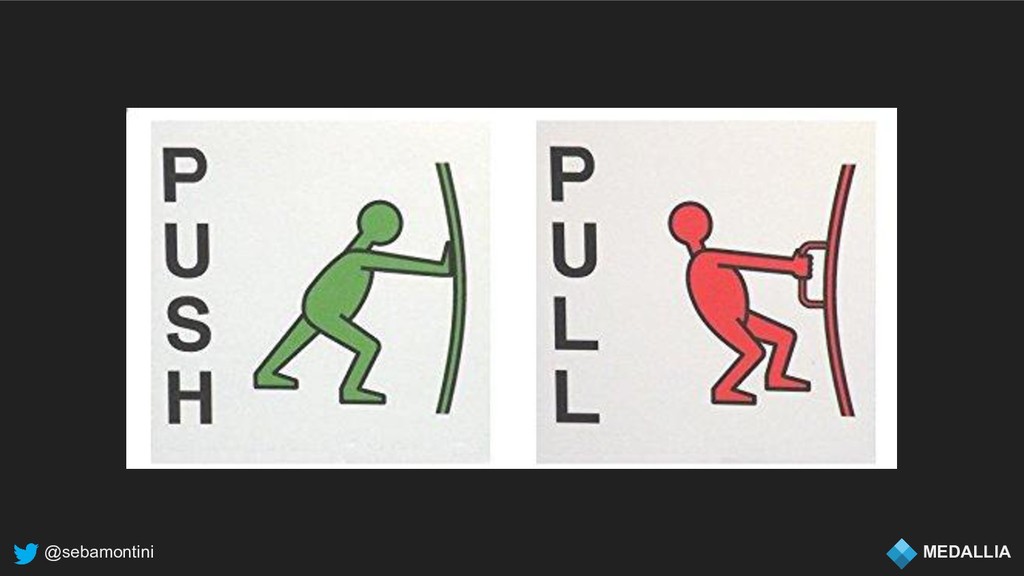
@sebamontini MEDALLIA Collection
@sebamontini MEDALLIA
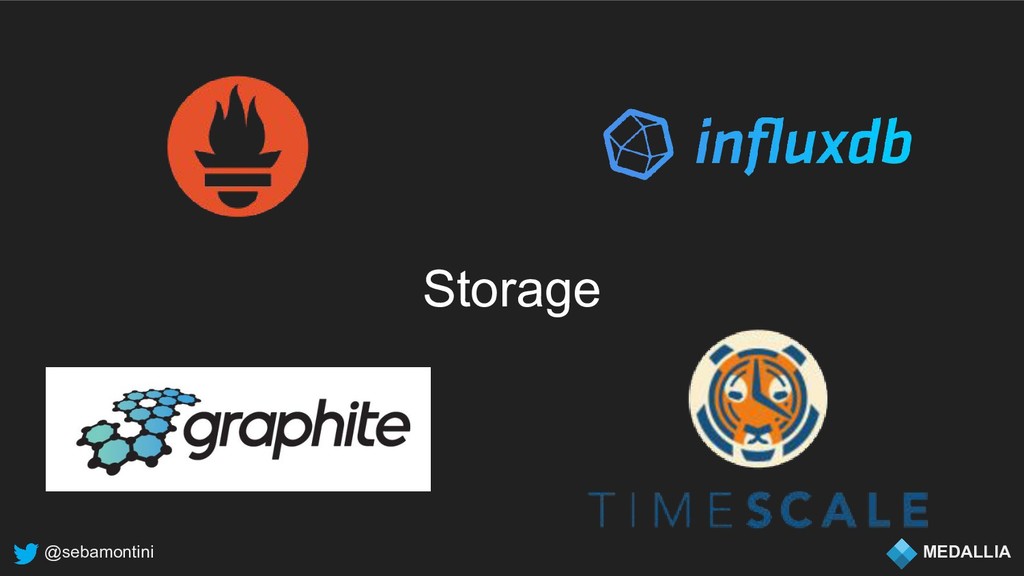
@sebamontini MEDALLIA Storage
@sebamontini MEDALLIA Storage
@sebamontini MEDALLIA Alerting
@sebamontini MEDALLIA Thresholds Dead man Delta Anomaly detection
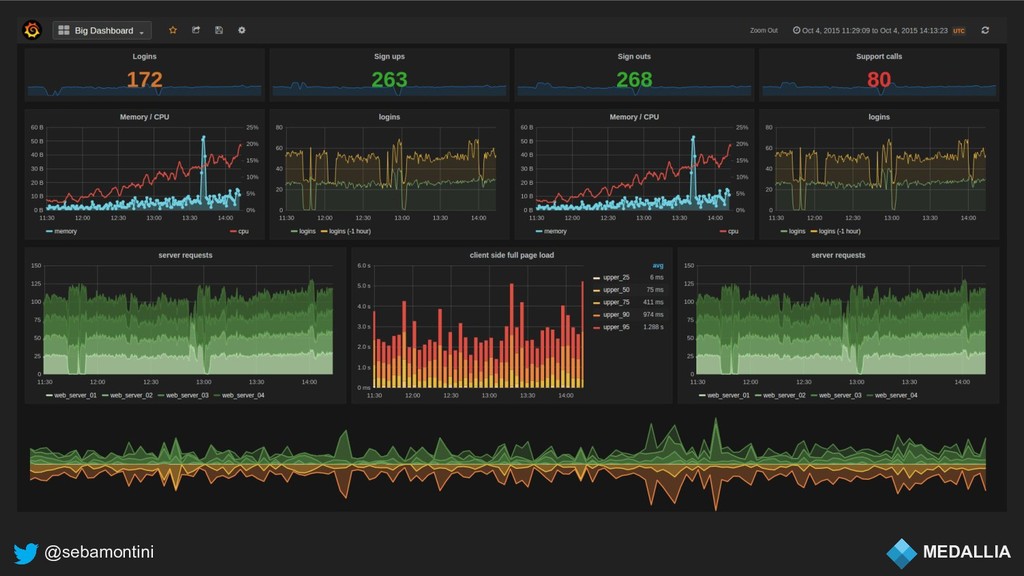
@sebamontini MEDALLIA Visualization
@sebamontini MEDALLIA
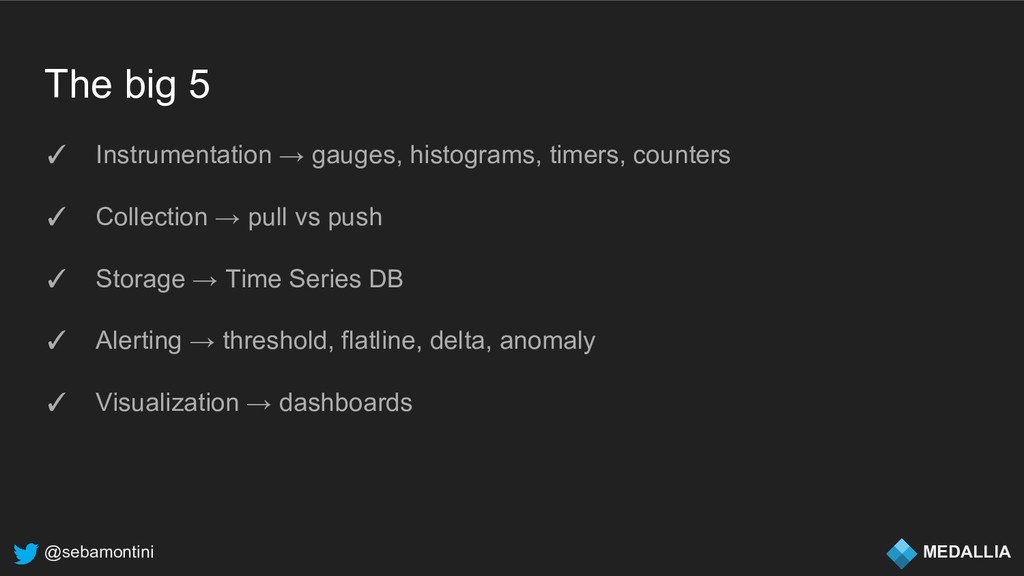
@sebamontini MEDALLIA The big 5 ✓ Instrumentation → gauges, histograms,
timers, counters ✓ Collection → pull vs push ✓ Storage → Time Series DB ✓ Alerting → threshold, flatline, delta, anomaly ✓ Visualization → dashboards
@sebamontini MEDALLIA
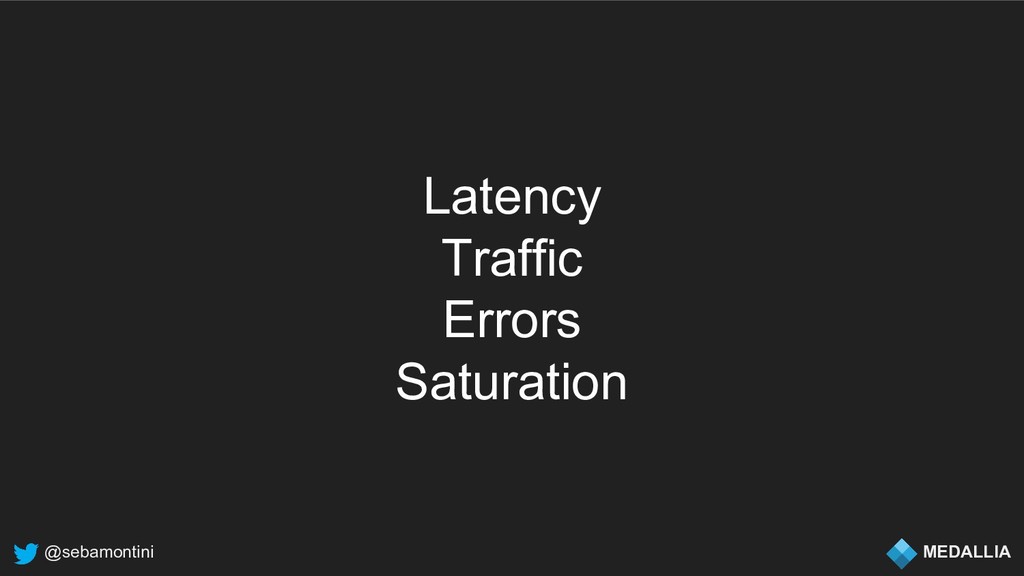
@sebamontini MEDALLIA The Four Golden Signals
@sebamontini MEDALLIA Latency Traffic Errors Saturation
@sebamontini MEDALLIA Thanks