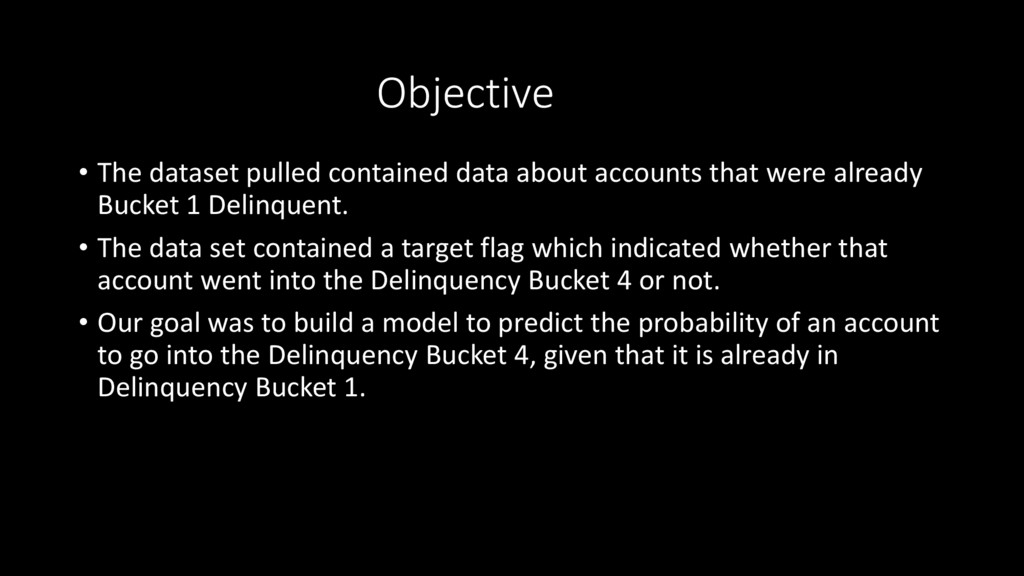
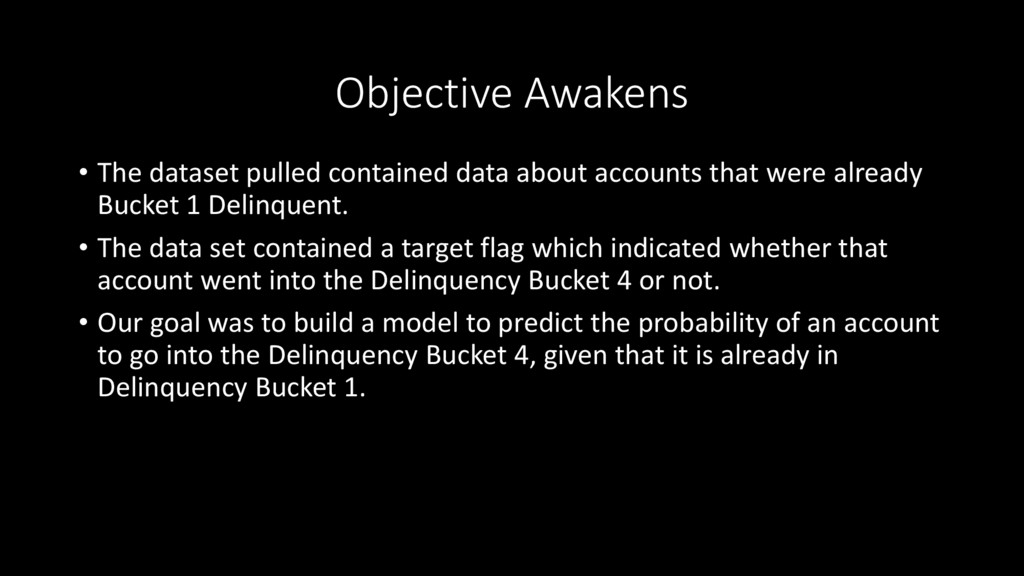
were already Bucket 1 Delinquent. • The data set contained a target flag which indicated whether that account went into the Delinquency Bucket 4 or not. • Our goal was to build a model to predict the probability of an account to go into the Delinquency Bucket 4, given that it is already in Delinquency Bucket 1.
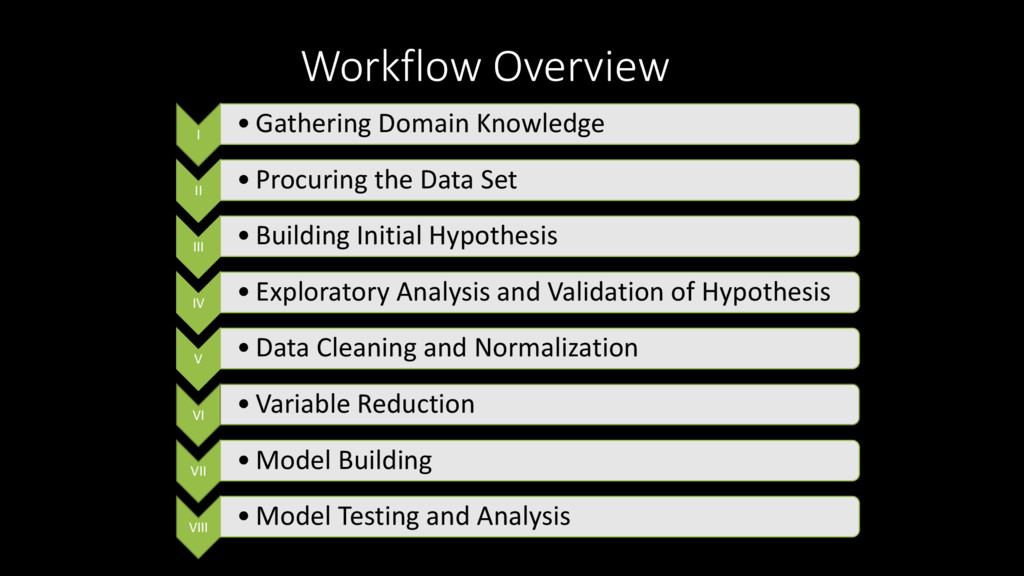
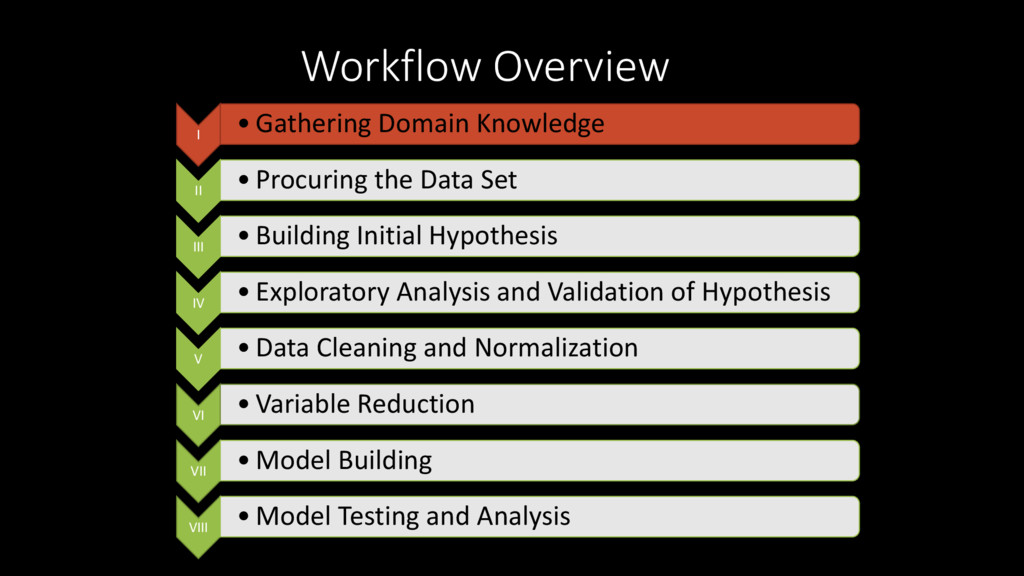
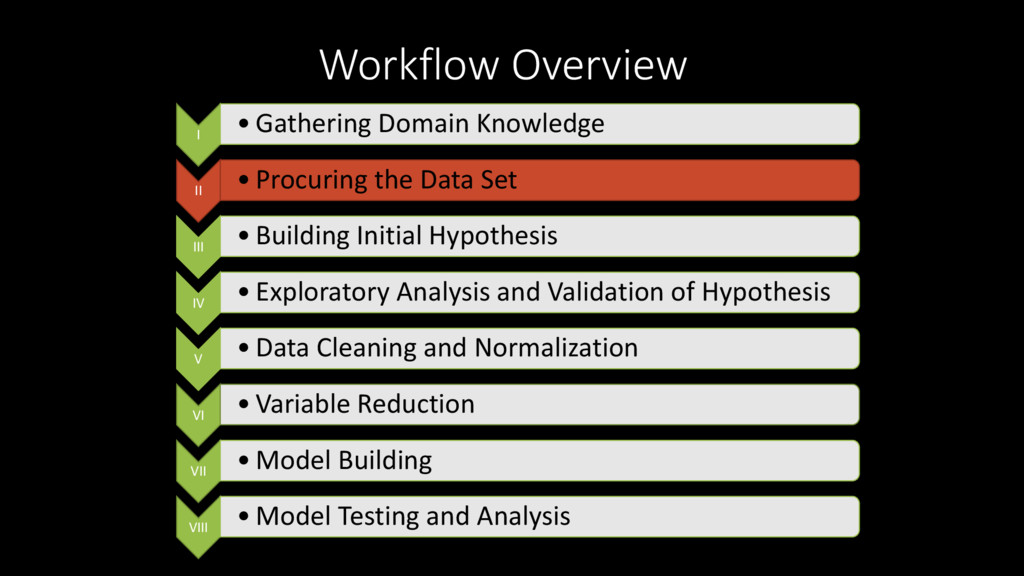
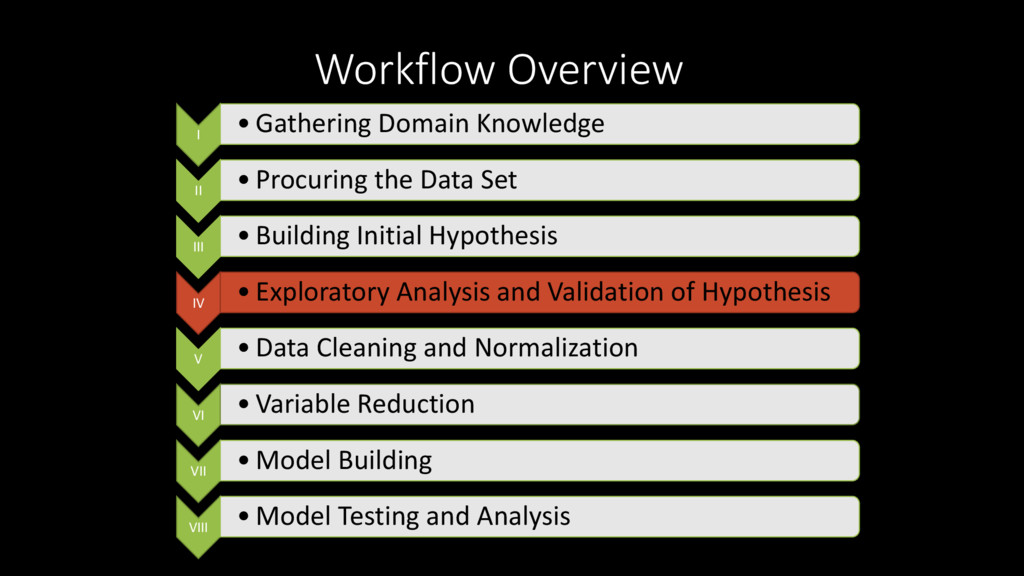
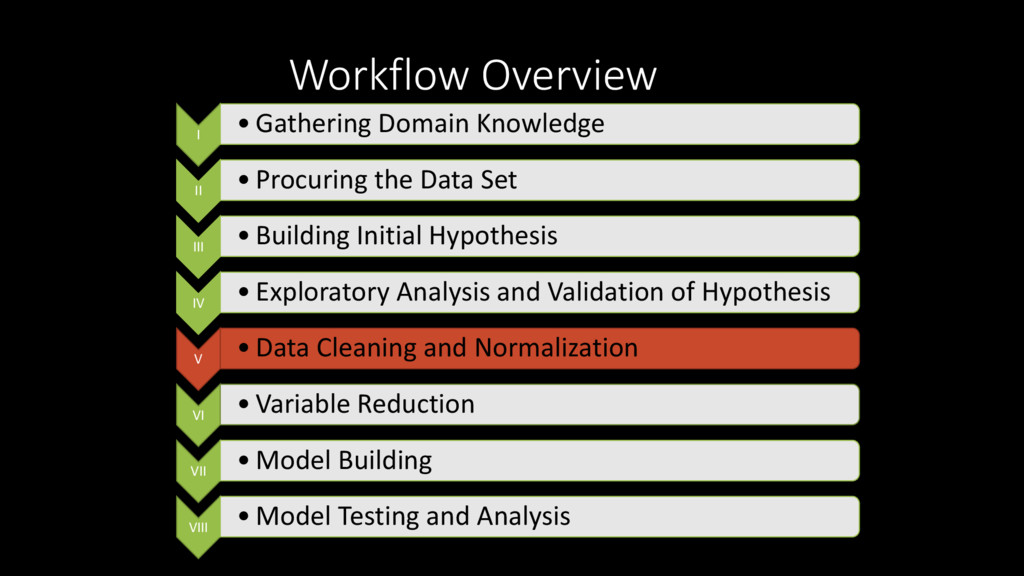
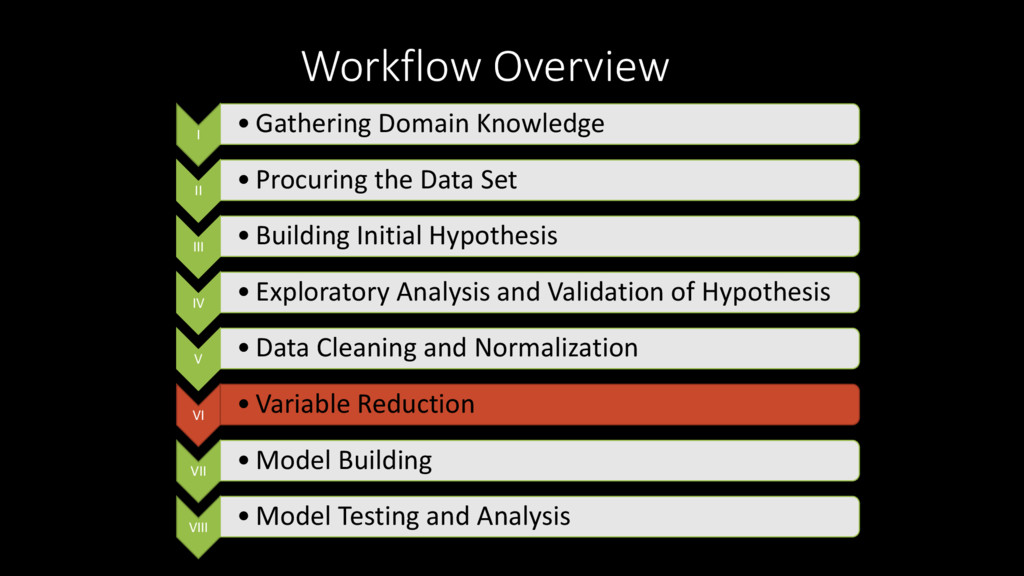
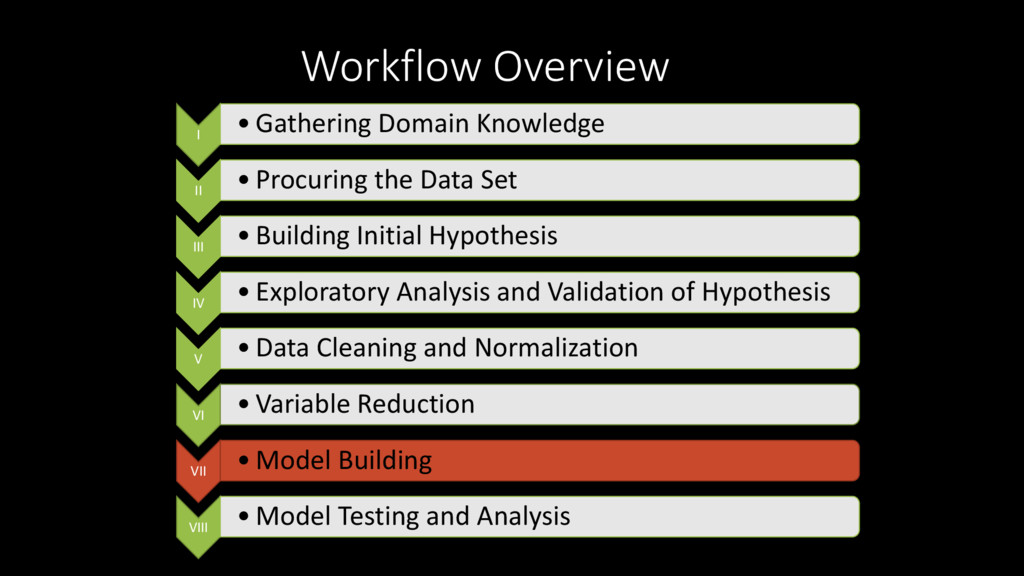
the Data Set III • Building Initial Hypothesis IV • Exploratory Analysis and Validation of Hypothesis V • Data Cleaning and Normalization VI • Variable Reduction VII • Model Building VIII • Model Testing and Analysis
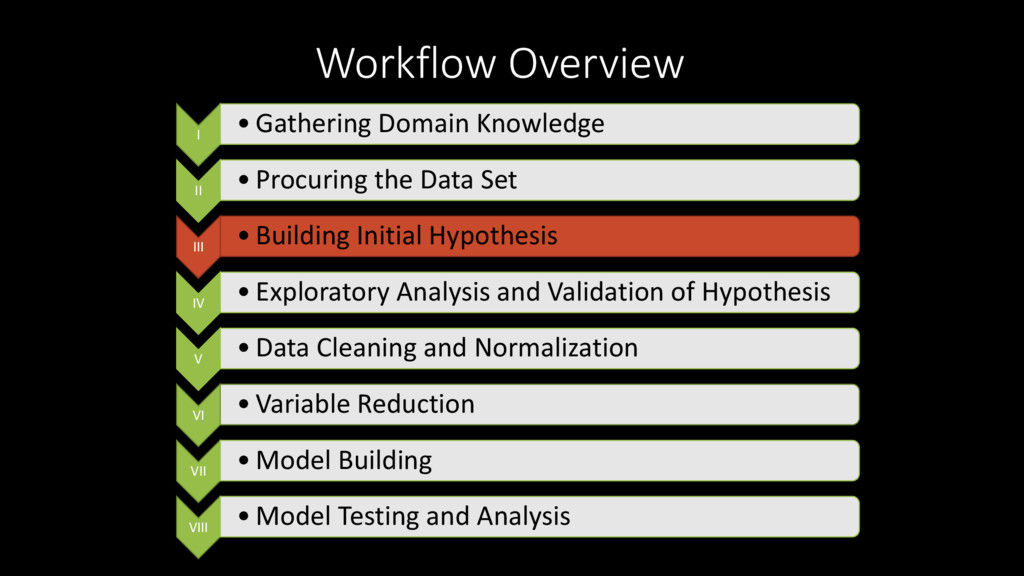
the Data Set III • Building Initial Hypothesis IV • Exploratory Analysis and Validation of Hypothesis V • Data Cleaning and Normalization VI • Variable Reduction VII • Model Building VIII • Model Testing and Analysis
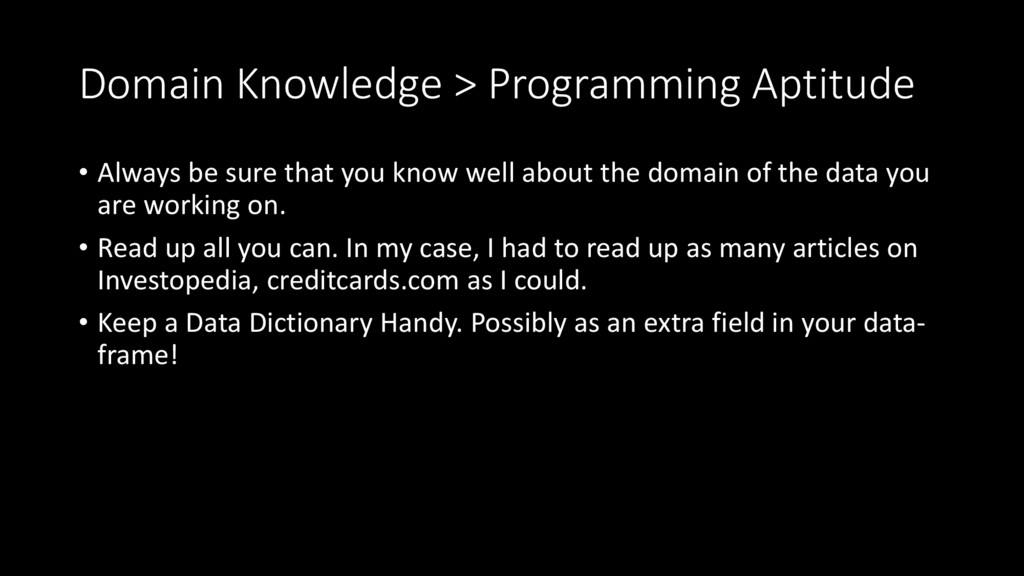
domain of the data you are working on. • Read up all you can. In my case, I had to read up as many articles on Investopedia, creditcards.com as I could. • Keep a Data Dictionary Handy. Possibly as an extra field in your data- frame! Domain Knowledge > Programming Aptitude
that were already Bucket 1 Delinquent. • The data set contained a target flag which indicated whether that account went into the Delinquency Bucket 4 or not. • Our goal was to build a model to predict the probability of an account to go into the Delinquency Bucket 4, given that it is already in Delinquency Bucket 1.
the Data Set III • Building Initial Hypothesis IV • Exploratory Analysis and Validation of Hypothesis V • Data Cleaning and Normalization VI • Variable Reduction VII • Model Building VIII • Model Testing and Analysis
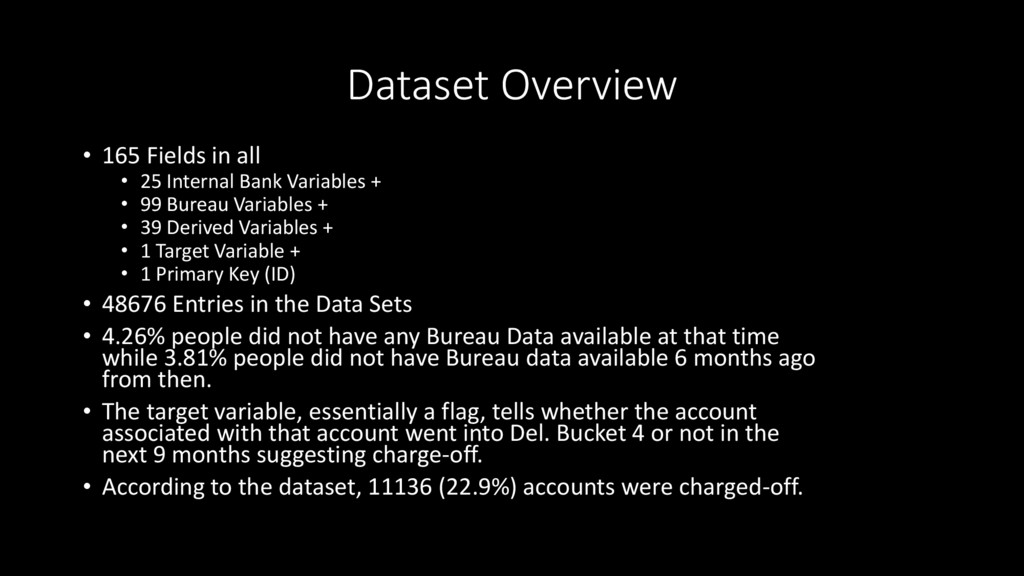
Bank Variables + • 99 Bureau Variables + • 39 Derived Variables + • 1 Target Variable + • 1 Primary Key (ID) • 48676 Entries in the Data Sets • 4.26% people did not have any Bureau Data available at that time while 3.81% people did not have Bureau data available 6 months ago from then. • The target variable, essentially a flag, tells whether the account associated with that account went into Del. Bucket 4 or not in the next 9 months suggesting charge-off. • According to the dataset, 11136 (22.9%) accounts were charged-off.
the Data Set III • Building Initial Hypothesis IV • Exploratory Analysis and Validation of Hypothesis V • Data Cleaning and Normalization VI • Variable Reduction VII • Model Building VIII • Model Testing and Analysis
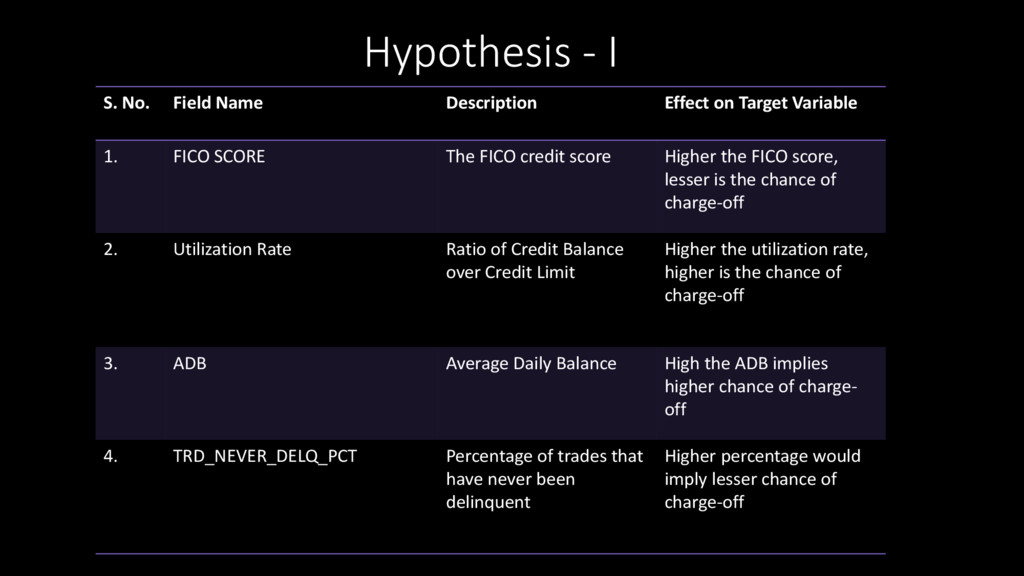
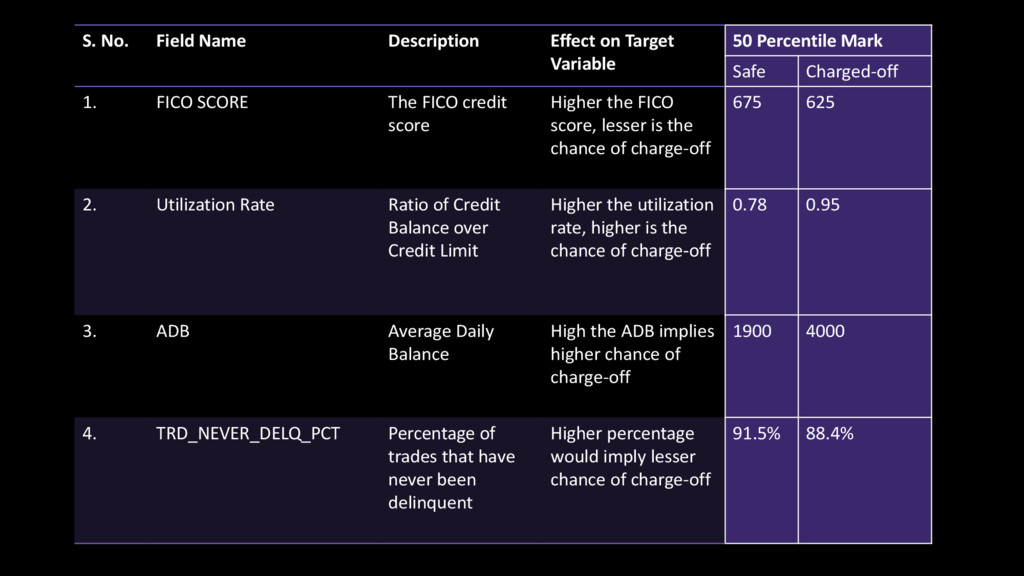
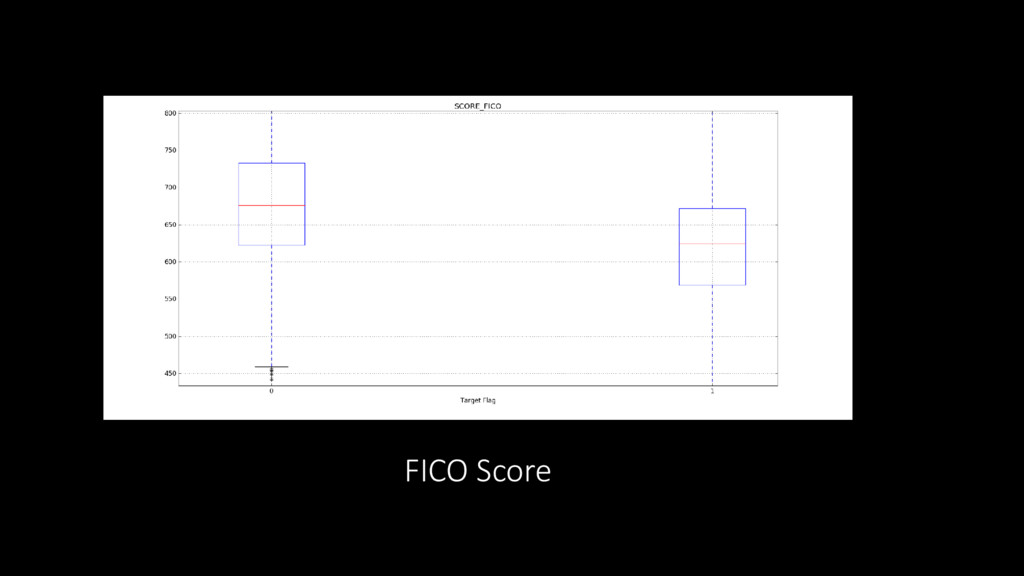
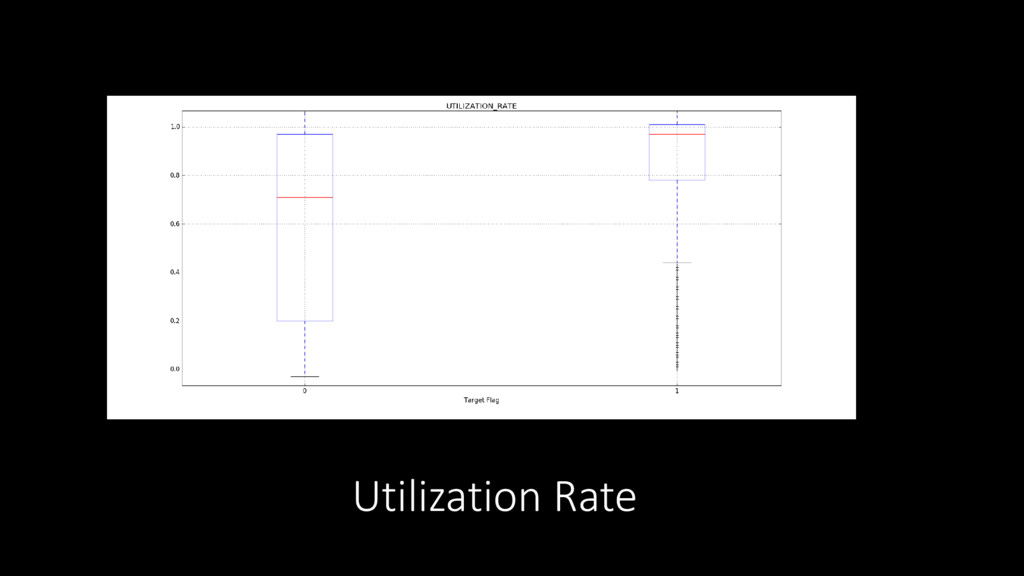
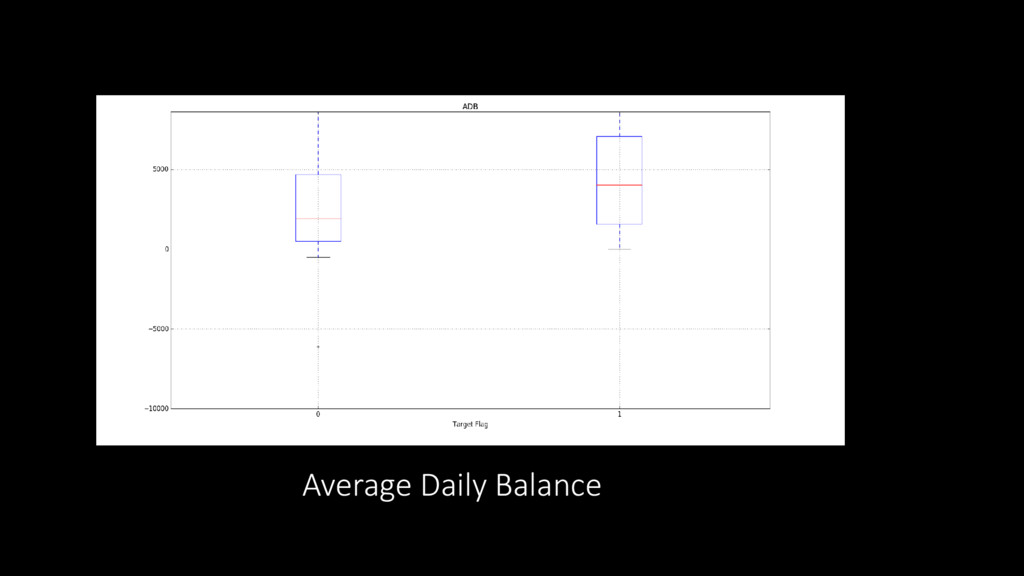
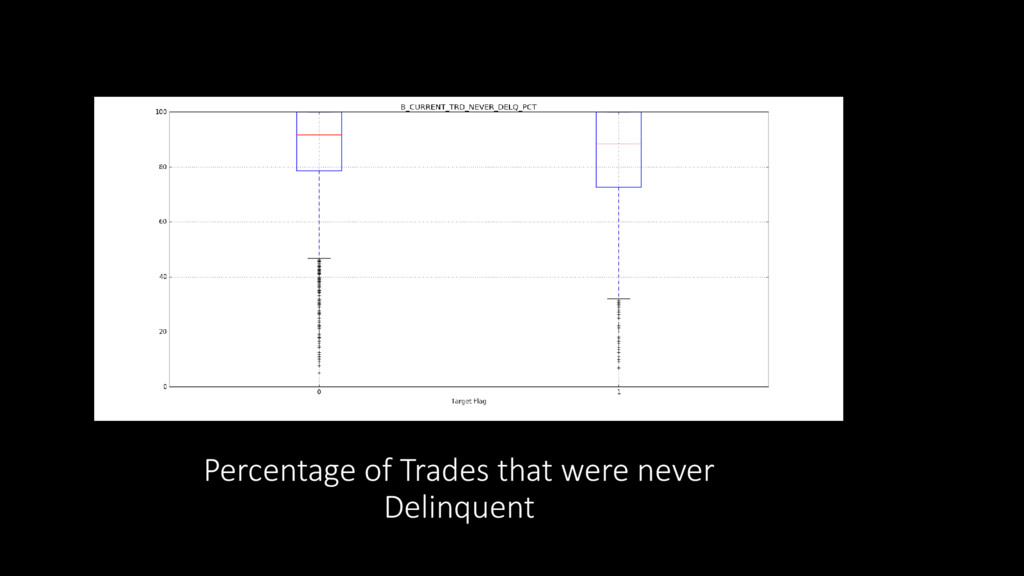
Target Variable 1. FICO SCORE The FICO credit score Higher the FICO score, lesser is the chance of charge-off 2. Utilization Rate Ratio of Credit Balance over Credit Limit Higher the utilization rate, higher is the chance of charge-off 3. ADB Average Daily Balance High the ADB implies higher chance of charge- off 4. TRD_NEVER_DELQ_PCT Percentage of trades that have never been delinquent Higher percentage would imply lesser chance of charge-off
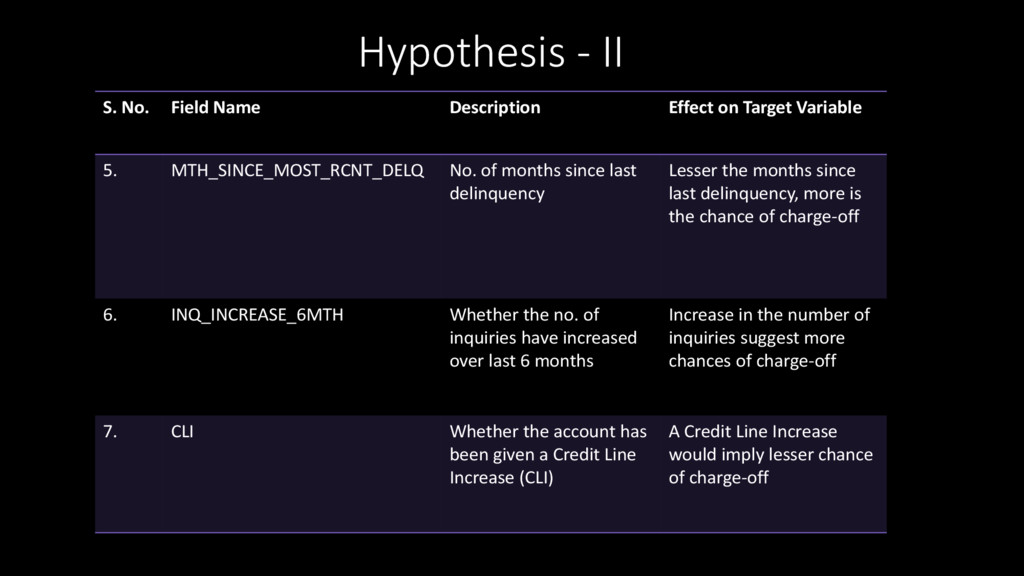
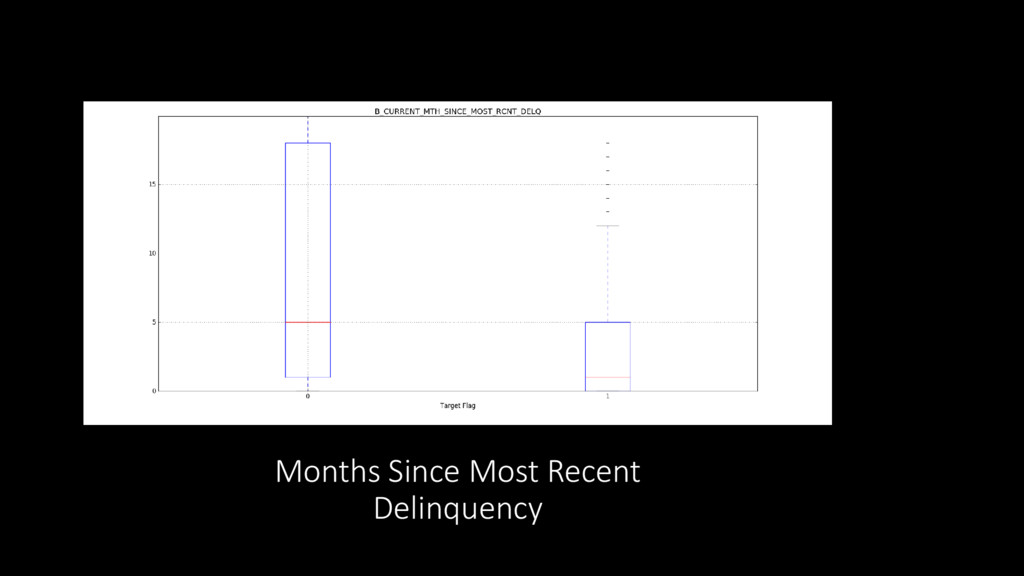
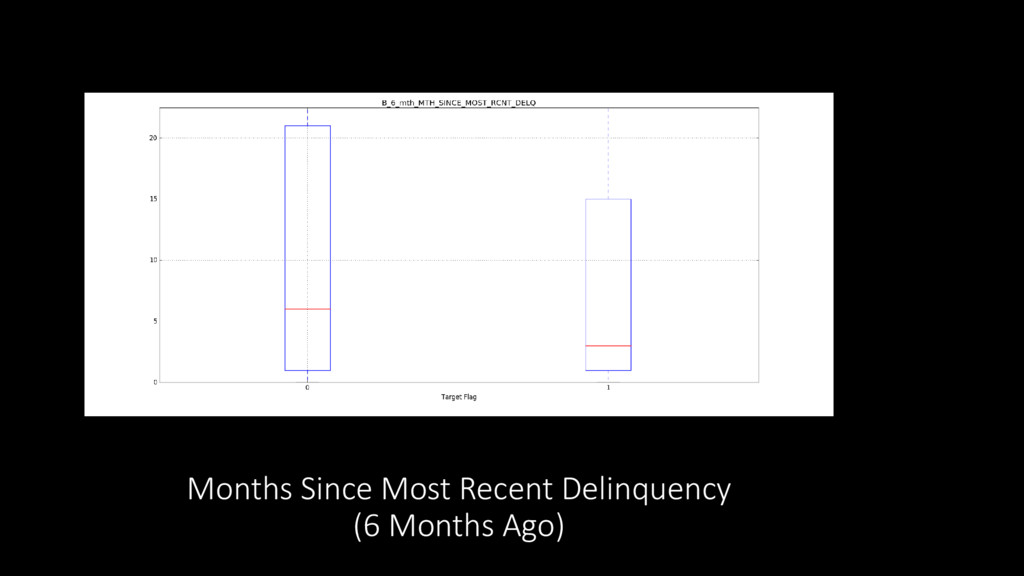
MTH_SINCE_MOST_RCNT_DELQ No. of months since last delinquency Lesser the months since last delinquency, more is the chance of charge-off 6. INQ_INCREASE_6MTH Whether the no. of inquiries have increased over last 6 months Increase in the number of inquiries suggest more chances of charge-off 7. CLI Whether the account has been given a Credit Line Increase (CLI) A Credit Line Increase would imply lesser chance of charge-off Hypothesis - II
the Data Set III • Building Initial Hypothesis IV • Exploratory Analysis and Validation of Hypothesis V • Data Cleaning and Normalization VI • Variable Reduction VII • Model Building VIII • Model Testing and Analysis
Percentile Mark Safe Charged-off 1. FICO SCORE The FICO credit score Higher the FICO score, lesser is the chance of charge-off 675 625 2. Utilization Rate Ratio of Credit Balance over Credit Limit Higher the utilization rate, higher is the chance of charge-off 0.78 0.95 3. ADB Average Daily Balance High the ADB implies higher chance of charge-off 1900 4000 4. TRD_NEVER_DELQ_PCT Percentage of trades that have never been delinquent Higher percentage would imply lesser chance of charge-off 91.5% 88.4%
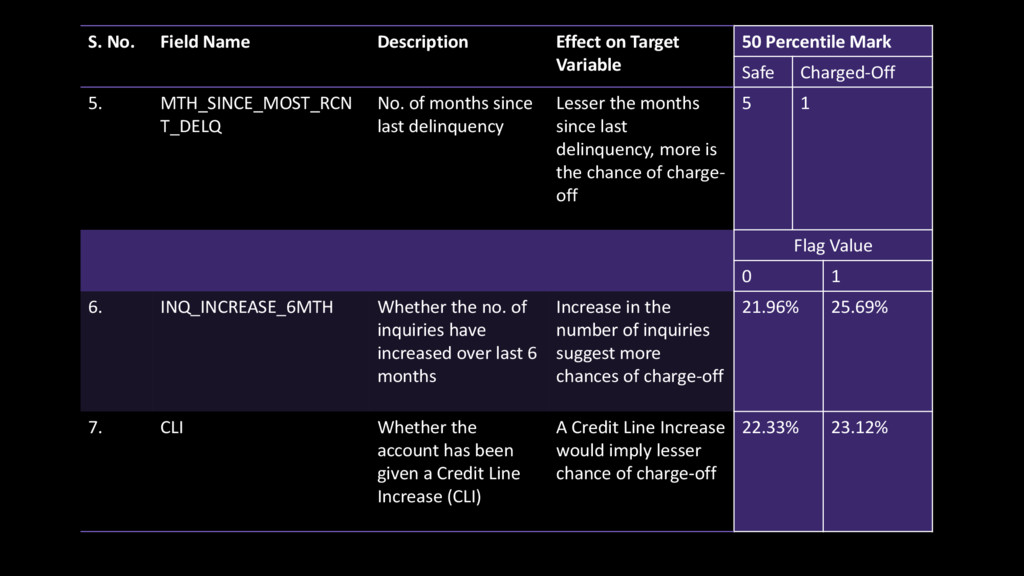
Percentile Mark Safe Charged-Off 5. MTH_SINCE_MOST_RCN T_DELQ No. of months since last delinquency Lesser the months since last delinquency, more is the chance of charge- off 5 1 Flag Value 0 1 6. INQ_INCREASE_6MTH Whether the no. of inquiries have increased over last 6 months Increase in the number of inquiries suggest more chances of charge-off 21.96% 25.69% 7. CLI Whether the account has been given a Credit Line Increase (CLI) A Credit Line Increase would imply lesser chance of charge-off 22.33% 23.12%
the Data Set III • Building Initial Hypothesis IV • Exploratory Analysis and Validation of Hypothesis V • Data Cleaning and Normalization VI • Variable Reduction VII • Model Building VIII • Model Testing and Analysis
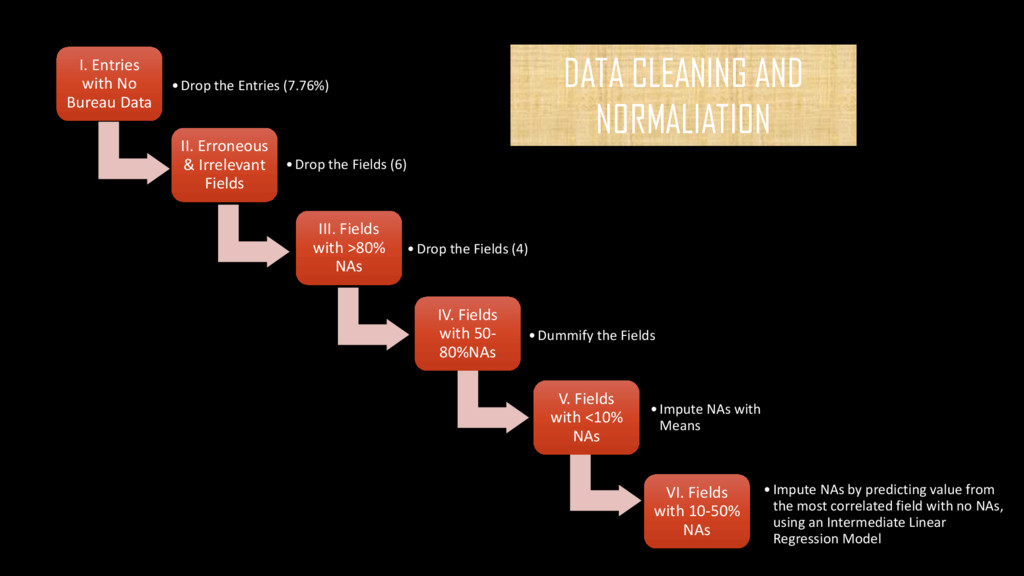
II. Erroneous & Irrelevant Fields •Drop the Fields (6) III. Fields with >80% NAs •Drop the Fields (4) IV. Fields with 50- 80%NAs •Dummify the Fields V. Fields with <10% NAs •Impute NAs with Means VI. Fields with 10-50% NAs •Impute NAs by predicting value from the most correlated field with no NAs, using an Intermediate Linear Regression Model DATA CLEANING AND NORMALIATION
the Data Set III • Building Initial Hypothesis IV • Exploratory Analysis and Validation of Hypothesis V • Data Cleaning and Normalization VI • Variable Reduction VII • Model Building VIII • Model Testing and Analysis
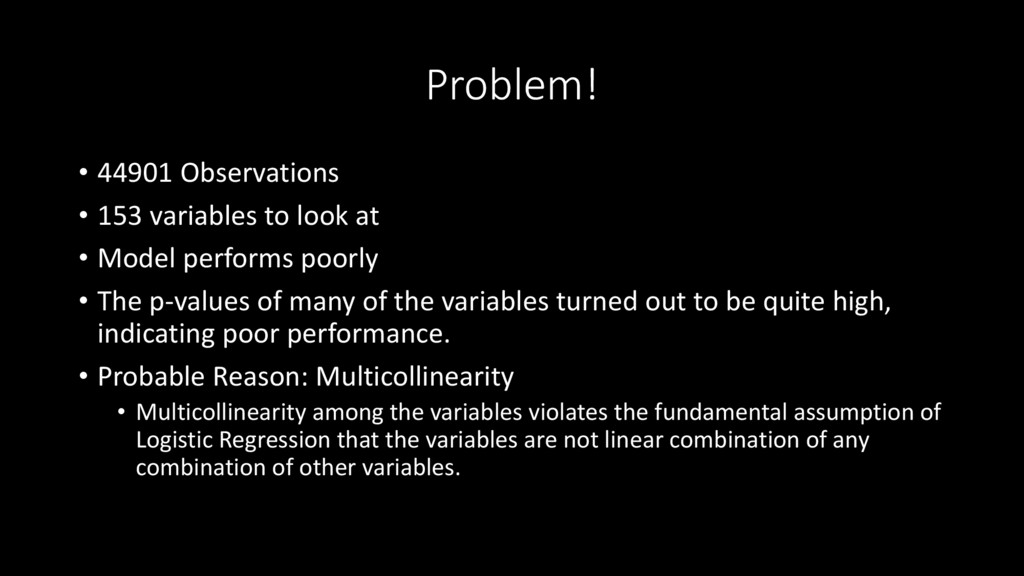
• Model performs poorly • The p-values of many of the variables turned out to be quite high, indicating poor performance. • Probable Reason: Multicollinearity • Multicollinearity among the variables violates the fundamental assumption of Logistic Regression that the variables are not linear combination of any combination of other variables.
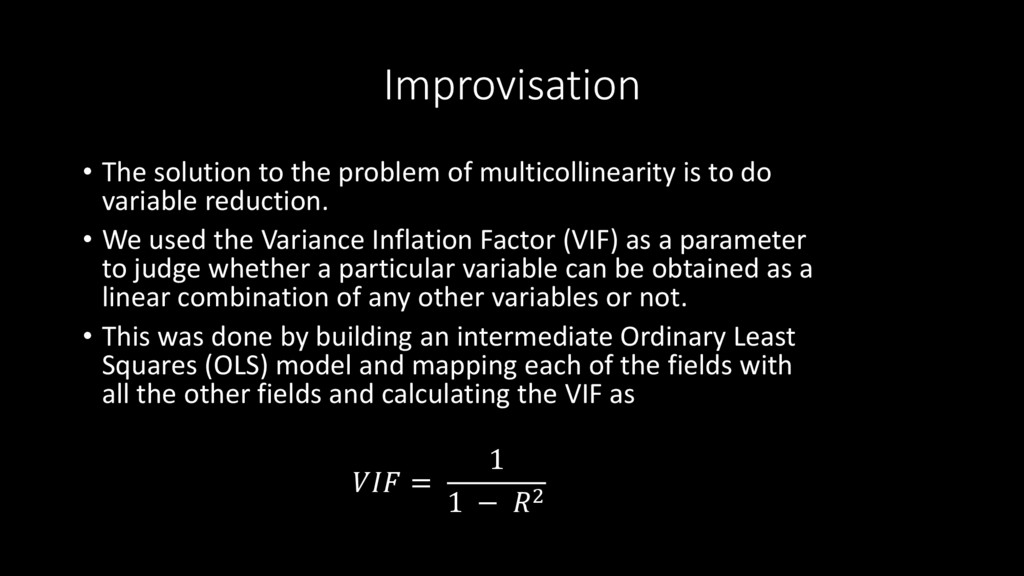
to do variable reduction. • We used the Variance Inflation Factor (VIF) as a parameter to judge whether a particular variable can be obtained as a linear combination of any other variables or not. • This was done by building an intermediate Ordinary Least Squares (OLS) model and mapping each of the fields with all the other fields and calculating the VIF as = 1 1 − 2
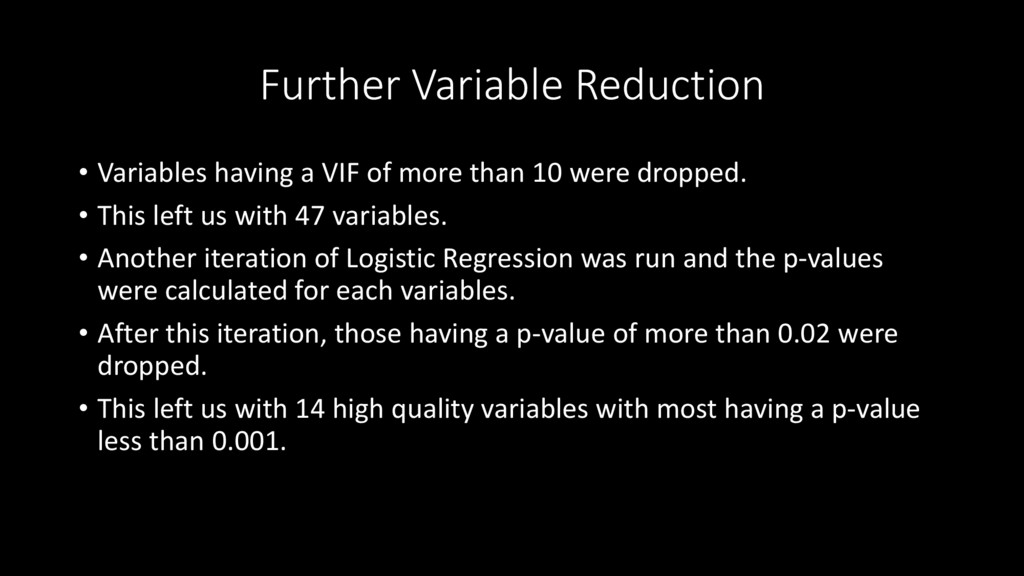
than 10 were dropped. • This left us with 47 variables. • Another iteration of Logistic Regression was run and the p-values were calculated for each variables. • After this iteration, those having a p-value of more than 0.02 were dropped. • This left us with 14 high quality variables with most having a p-value less than 0.001.
the Data Set III • Building Initial Hypothesis IV • Exploratory Analysis and Validation of Hypothesis V • Data Cleaning and Normalization VI • Variable Reduction VII • Model Building VIII • Model Testing and Analysis
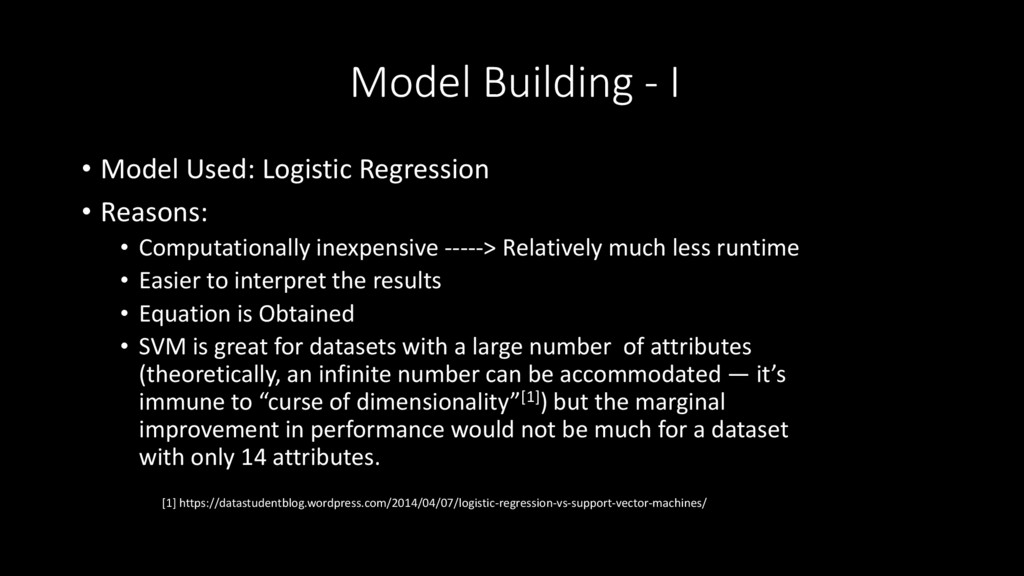
Reasons: • Computationally inexpensive -----> Relatively much less runtime • Easier to interpret the results • Equation is Obtained • SVM is great for datasets with a large number of attributes (theoretically, an infinite number can be accommodated — it’s immune to “curse of dimensionality”[1]) but the marginal improvement in performance would not be much for a dataset with only 14 attributes. [1] https://datastudentblog.wordpress.com/2014/04/07/logistic-regression-vs-support-vector-machines/
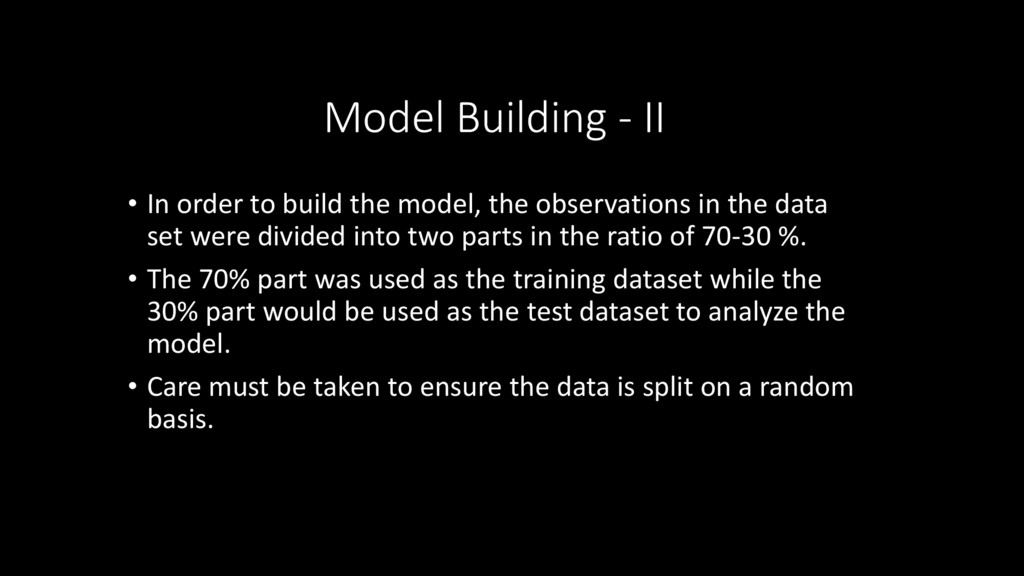
model, the observations in the data set were divided into two parts in the ratio of 70-30 %. • The 70% part was used as the training dataset while the 30% part would be used as the test dataset to analyze the model. • Care must be taken to ensure the data is split on a random basis.
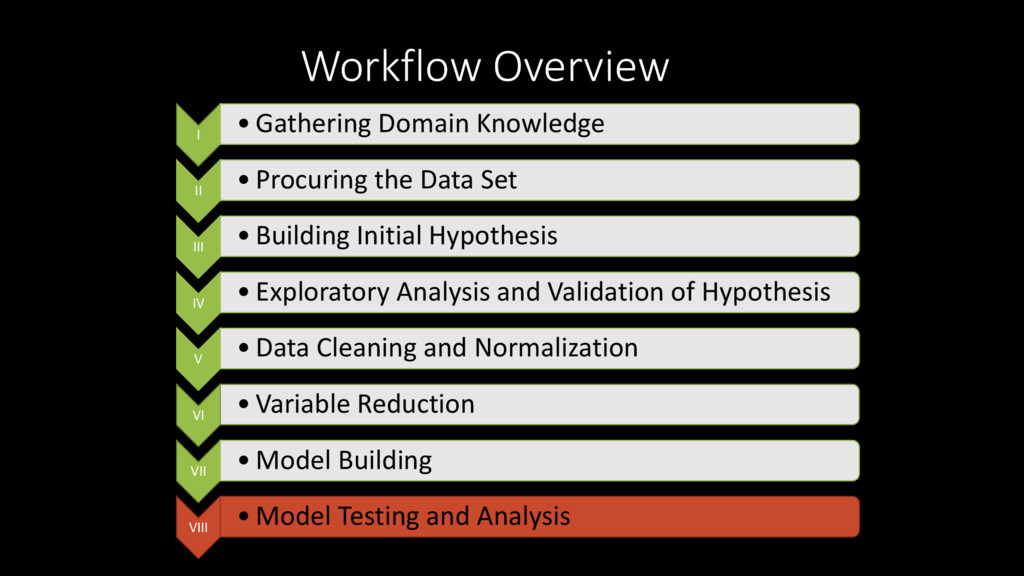
the Data Set III • Building Initial Hypothesis IV • Exploratory Analysis and Validation of Hypothesis V • Data Cleaning and Normalization VI • Variable Reduction VII • Model Building VIII • Model Testing and Analysis
in order to build the model, the observations in the data set were divided into two parts in the ratio of 70-30 %. • The 70% part was used as the training dataset while the 30% part was used as the test dataset to analyze the model. • So the test set consisted of 14818 observations. • The probabilities of getting into B4+ delinquency for these 14818 accounts were predicted using the model.
performance metrics used industrially to rate the performance of a model. • The performance metrics you use, are generally determined by your client (or your examiner or your professor or yourself or the force!). • A commonly used performance metric in the Banking Domain is the Kolmogorov-Smirnov (K-S) Goodness-of-Fit Test. We used that and Lift to evaluate the trained model.


 ymotongpoo
 maimyyym
 glaforge
 makocchi
 terapyon
 kentapapa
 endonanana
 akitoshiga
 shogo4131
 gionn
 satomasahiro2005
 codmoninc
 chrislema
 codingconduct
 jeffersonlam
 akashhashmi
 seathinner
 khoart
 baasie
 tmiket
 tammyeverts
 akihiro_kokubo