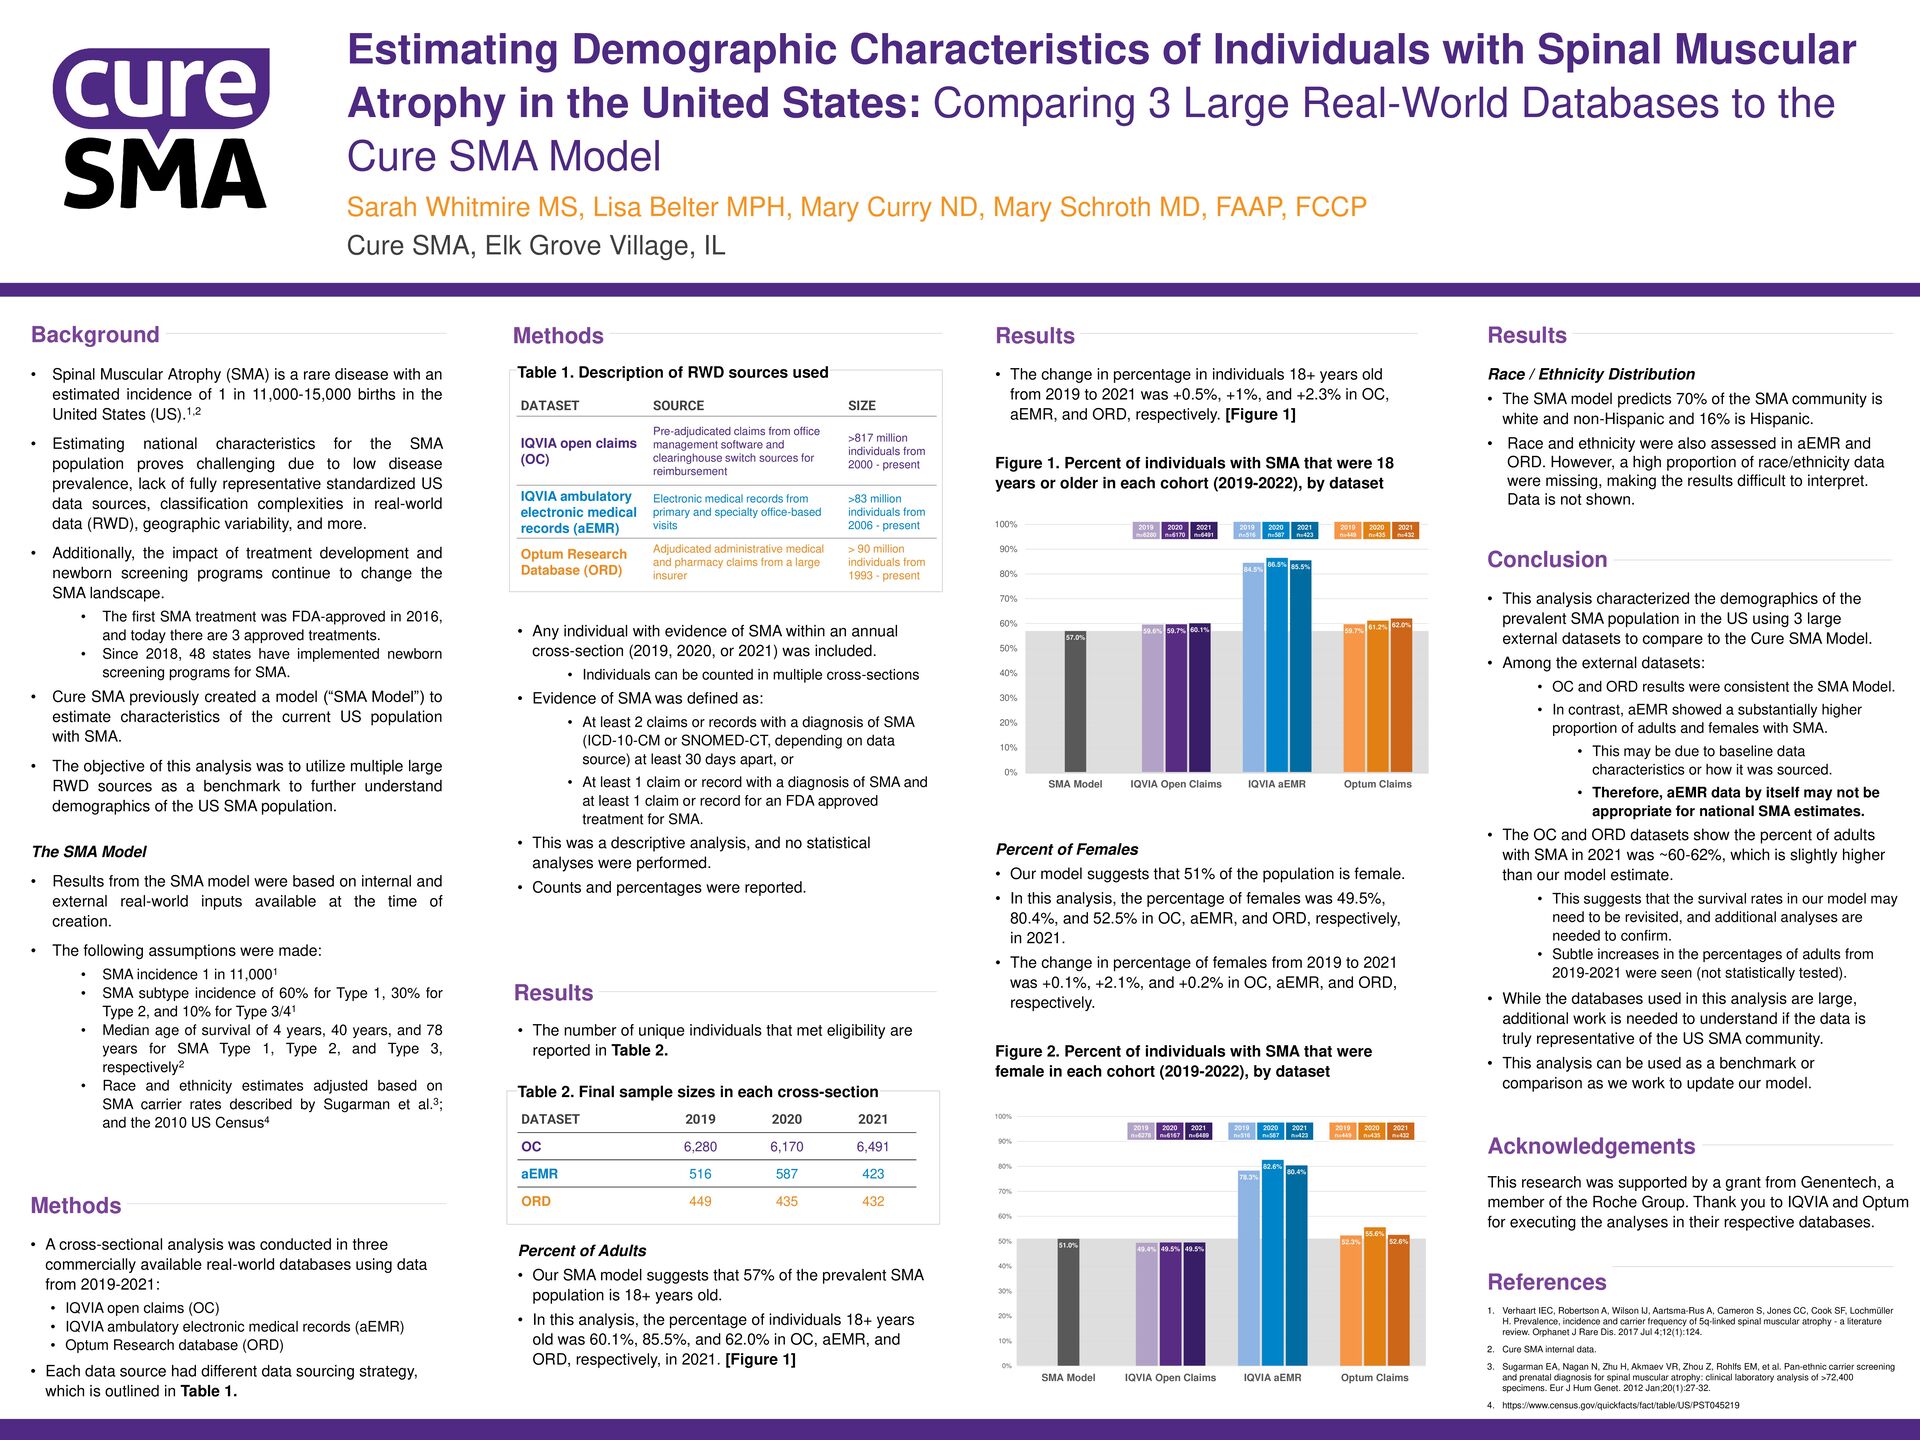
from 2019 to 2021 was +0.5%, +1%, and +2.3% in OC, aEMR, and ORD, respectively. [Figure 1] Figure 1. Percent of individuals with SMA that were 18 years or older in each cohort (2019-2022), by dataset Percent of Females • Our model suggests that 51% of the population is female. • In this analysis, the percentage of females was 49.5%, 80.4%, and 52.5% in OC, aEMR, and ORD, respectively, in 2021. • The change in percentage of females from 2019 to 2021 was +0.1%, +2.1%, and +0.2% in OC, aEMR, and ORD, respectively. Figure 2. Percent of individuals with SMA that were female in each cohort (2019-2022), by dataset • Spinal Muscular Atrophy (SMA) is a rare disease with an estimated incidence of 1 in 11,000-15,000 births in the United States (US).1,2 • Estimating national characteristics for the SMA population proves challenging due to low disease prevalence, lack of fully representative standardized US data sources, classification complexities in real-world data (RWD), geographic variability, and more. • Additionally, the impact of treatment development and newborn screening programs continue to change the SMA landscape. • The first SMA treatment was FDA-approved in 2016, and today there are 3 approved treatments. • Since 2018, 48 states have implemented newborn screening programs for SMA. • Cure SMA previously created a model (“SMA Model”) to estimate characteristics of the current US population with SMA. • The objective of this analysis was to utilize multiple large RWD sources as a benchmark to further understand demographics of the US SMA population. The SMA Model • Results from the SMA model were based on internal and external real-world inputs available at the time of creation. • The following assumptions were made: • SMA incidence 1 in 11,0001 • SMA subtype incidence of 60% for Type 1, 30% for Type 2, and 10% for Type 3/41 • Median age of survival of 4 years, 40 years, and 78 years for SMA Type 1, Type 2, and Type 3, respectively2 • Race and ethnicity estimates adjusted based on SMA carrier rates described by Sugarman et al.3; and the 2010 US Census4 Estimating Demographic Characteristics of Individuals with Spinal Muscular Atrophy in the United States: Comparing 3 Large Real-World Databases to the Cure SMA Model Sarah Whitmire MS, Lisa Belter MPH, Mary Curry ND, Mary Schroth MD, FAAP, FCCP Cure SMA, Elk Grove Village, IL Table 1. Description of RWD sources used • Any individual with evidence of SMA within an annual cross-section (2019, 2020, or 2021) was included. • Individuals can be counted in multiple cross-sections • Evidence of SMA was defined as: • At least 2 claims or records with a diagnosis of SMA (ICD-10-CM or SNOMED-CT, depending on data source) at least 30 days apart, or • At least 1 claim or record with a diagnosis of SMA and at least 1 claim or record for an FDA approved treatment for SMA. • This was a descriptive analysis, and no statistical analyses were performed. • Counts and percentages were reported. Race / Ethnicity Distribution • The SMA model predicts 70% of the SMA community is white and non-Hispanic and 16% is Hispanic. • Race and ethnicity were also assessed in aEMR and ORD. However, a high proportion of race/ethnicity data were missing, making the results difficult to interpret. Data is not shown. This research was supported by a grant from Genentech, a member of the Roche Group. Thank you to IQVIA and Optum for executing the analyses in their respective databases. • This analysis characterized the demographics of the prevalent SMA population in the US using 3 large external datasets to compare to the Cure SMA Model. • Among the external datasets: • OC and ORD results were consistent the SMA Model. • In contrast, aEMR showed a substantially higher proportion of adults and females with SMA. • This may be due to baseline data characteristics or how it was sourced. • Therefore, aEMR data by itself may not be appropriate for national SMA estimates. • The OC and ORD datasets show the percent of adults with SMA in 2021 was ~60-62%, which is slightly higher than our model estimate. • This suggests that the survival rates in our model may need to be revisited, and additional analyses are needed to confirm. • Subtle increases in the percentages of adults from 2019-2021 were seen (not statistically tested). • While the databases used in this analysis are large, additional work is needed to understand if the data is truly representative of the US SMA community. • This analysis can be used as a benchmark or comparison as we work to update our model. Conclusion Acknowledgements DATASET SOURCE SIZE IQVIA open claims (OC) Pre-adjudicated claims from office management software and clearinghouse switch sources for reimbursement >817 million individuals from 2000 - present IQVIA ambulatory electronic medical records (aEMR) Electronic medical records from primary and specialty office-based visits >83 million individuals from 2006 - present Optum Research Database (ORD) Adjudicated administrative medical and pharmacy claims from a large insurer > 90 million individuals from 1993 - present 59.6% 84.5% 59.7% 57.0% 59.7% 86.5% 61.2% 60.1% 85.5% 62.0% 0% 10% 20% 30% 40% 50% 60% 70% 80% 90% 100% SMA Model IQVIA Open Claims IQVIA aEMR Optum Claims 2019 n=6280 2020 n=6170 2021 n=6491 2019 n=516 2020 n=587 2021 n=423 2019 n=449 2020 n=435 2021 n=432 49.4% 78.3% 52.3% 51.0% 49.5% 82.6% 55.6% 49.5% 80.4% 52.6% 0% 10% 20% 30% 40% 50% 60% 70% 80% 90% 100% SMA Model IQVIA Open Claims IQVIA aEMR Optum Claims 2019 n=6278 2020 n=6167 2021 n=6489 2019 n=516 2020 n=587 2021 n=423 2019 n=449 2020 n=435 2021 n=432 Results • The number of unique individuals that met eligibility are reported in Table 2. Table 2. Final sample sizes in each cross-section Percent of Adults • Our SMA model suggests that 57% of the prevalent SMA population is 18+ years old. • In this analysis, the percentage of individuals 18+ years old was 60.1%, 85.5%, and 62.0% in OC, aEMR, and ORD, respectively, in 2021. [Figure 1] DATASET 2019 2020 2021 OC 6,280 6,170 6,491 aEMR 516 587 423 ORD 449 435 432 • A cross-sectional analysis was conducted in three commercially available real-world databases using data from 2019-2021: • IQVIA open claims (OC) • IQVIA ambulatory electronic medical records (aEMR) • Optum Research database (ORD) • Each data source had different data sourcing strategy, which is outlined in Table 1. Methods 1. Verhaart IEC, Robertson A, Wilson IJ, Aartsma-Rus A, Cameron S, Jones CC, Cook SF, Lochmüller H. Prevalence, incidence and carrier frequency of 5q-linked spinal muscular atrophy - a literature review. Orphanet J Rare Dis. 2017 Jul 4;12(1):124. 2. Cure SMA internal data. 3. Sugarman EA, Nagan N, Zhu H, Akmaev VR, Zhou Z, Rohlfs EM, et al. Pan-ethnic carrier screening and prenatal diagnosis for spinal muscular atrophy: clinical laboratory analysis of >72,400 specimens. Eur J Hum Genet. 2012 Jan;20(1):27-32. 4. https://www.census.gov/quickfacts/fact/table/US/PST045219 References Background Results Methods Results