Integrating Chisel from Facebook (Install and usage) • Creating custom Python scripts • Swift REPL • Assembly basics • Honourable Mentions • Peeping under the hood of News on the Simulator
LLDB was built as part of the LLVM project • LLDB is built upon LLVM standard libraries and uses Clang as the expression parser so it’s upto date whenever the compiler is updated
technically a system debugger library • It is the modern replacement for GDB • Attaches to your current process in Xcode when you hit a breakpoint • Contains a python module which enables you to have personalised scripts • Blazingly fast and get’s the job done
which we diagnose a problem in our source code? • Console output for a crash or NSLog • Breakpoint GUI (Gutter). Expand on types of breakpoints in the GUI • View Debugger (Inspect the view hierarchy) • Static analysers + Instruments • Finally, LLDB commands ‘p’ and ‘po’
Very powerful when used to it’s full extent • You can tackle some fairly complex problems without editing the source • Explore your run time environment • Automate repetitive debug tasks using python scripts • Breaks through the limitations of other debugging workflows
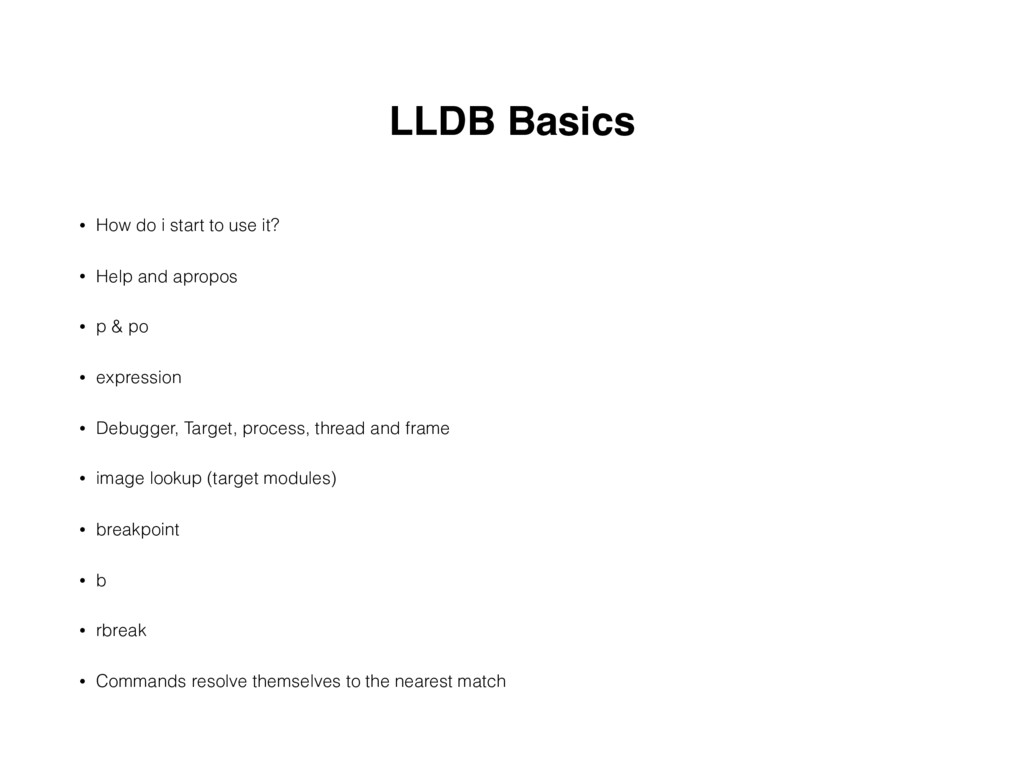
• Help and apropos • p & po • expression • Debugger, Target, process, thread and frame • image lookup (target modules) • breakpoint • b • rbreak • Commands resolve themselves to the nearest match
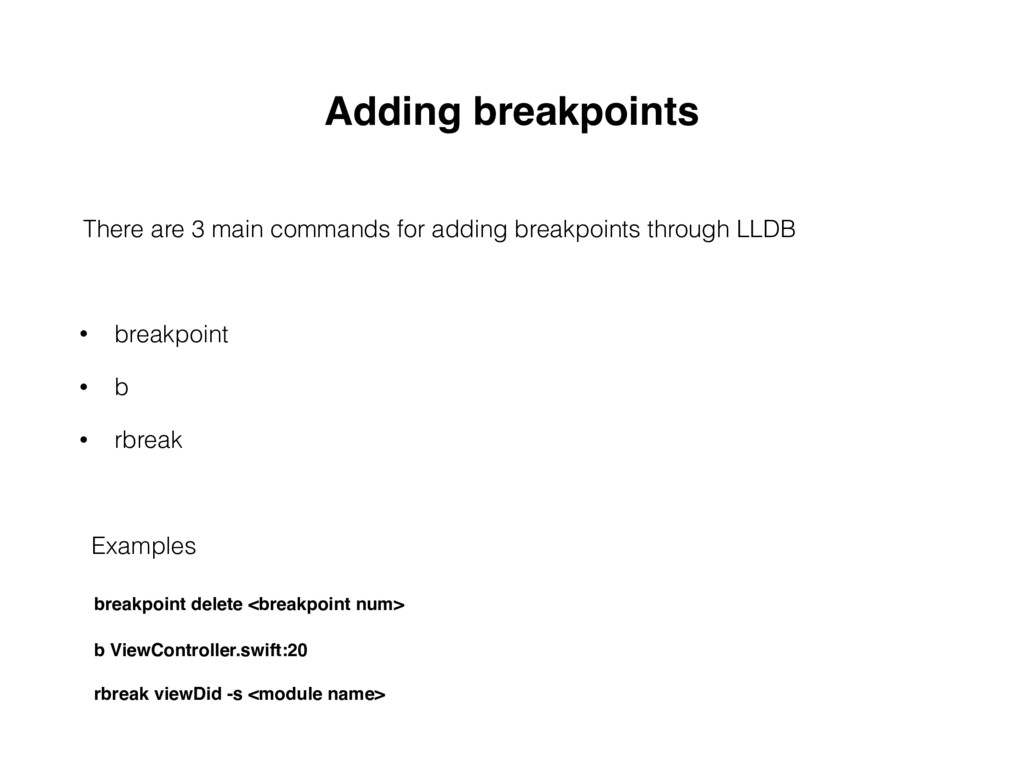
3 main commands for adding breakpoints through LLDB breakpoint delete <breakpoint num> b ViewController.swift:20 rbreak viewDid -s <module name> Examples
can also add python commands here directly using the ‘-s option’ Specifying continue as the last subroutine will prevent the breakpoint from stopping the process!
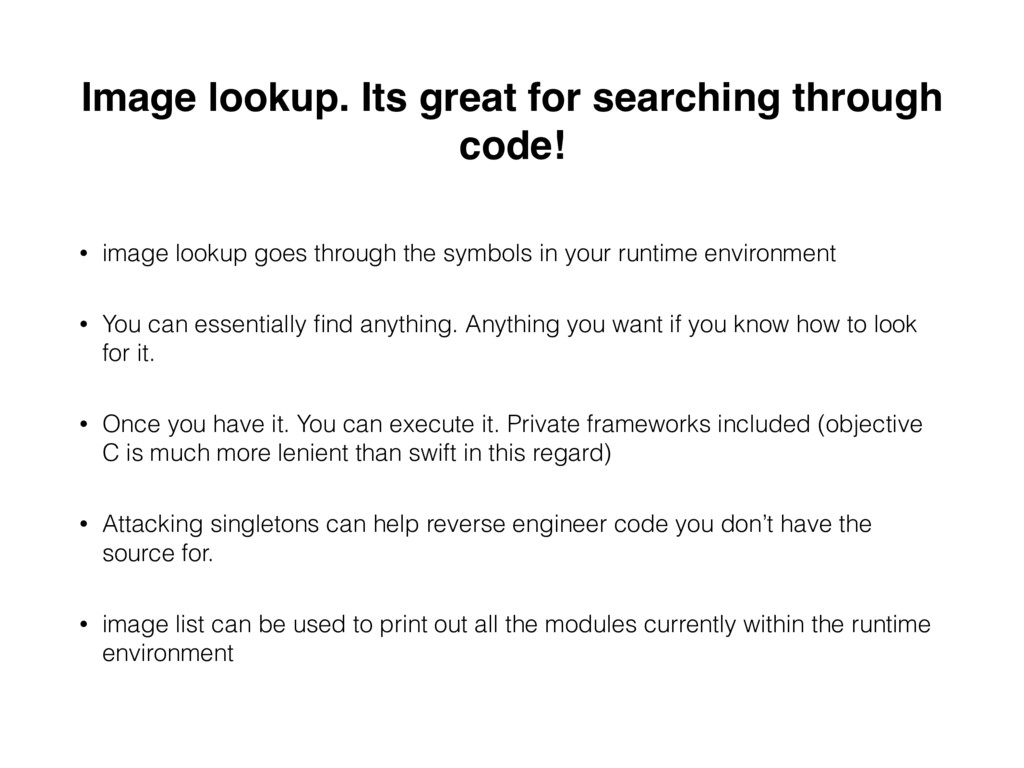
lookup goes through the symbols in your runtime environment • You can essentially find anything. Anything you want if you know how to look for it. • Once you have it. You can execute it. Private frameworks included (objective C is much more lenient than swift in this regard) • Attacking singletons can help reverse engineer code you don’t have the source for. • image list can be used to print out all the modules currently within the runtime environment
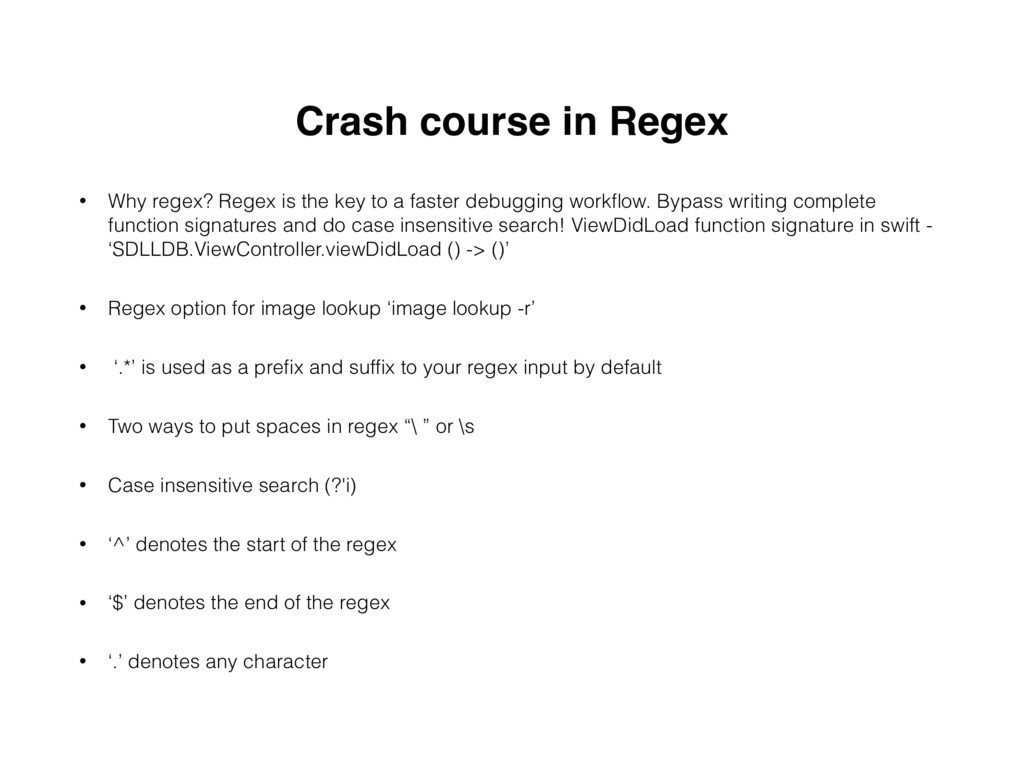
key to a faster debugging workflow. Bypass writing complete function signatures and do case insensitive search! ViewDidLoad function signature in swift - ‘SDLLDB.ViewController.viewDidLoad () -> ()’ • Regex option for image lookup ‘image lookup -r’ • ‘.*’ is used as a prefix and suffix to your regex input by default • Two ways to put spaces in regex “\ ” or \s • Case insensitive search (?'i) • ‘^’ denotes the start of the regex • ‘$’ denotes the end of the regex • ‘.’ denotes any character
we’ve learned • I want to break on a particular setter which is autosynthesized by the compiler without adding it to the source and using a GUI breakpoint. Heck i want all of them implemented by a certain class. • Put a breakpoint on the setter and getter using a single command.
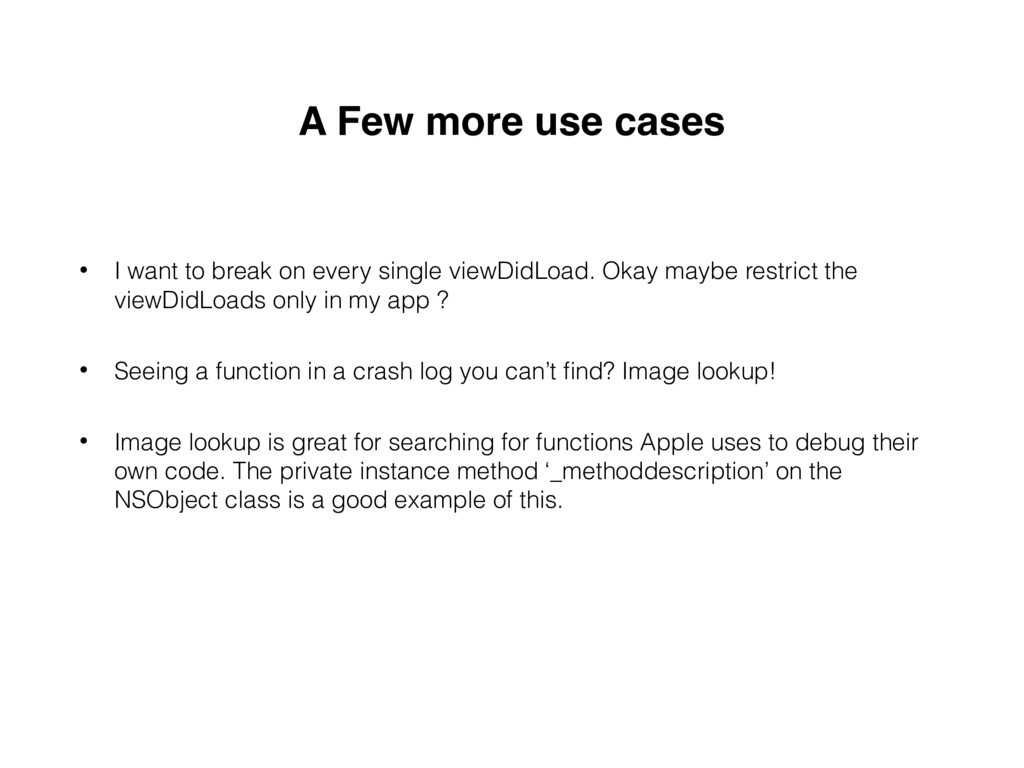
on every single viewDidLoad. Okay maybe restrict the viewDidLoads only in my app ? • Seeing a function in a crash log you can’t find? Image lookup! • Image lookup is great for searching for functions Apple uses to debug their own code. The private instance method ‘_methoddescription’ on the NSObject class is a good example of this.
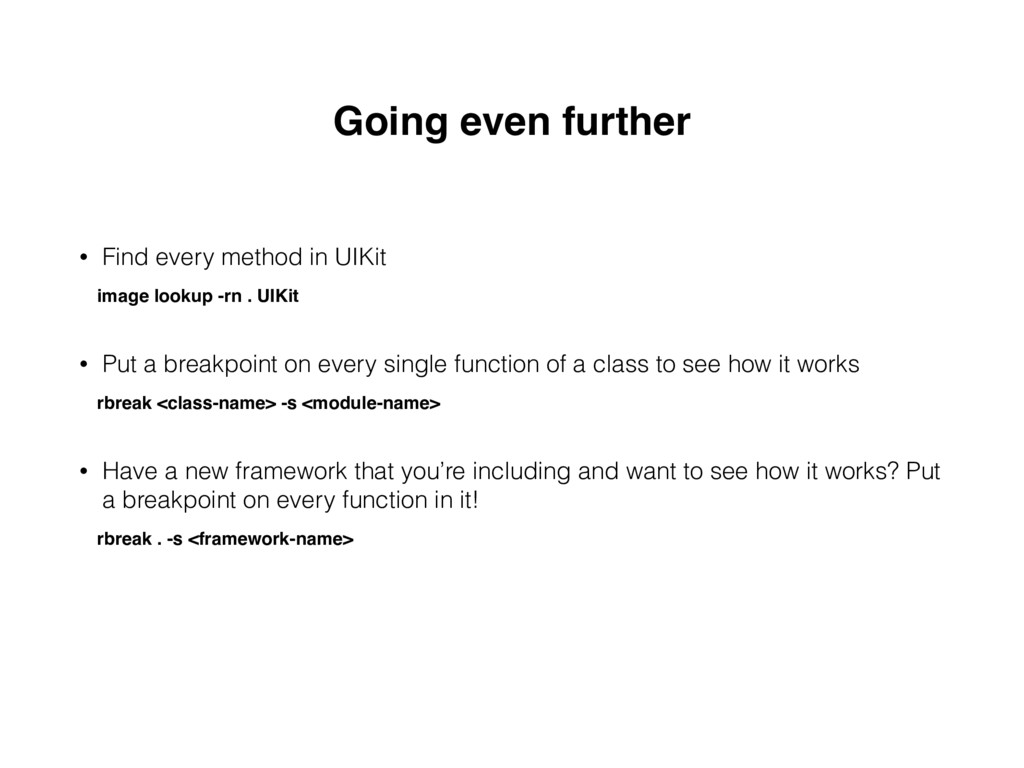
lookup -rn . UIKit • Put a breakpoint on every single function of a class to see how it works rbreak <class-name> -s <module-name> • Have a new framework that you’re including and want to see how it works? Put a breakpoint on every function in it! rbreak . -s <framework-name>
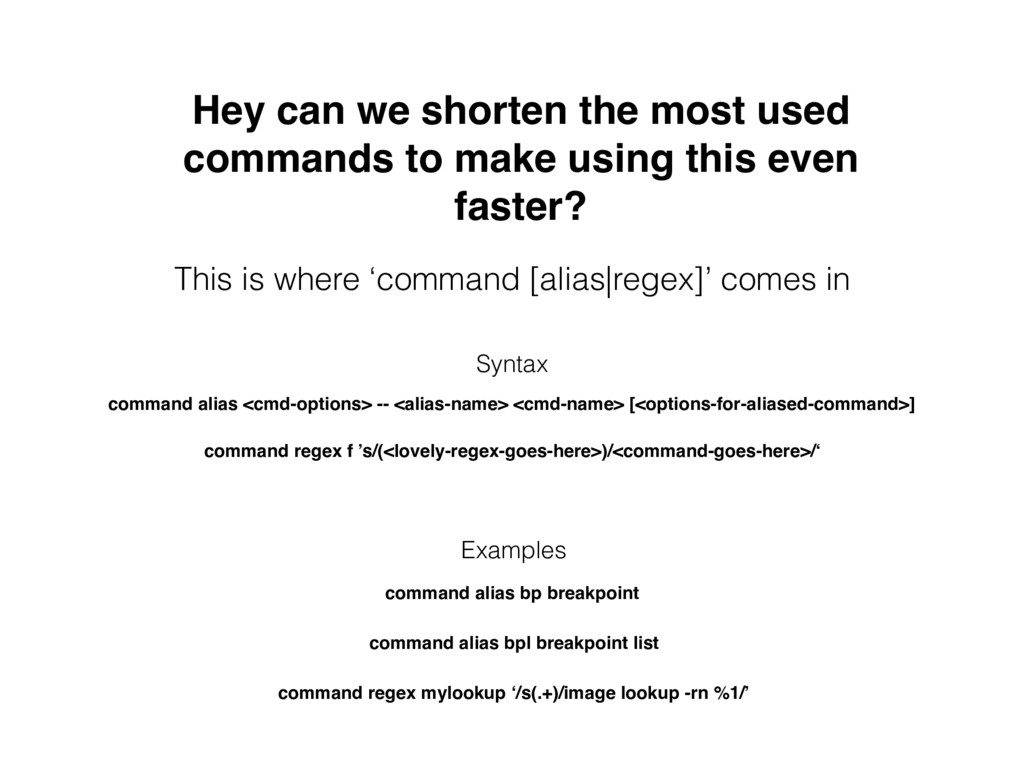
using this even faster? This is where ‘command [alias|regex]’ comes in command alias <cmd-options> -- <alias-name> <cmd-name> [<options-for-aliased-command>] Examples command alias bp breakpoint command alias bpl breakpoint list command regex mylookup ‘/s(.+)/image lookup -rn %1/’ command regex f ’s/(<lovely-regex-goes-here>)/<command-goes-here>/‘ Syntax
particular debug session instance. The next time Xcode launches, they will not be available • LLDB initialisation file • LLDB looks for this file at the path ‘~/.lldbinit-Xcode’, specifically for Xcode. If it can’t find this, it will default to ‘~/.lldbinit’ and if it can’t find that either then it will skip this step. • How do we go about creating lldbinit? • We can put aliases, LLDB settings and python script imports here and they will get loaded into Xcode every time we attach our process to LLDB!
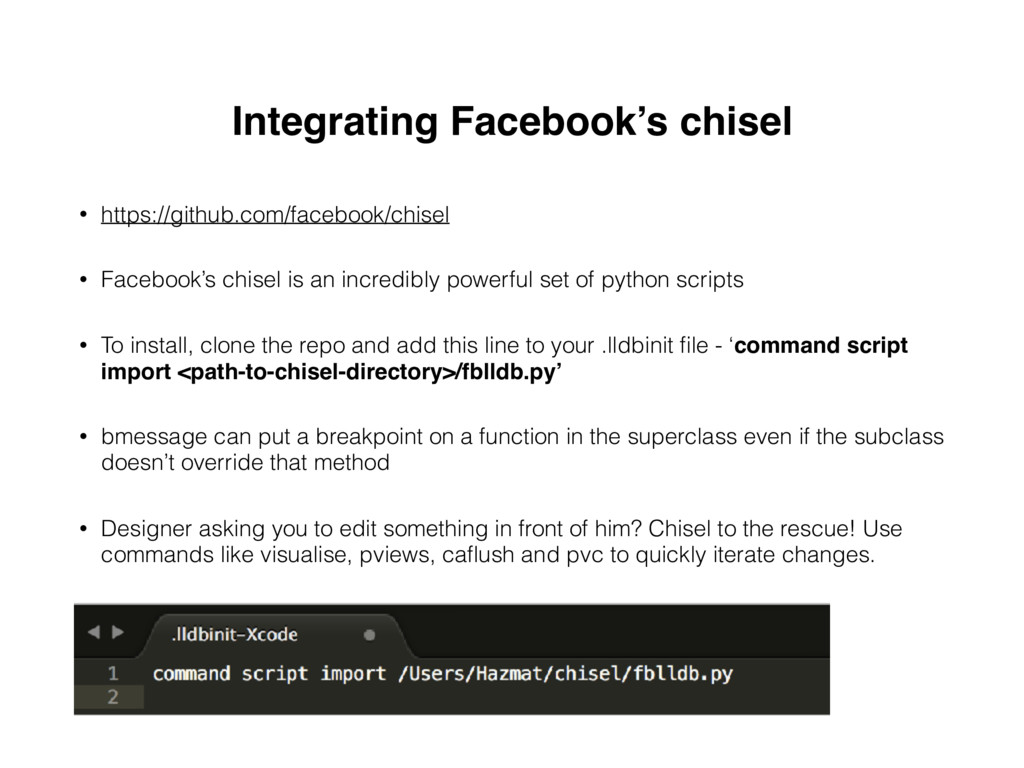
incredibly powerful set of python scripts • To install, clone the repo and add this line to your .lldbinit file - ‘command script import <path-to-chisel-directory>/fblldb.py’ • bmessage can put a breakpoint on a function in the superclass even if the subclass doesn’t override that method • Designer asking you to edit something in front of him? Chisel to the rescue! Use commands like visualise, pviews, caflush and pvc to quickly iterate changes.
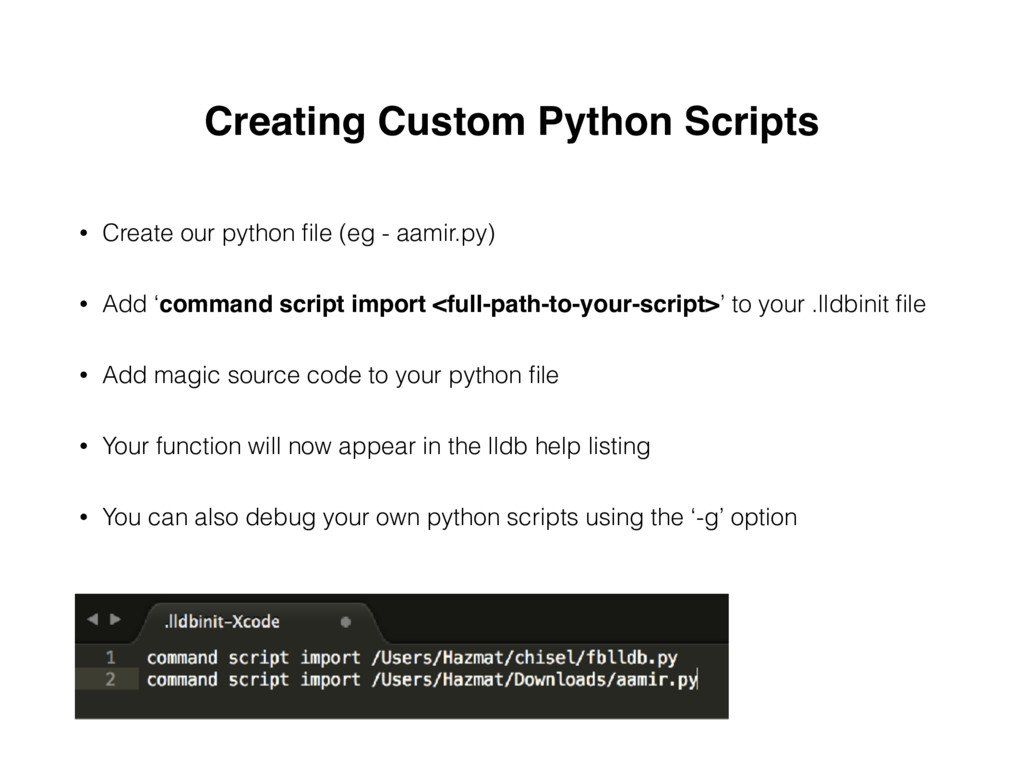
- aamir.py) • Add ‘command script import <full-path-to-your-script>’ to your .lldbinit file • Add magic source code to your python file • Your function will now appear in the lldb help listing • You can also debug your own python scripts using the ‘-g’ option
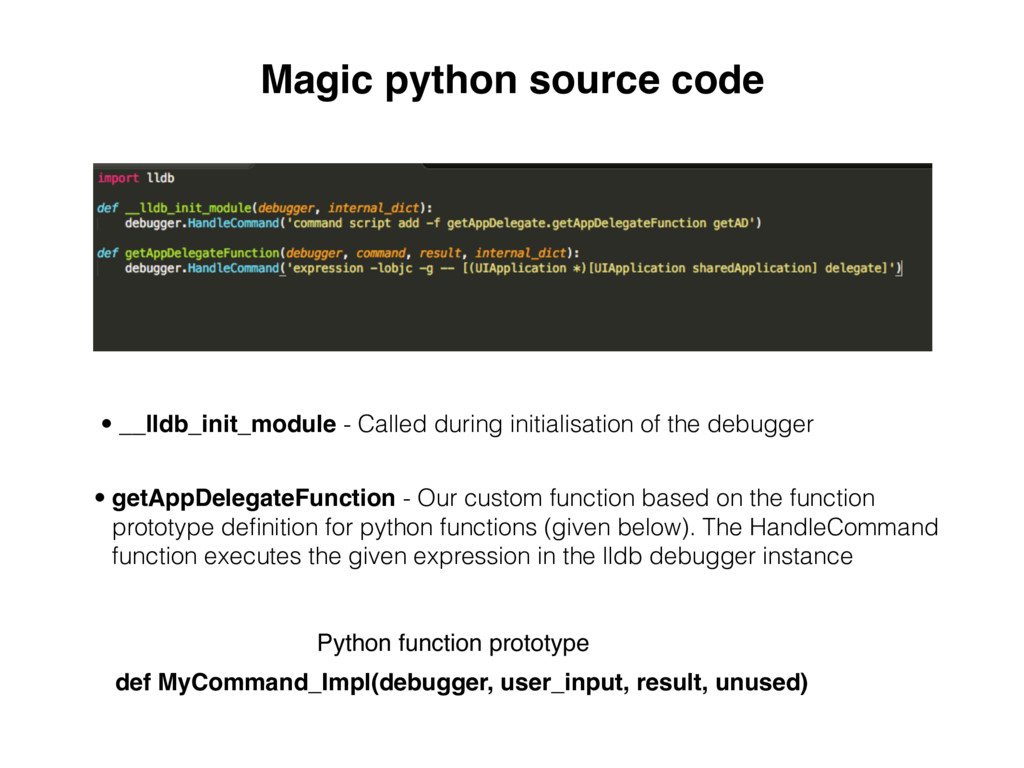
of the debugger • getAppDelegateFunction - Our custom function based on the function prototype definition for python functions (given below). The HandleCommand function executes the given expression in the lldb debugger instance Python function prototype def MyCommand_Impl(debugger, user_input, result, unused)
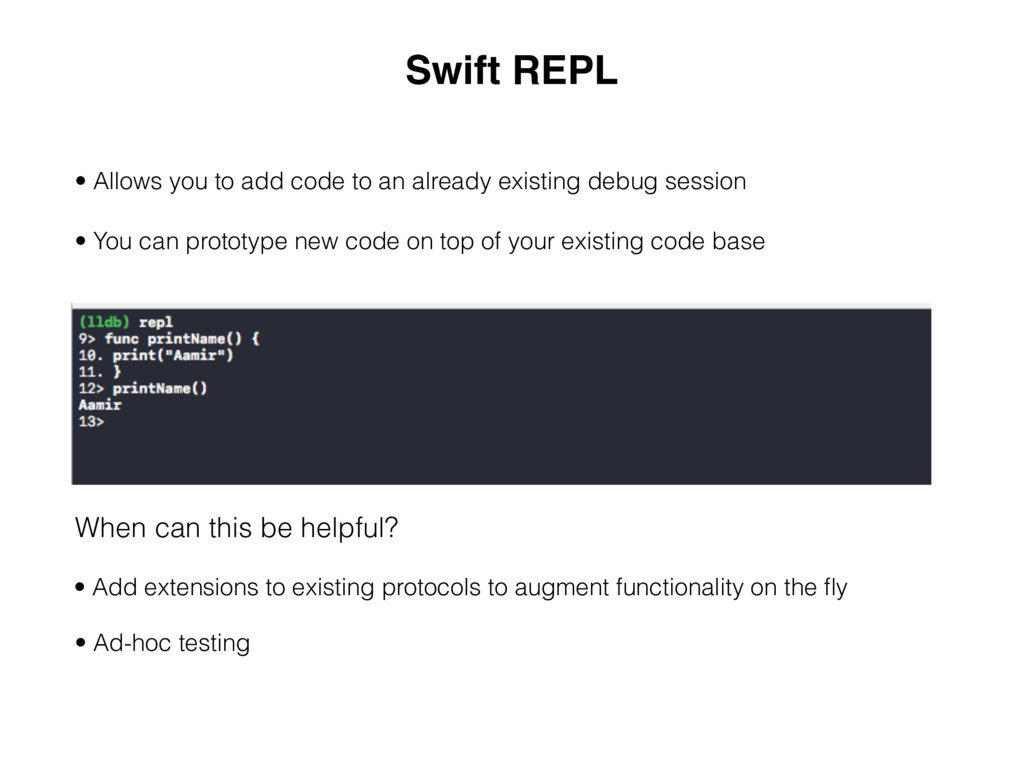
already existing debug session • You can prototype new code on top of your existing code base When can this be helpful? • Add extensions to existing protocols to augment functionality on the fly • Ad-hoc testing
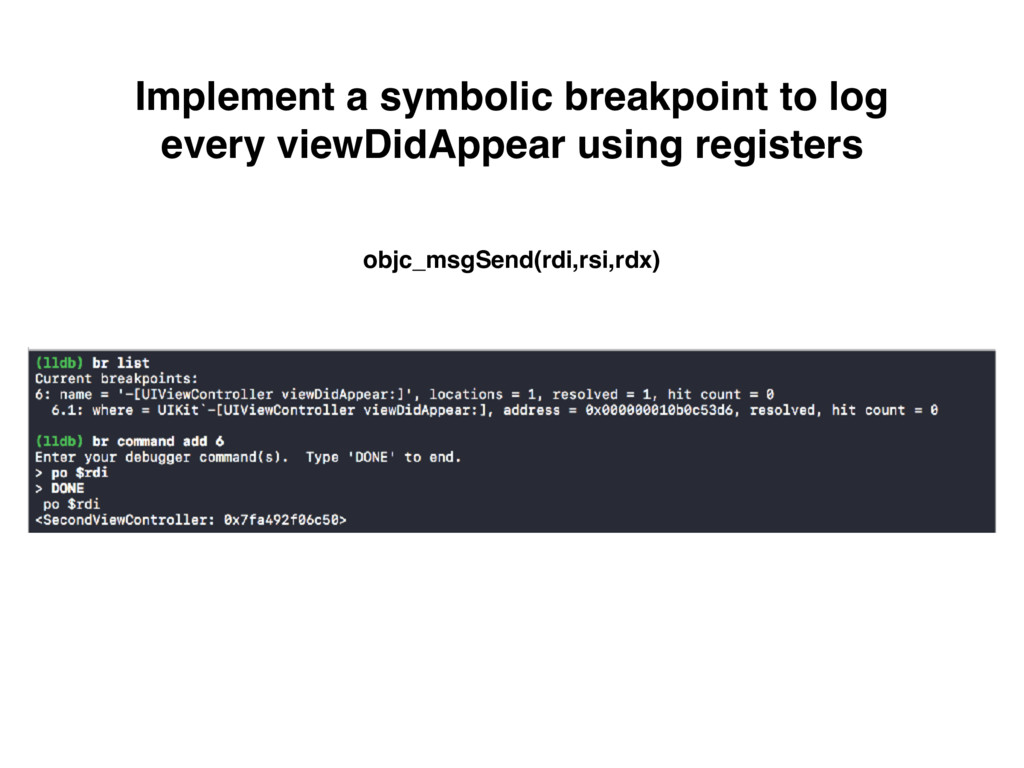
x86(macOS) and ARM(iOS) • Two flavours of assembly - Intel vs AT&T • Assembly format - operand destination source (xor rdi rdi) Register Calling Conventions First parameter - $rdi Second parameter - $rsi Third parameter - $rdx Fourth parameter - $rcx Return value - $rax
is also available via the terminal • Custom Data formatters • https://github.com/neonichu/trolldrop • 413 - Advanced Debugging WWDC2013 • Advanced Apple Debugging & Reverse Engineering - Derek Selander
![Explore source code within the debugger l [line-num] You can](https://files.speakerdeck.com/presentations/eb59410d0cda43f6b7bcccbeab360a93/slide_11.jpg)
![Adding actions to breakpoints breakpoint command add <cmd-options> [<breakpt-id>] You](https://files.speakerdeck.com/presentations/eb59410d0cda43f6b7bcccbeab360a93/slide_13.jpg)