DevOps Days 2015 Tel Aviv - Real Time Metrics and Distributed Monitoring
Talk given at DevOps Days 2015 Tel Aviv on how we at Change.org put in a real-time metrics and monitoring system, got engineering-wide adoption to make it useful, and the gains we got out of it!
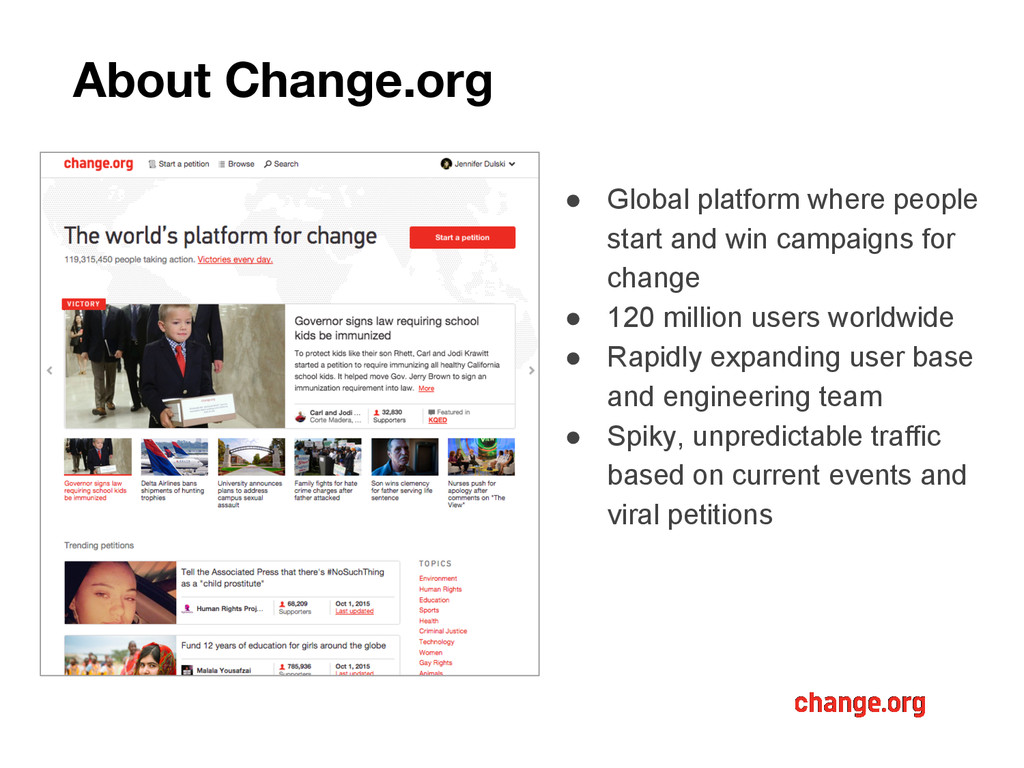
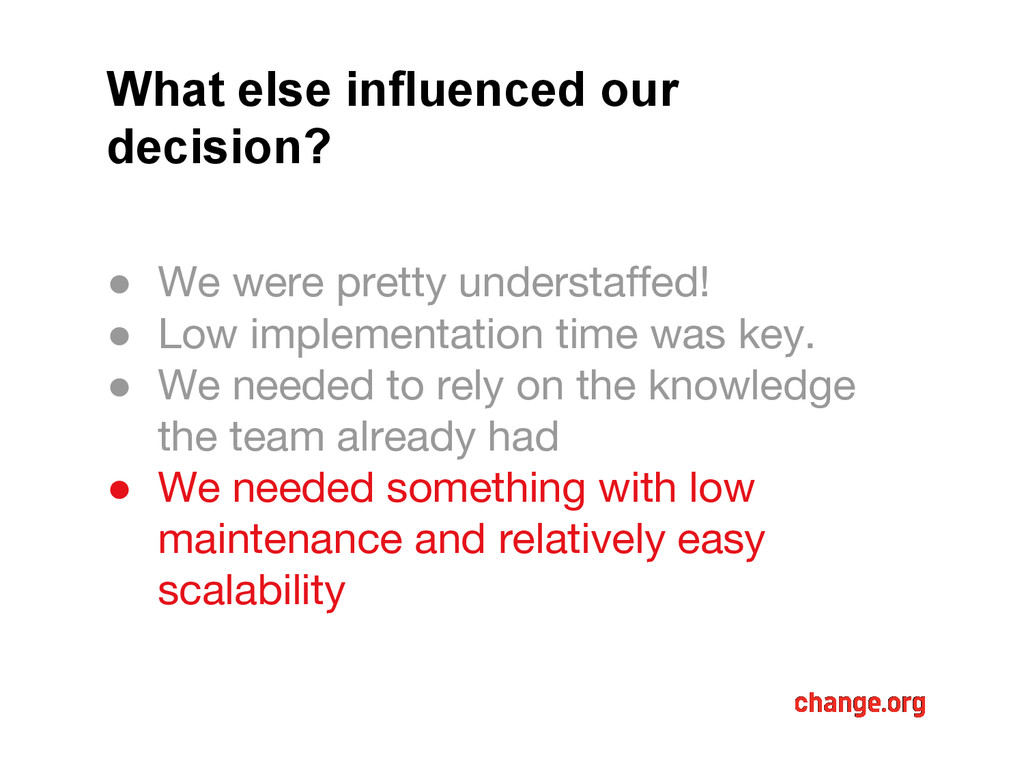
campaigns for change • 120 million users worldwide • Rapidly expanding user base and engineering team • Spiky, unpredictable traffic based on current events and viral petitions
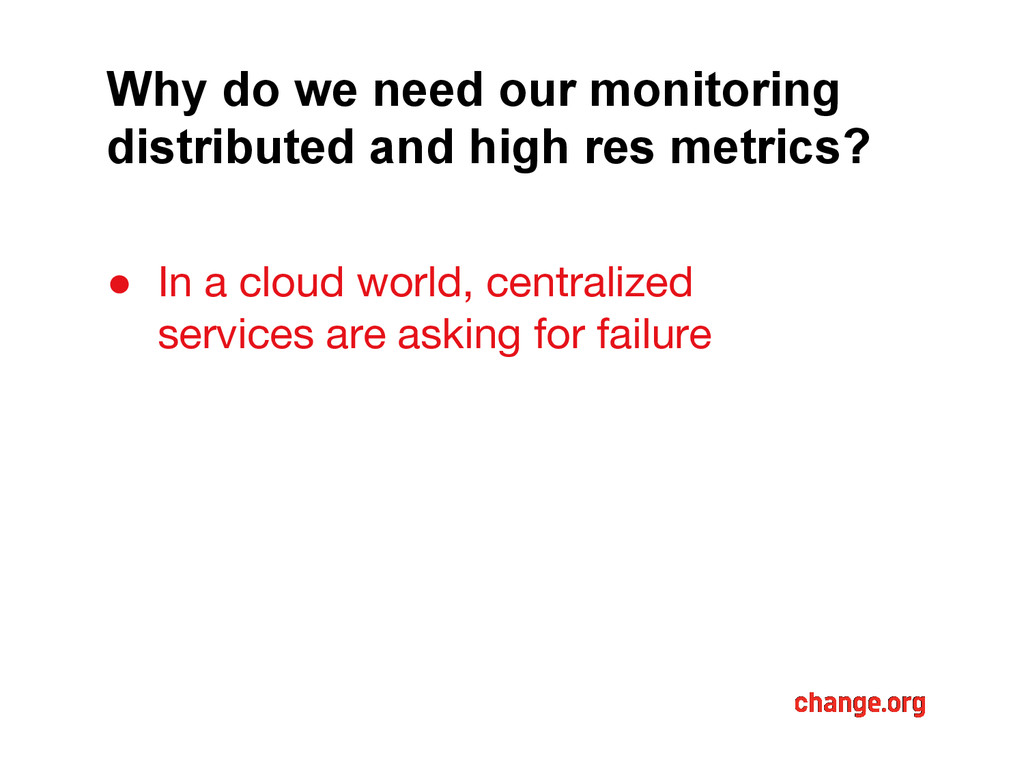
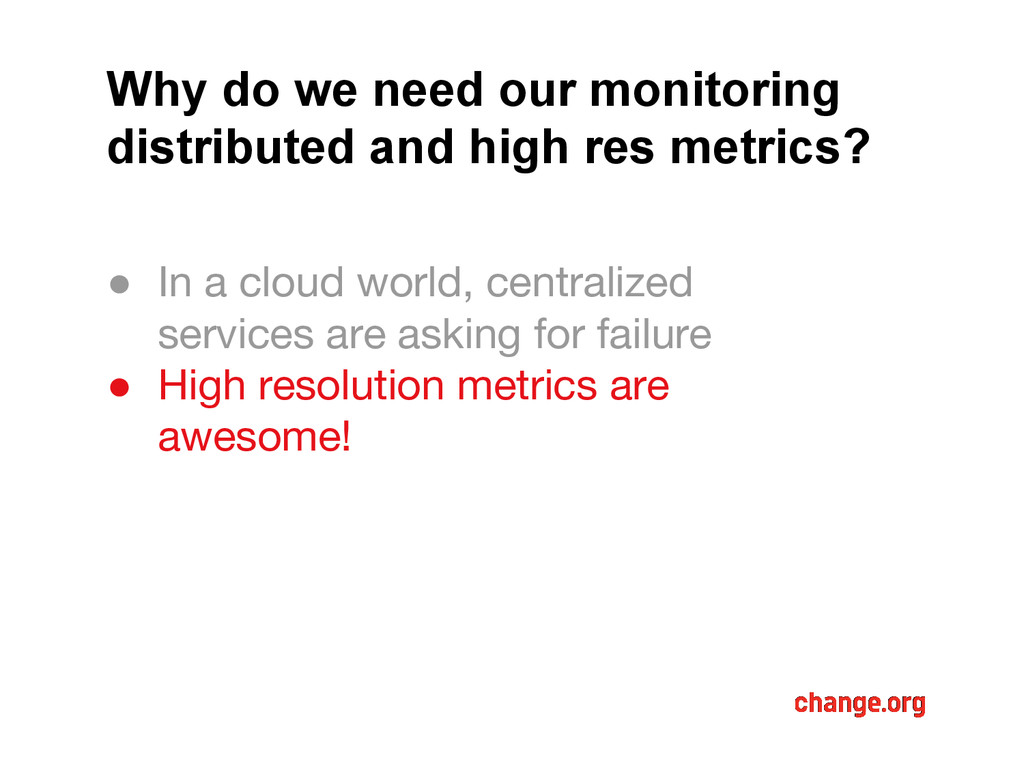
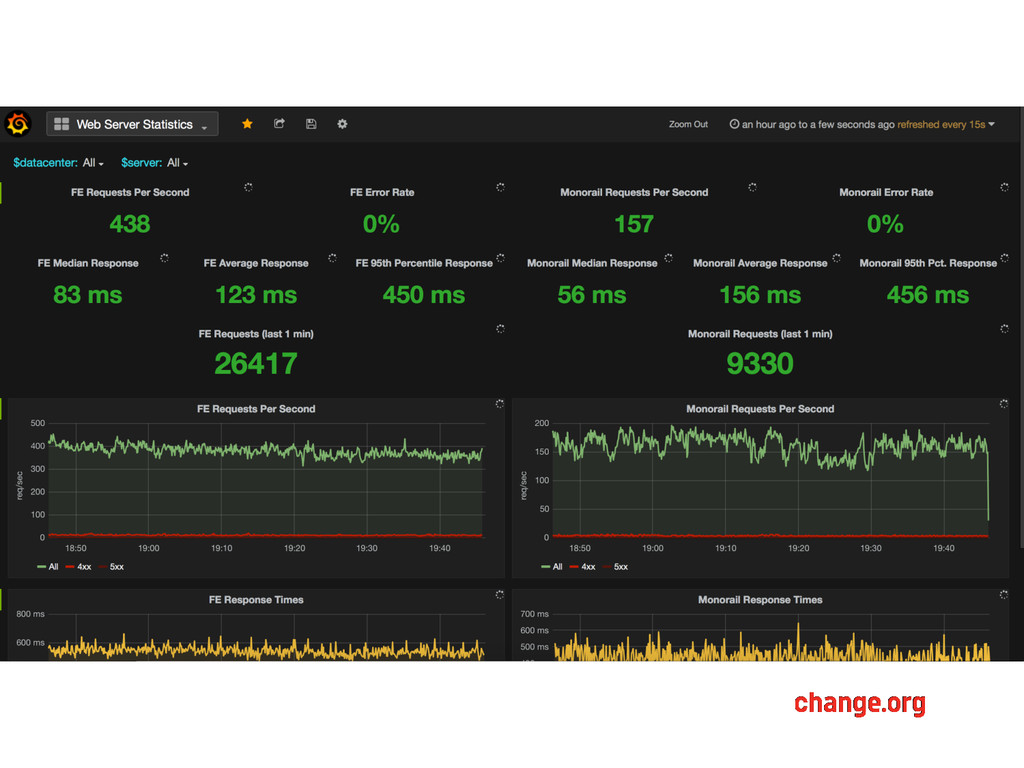
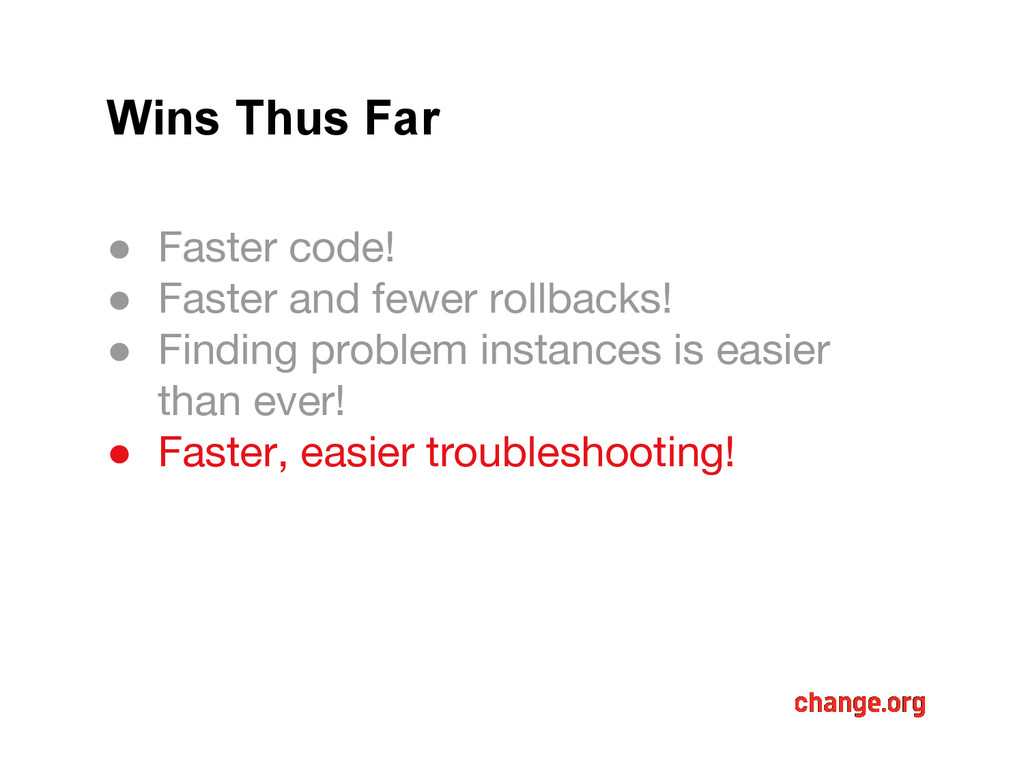
metrics? • In a cloud world, centralized services are asking for failure • High resolution metrics are awesome! • Faster response time to outages • Able to autoscale on our own terms
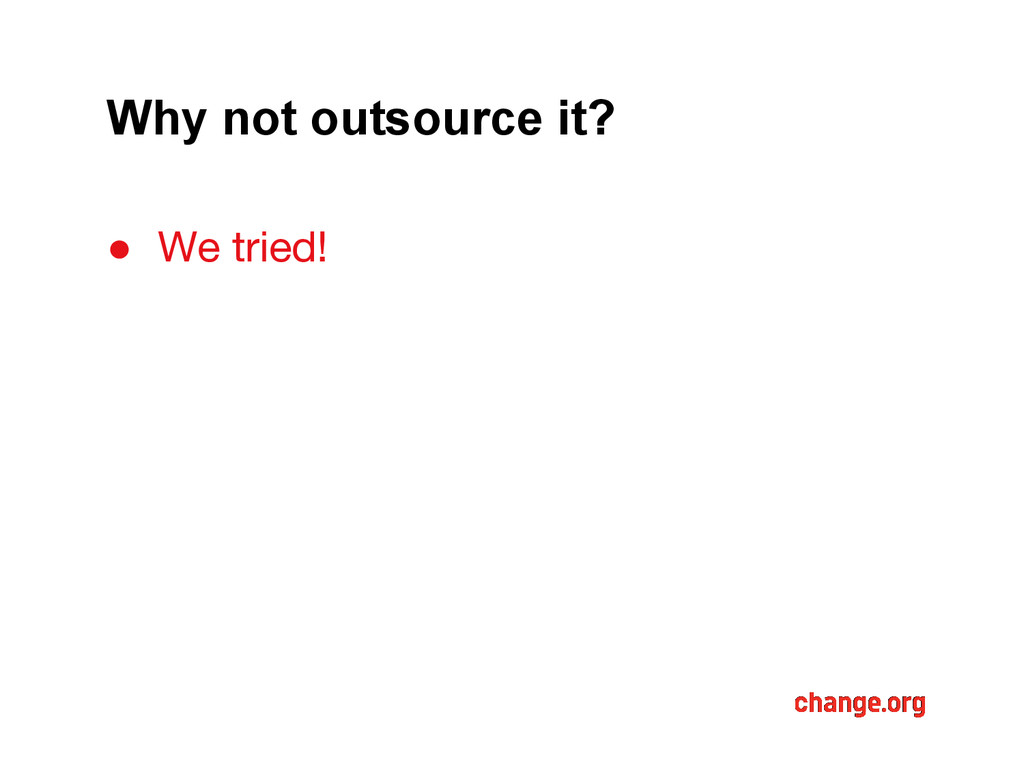
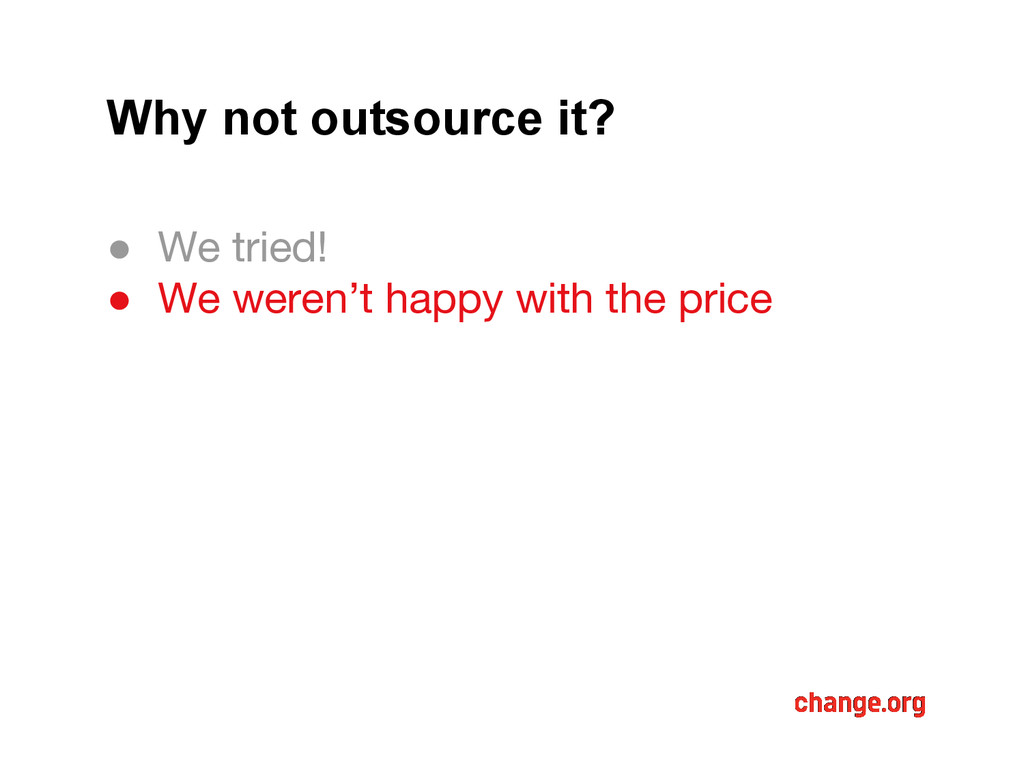
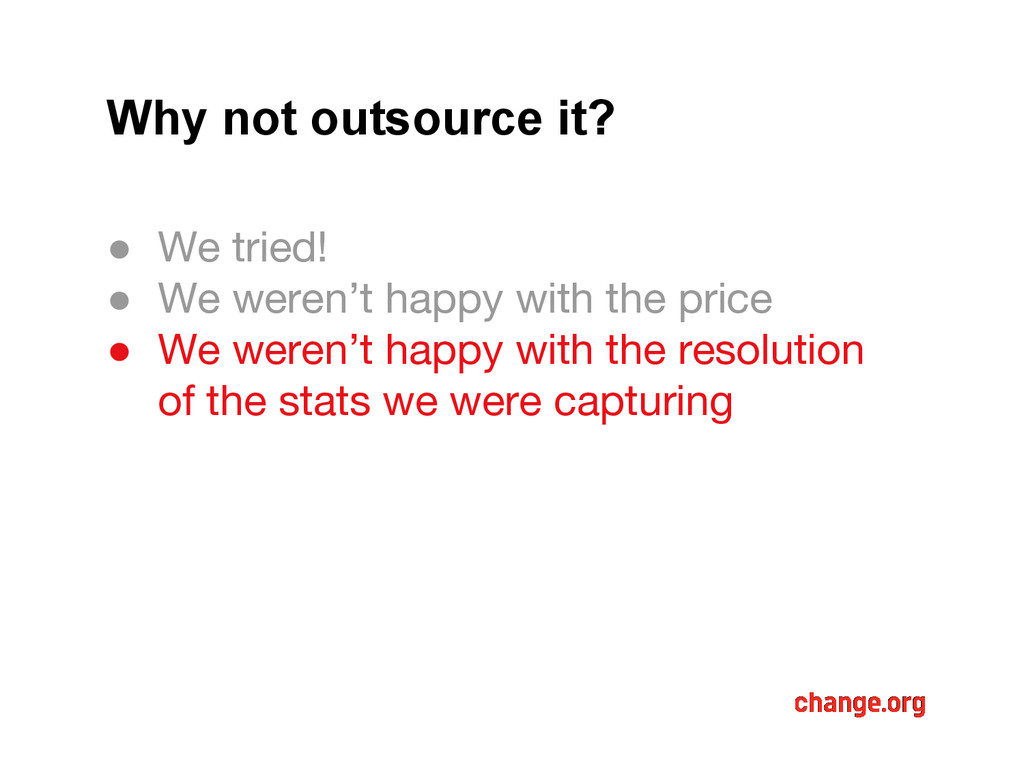
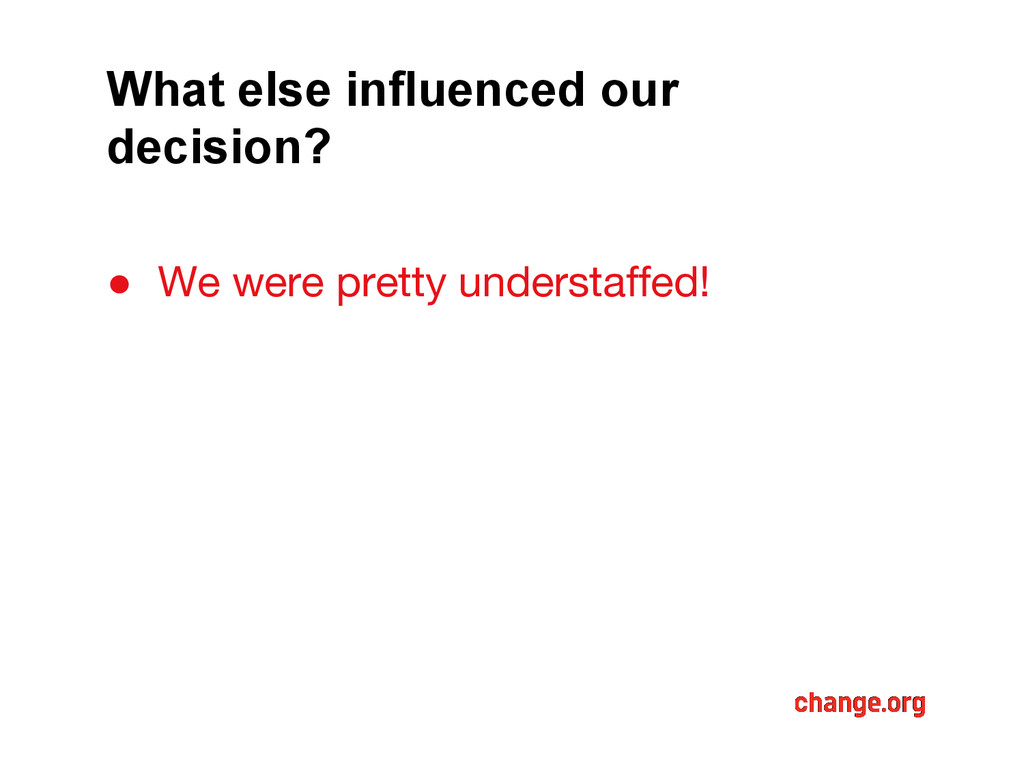
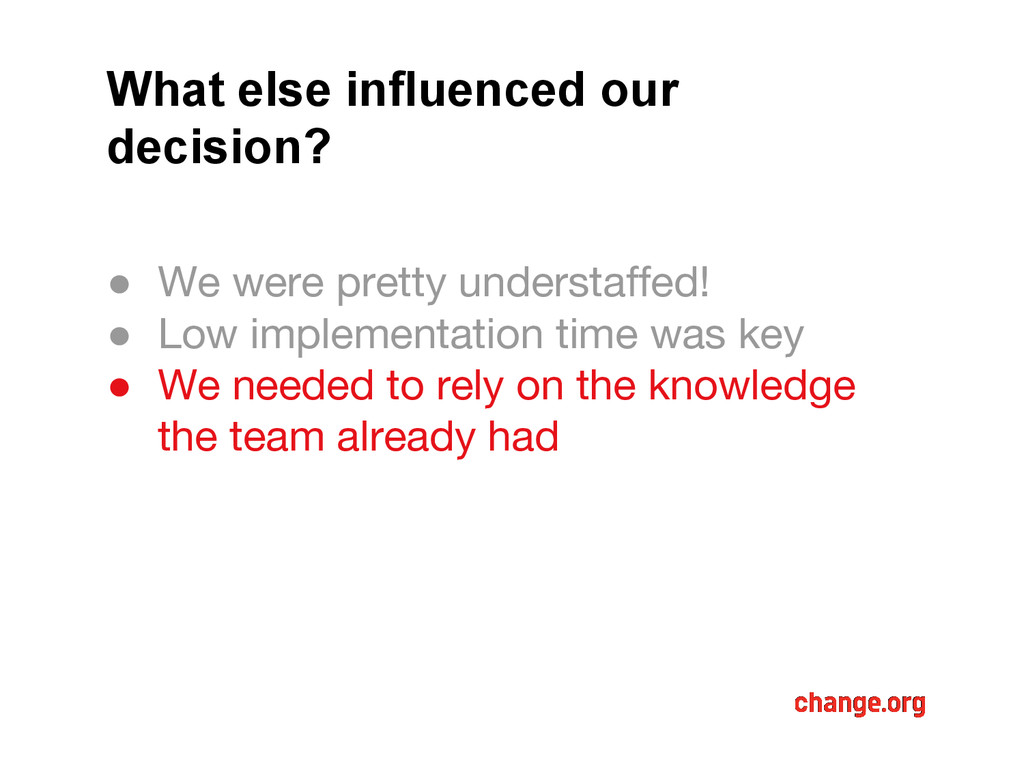
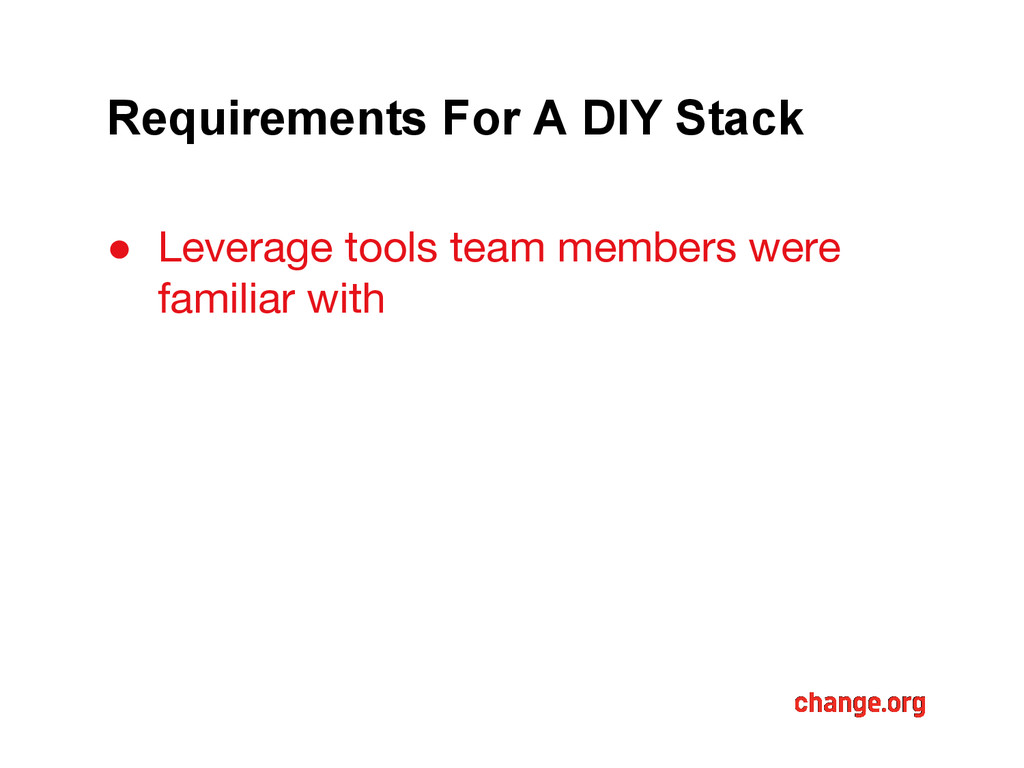
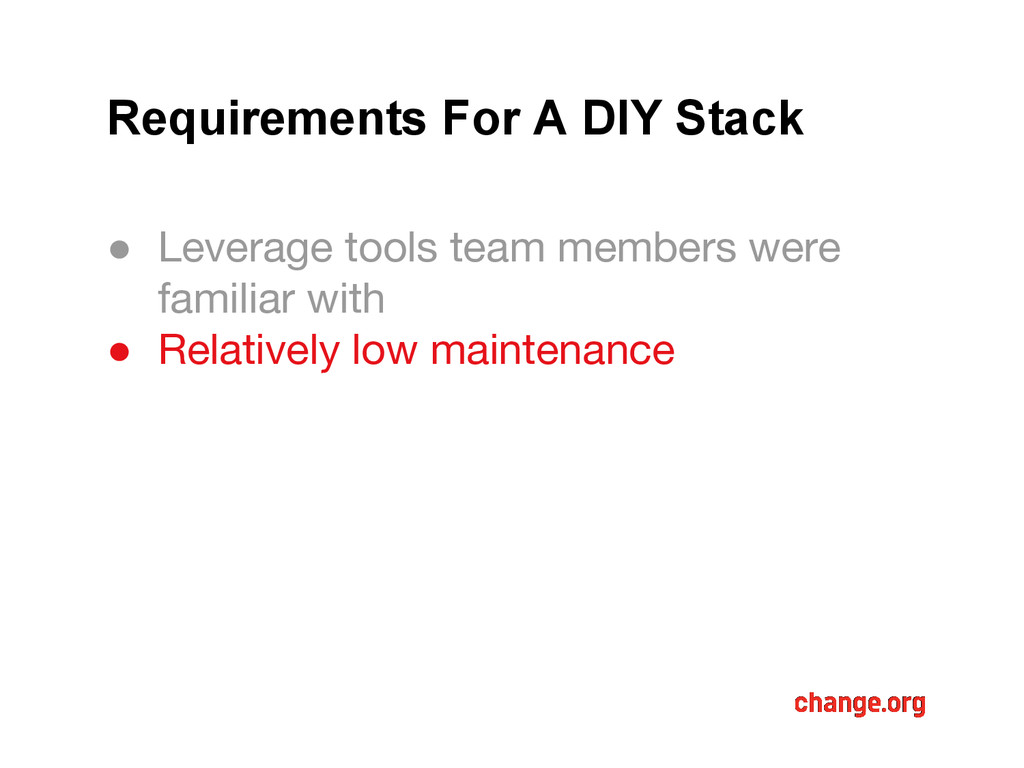
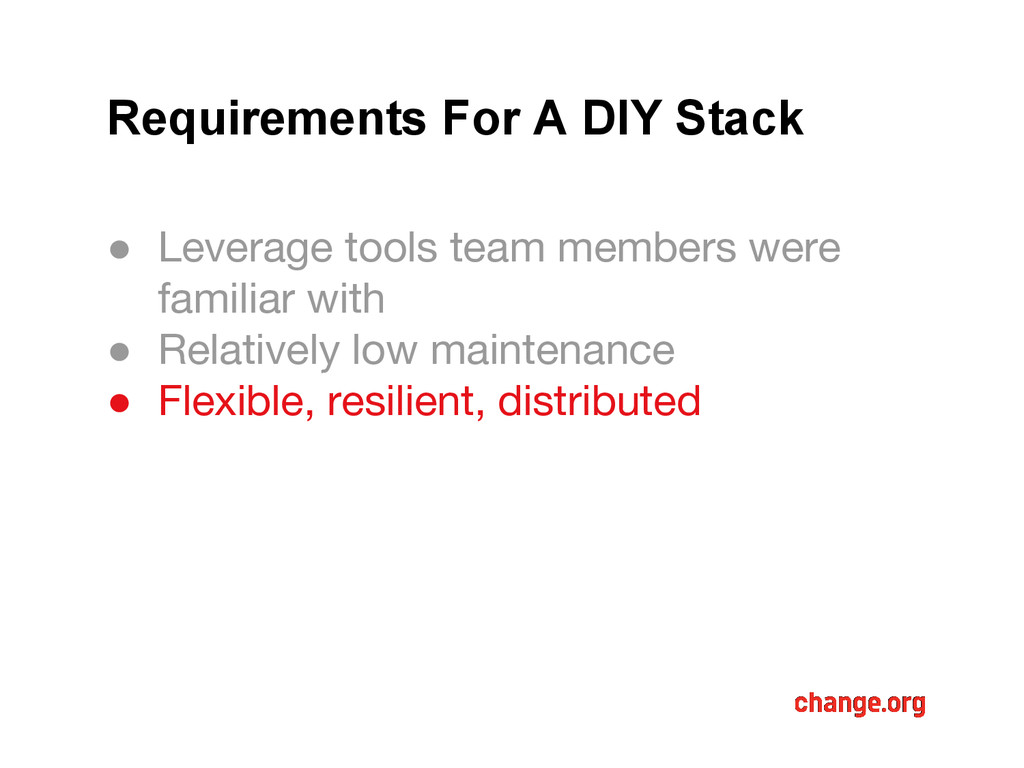
• Low implementation time was key. • We needed to rely on the knowledge the team already had • We needed something with low maintenance and relatively easy scalability
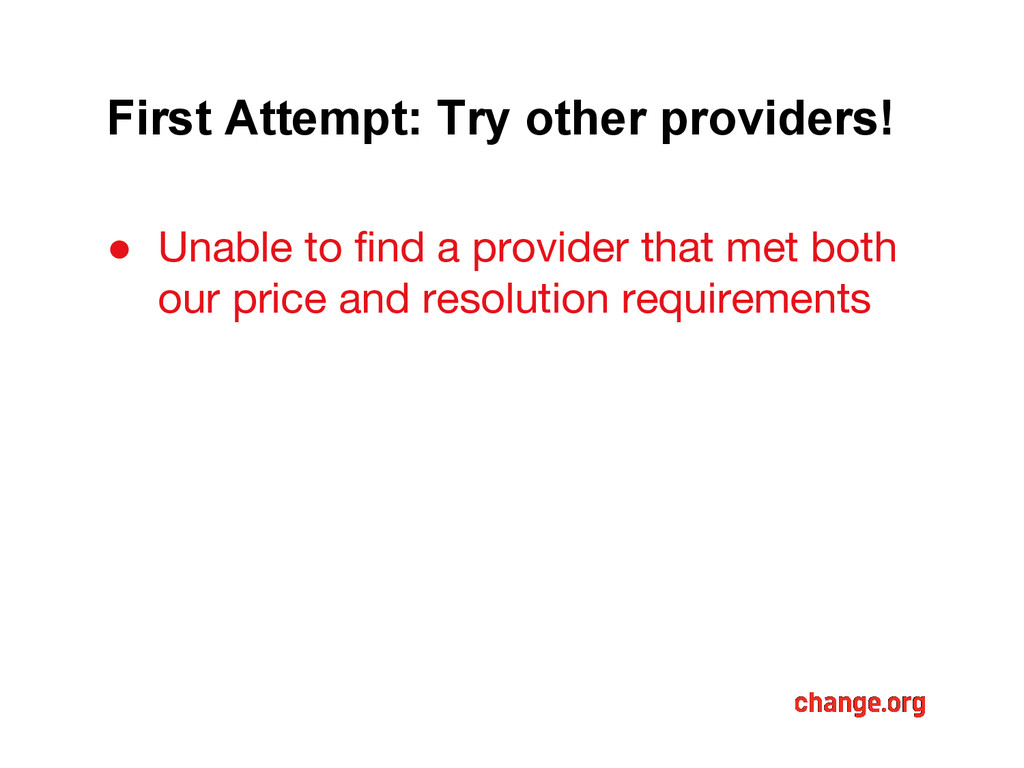
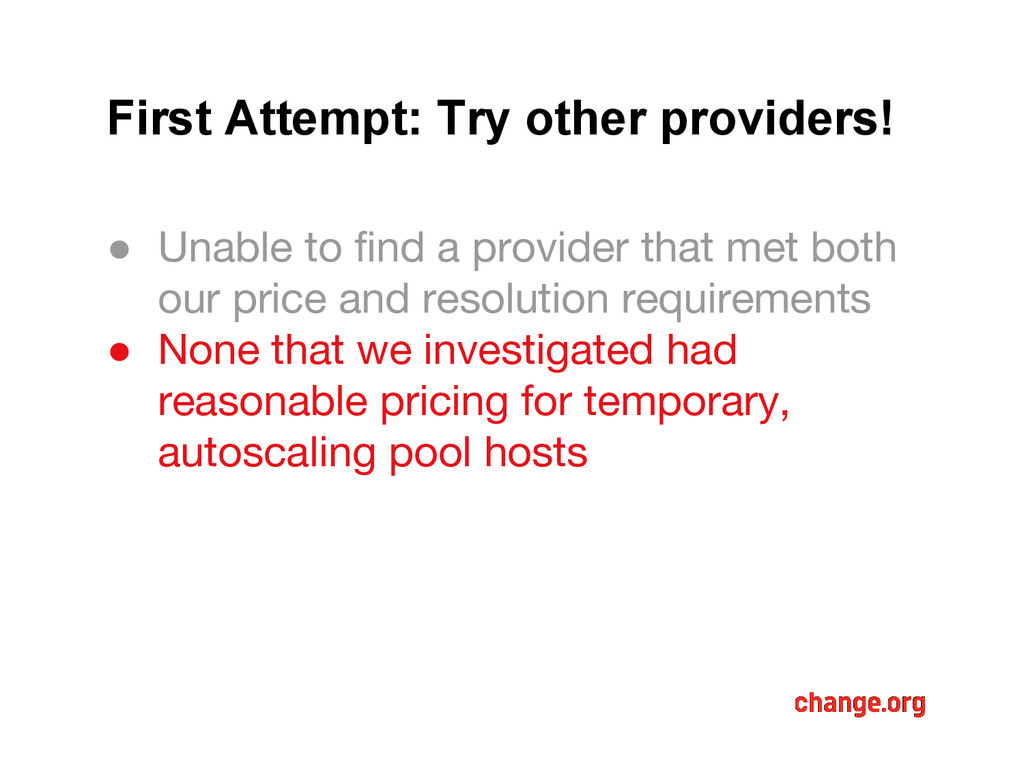
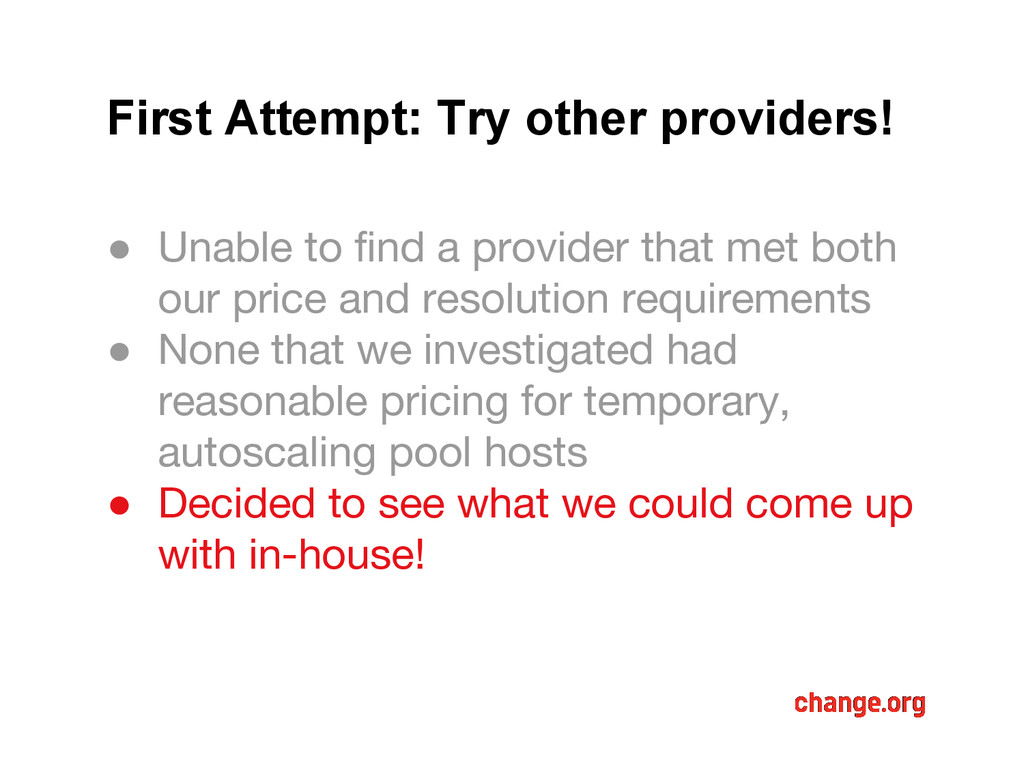
provider that met both our price and resolution requirements • None that we investigated had reasonable pricing for temporary, autoscaling pool hosts • Decided to see what we could come up with in-house!
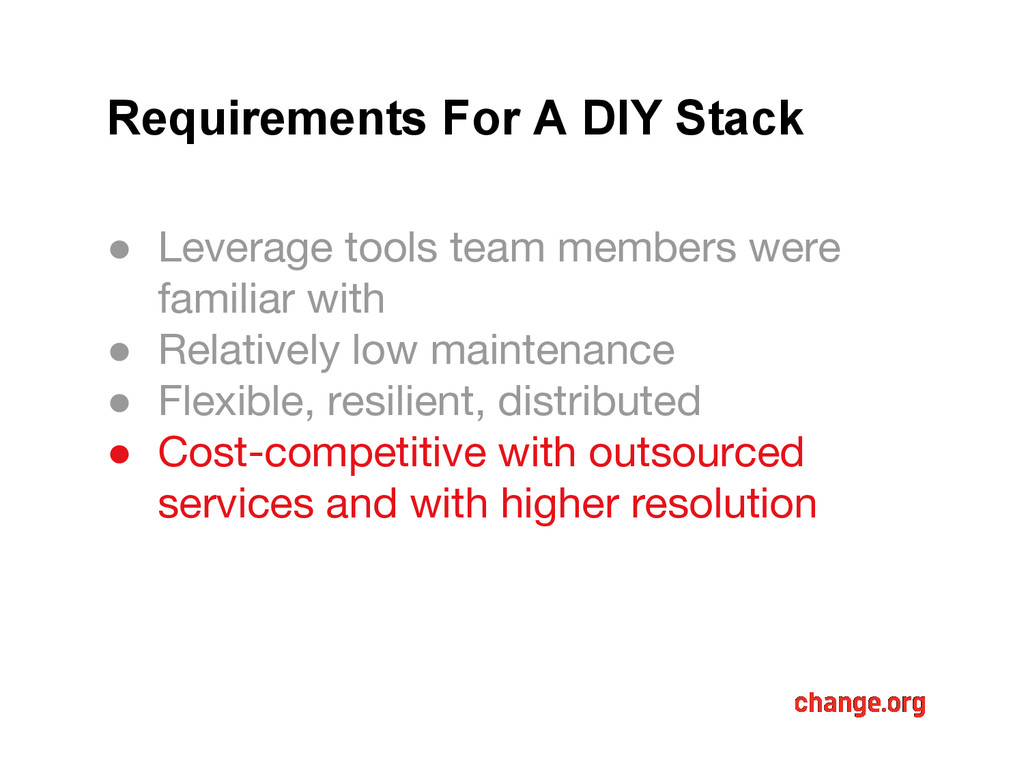
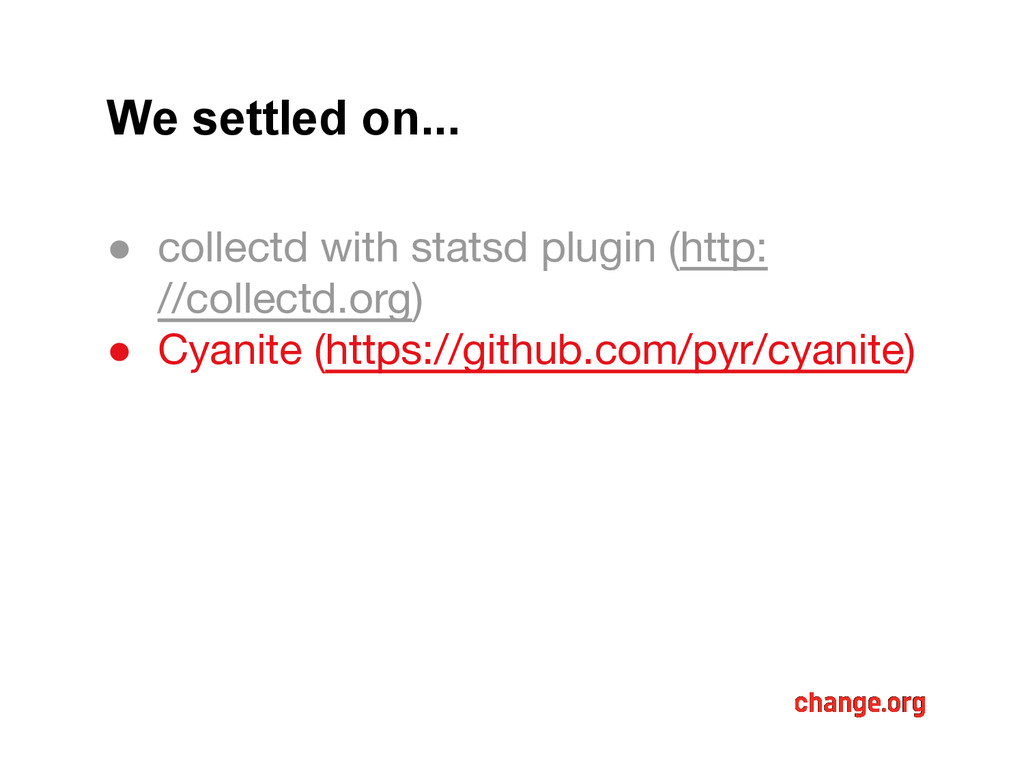
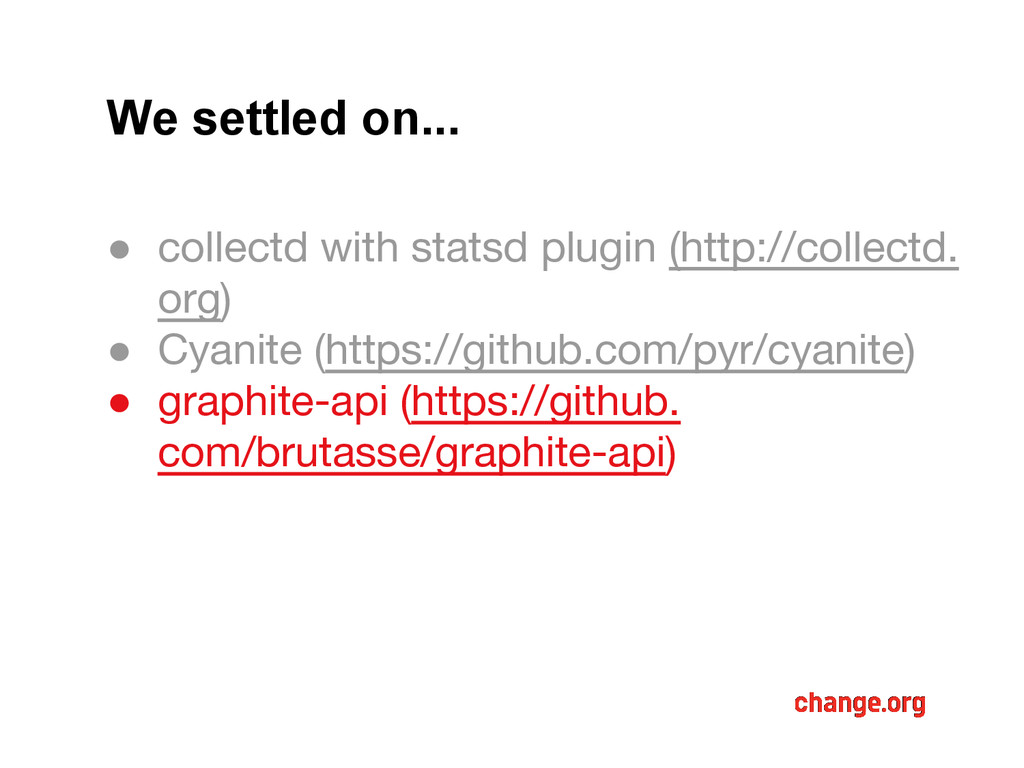
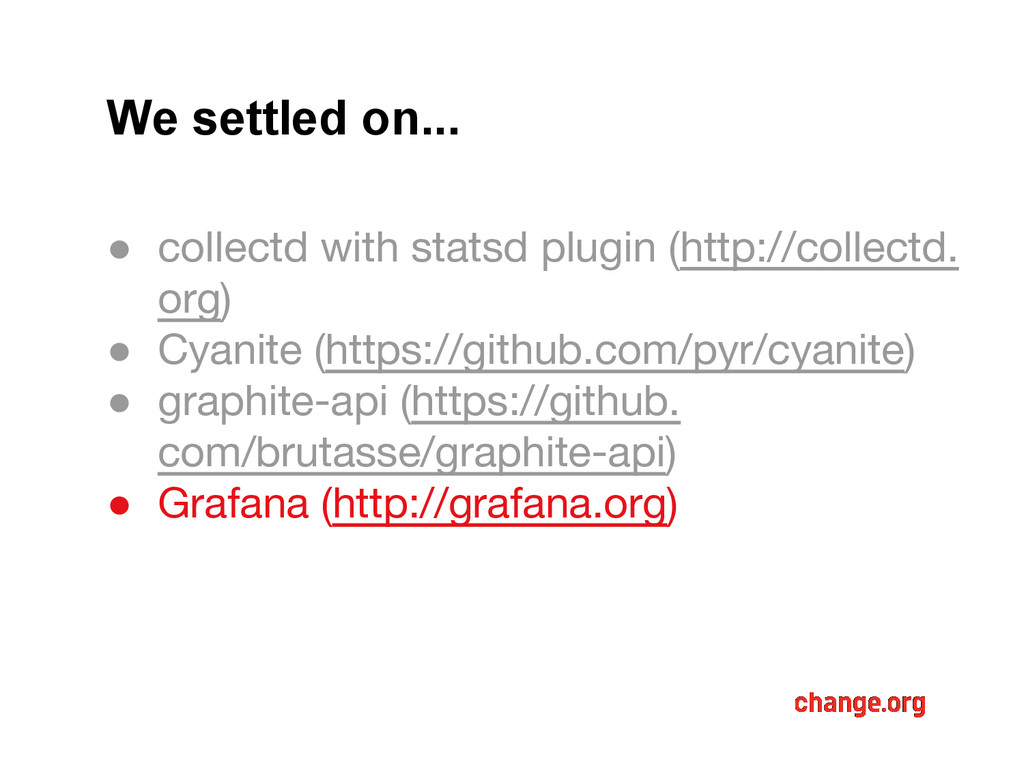
were familiar with • Relatively low maintenance • Flexible, resilient, distributed • Cost-competitive with outsourced services and with higher resolution
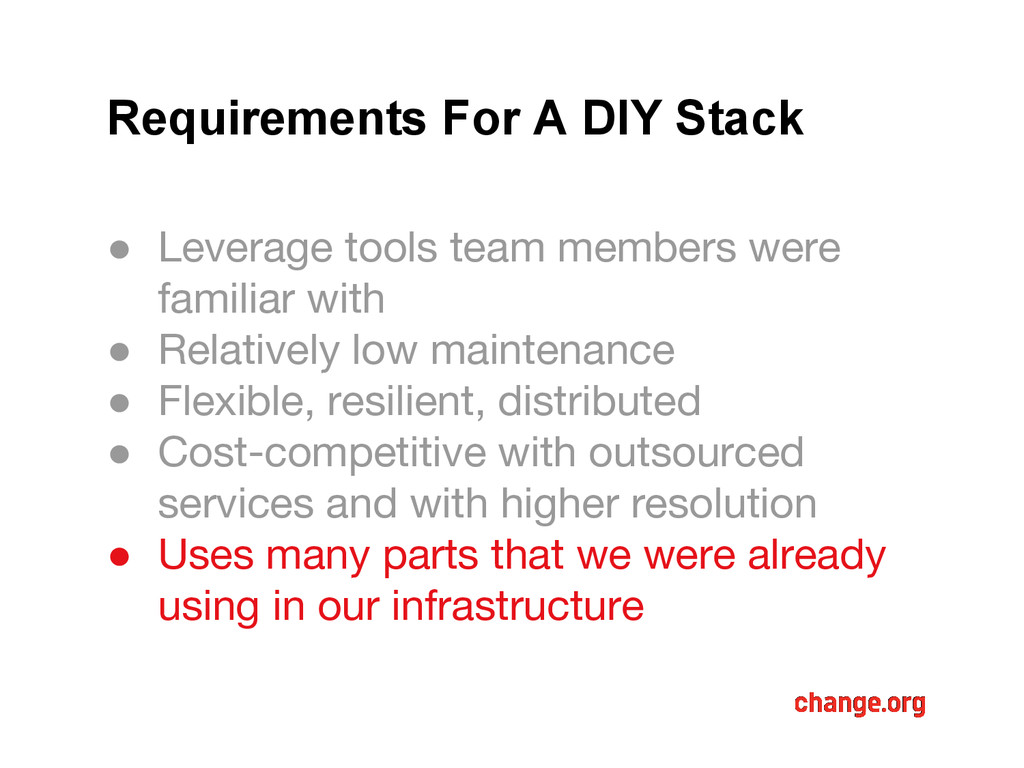
were familiar with • Relatively low maintenance • Flexible, resilient, distributed • Cost-competitive with outsourced services and with higher resolution • Uses many parts that we were already using in our infrastructure
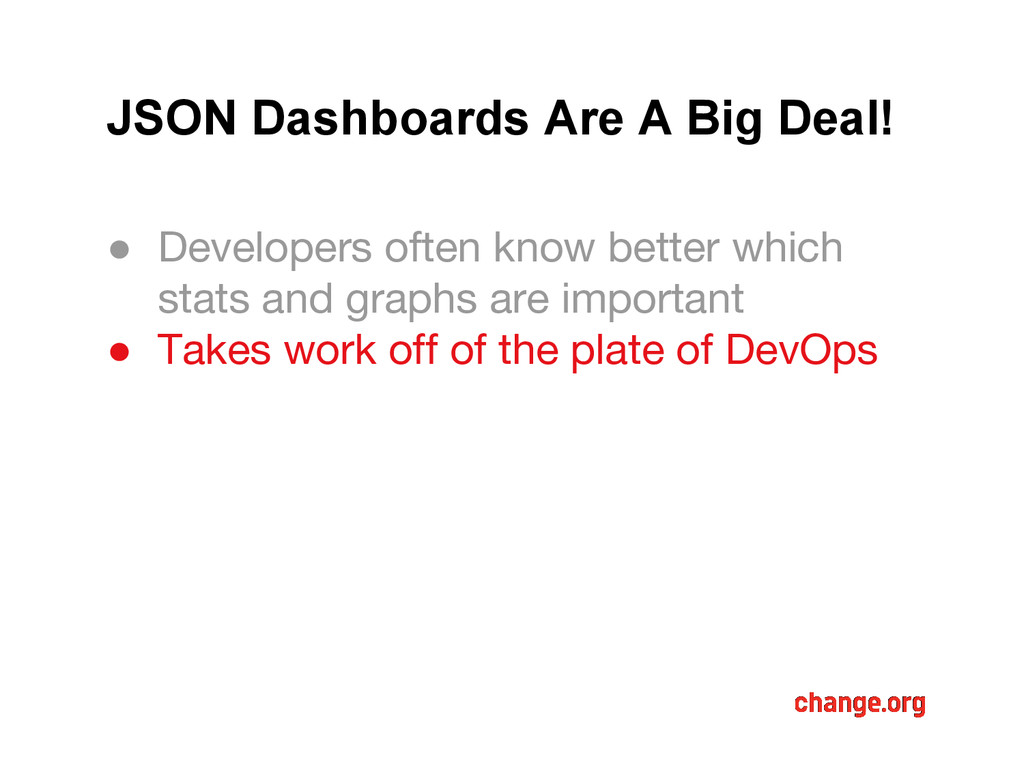
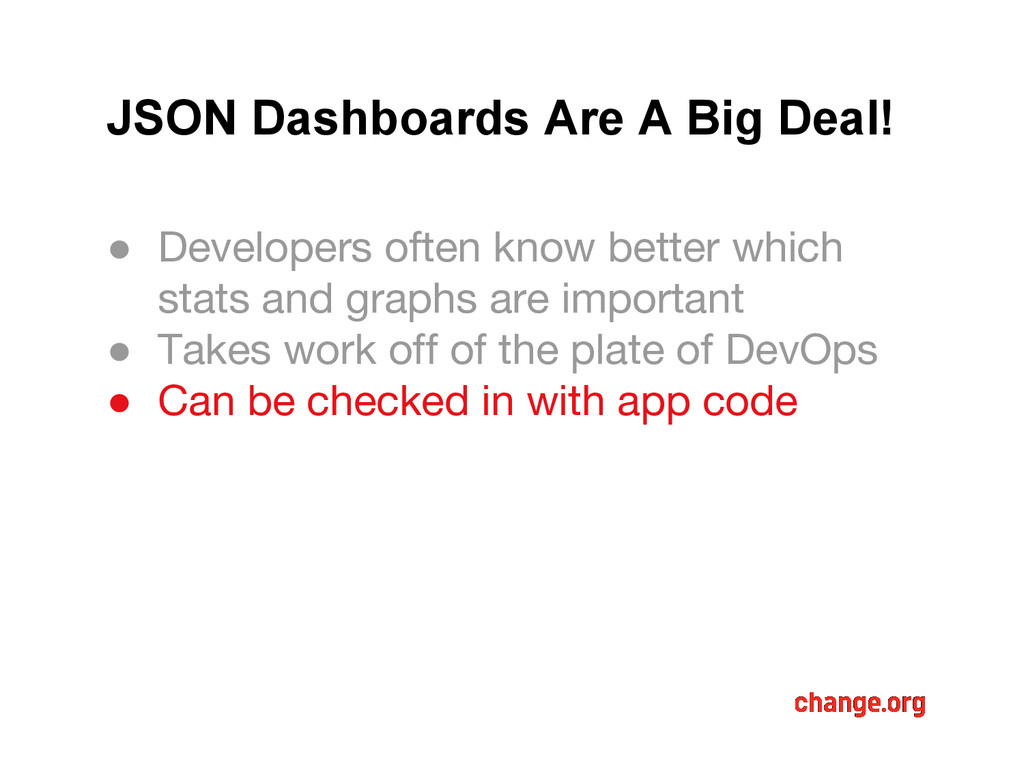
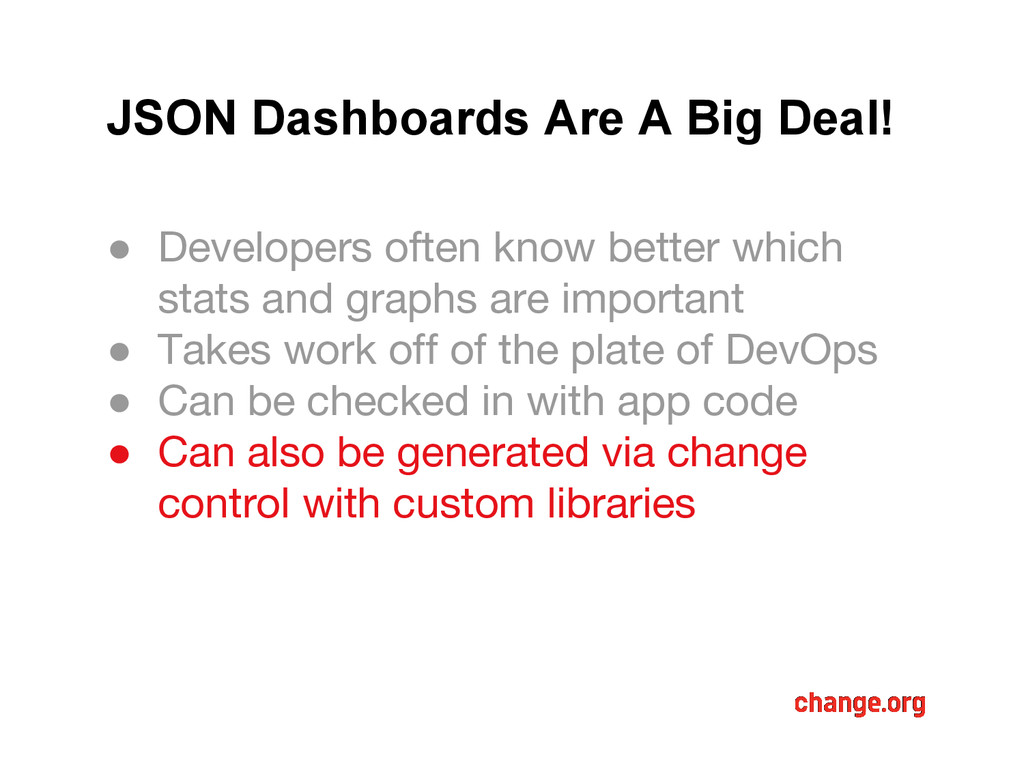
better which stats and graphs are important • Takes work off of the plate of DevOps • Can be checked in with app code • Can also be generated via change control with custom libraries
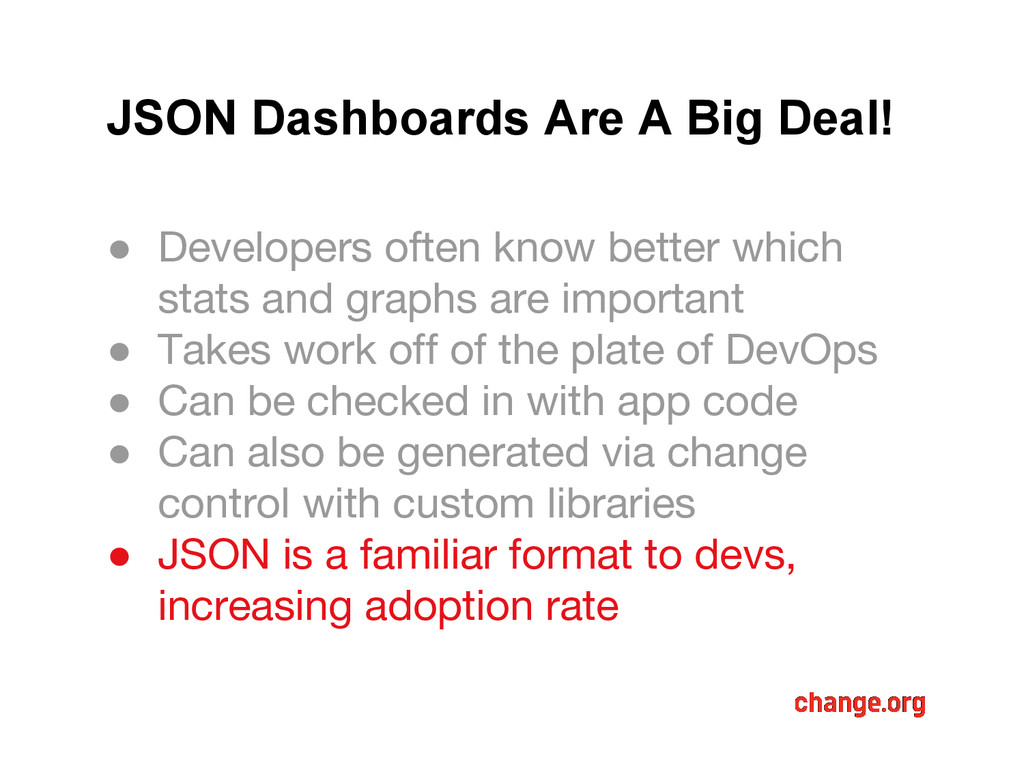
better which stats and graphs are important • Takes work off of the plate of DevOps • Can be checked in with app code • Can also be generated via change control with custom libraries • JSON is a familiar format to devs, increasing adoption rate
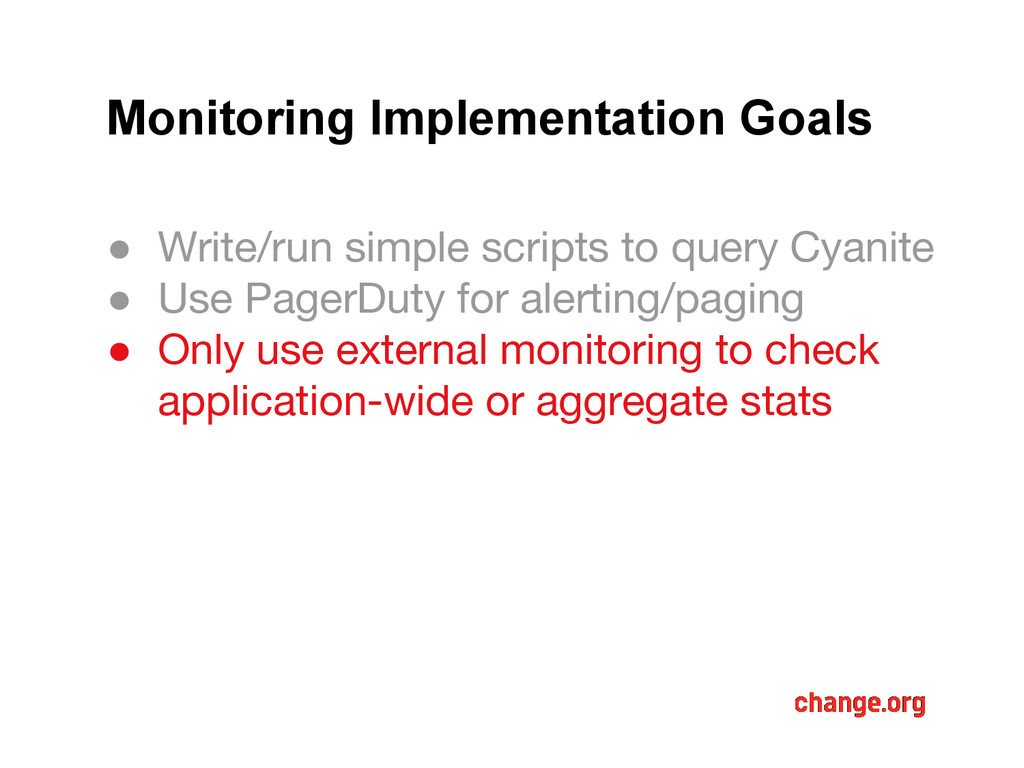
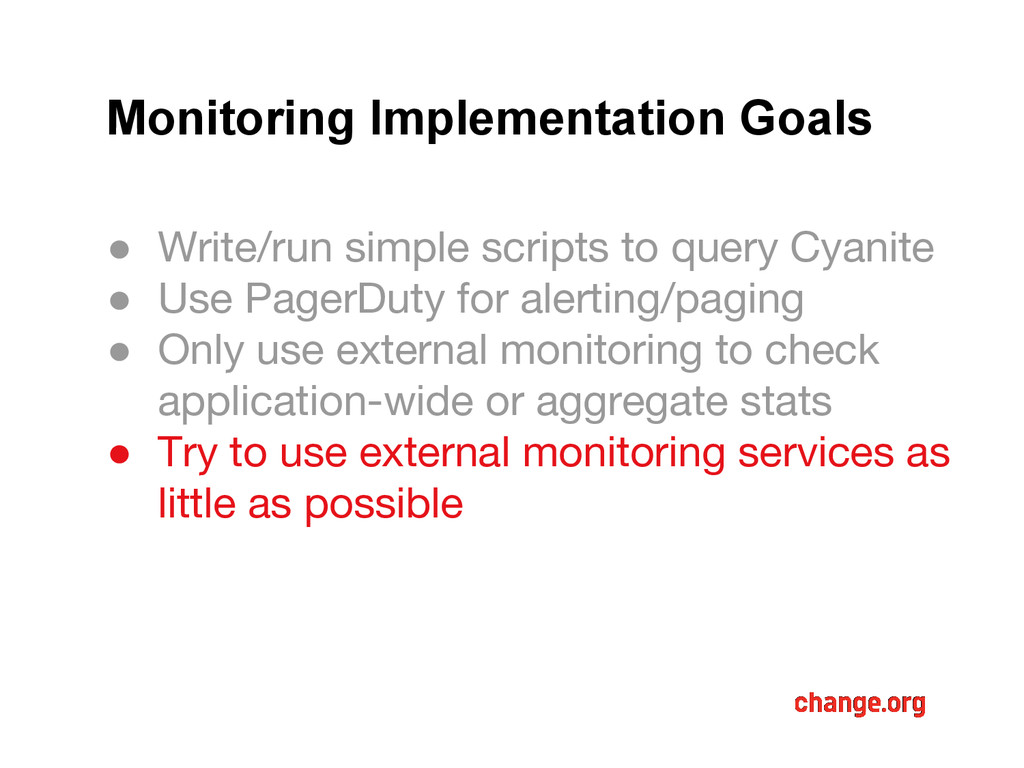
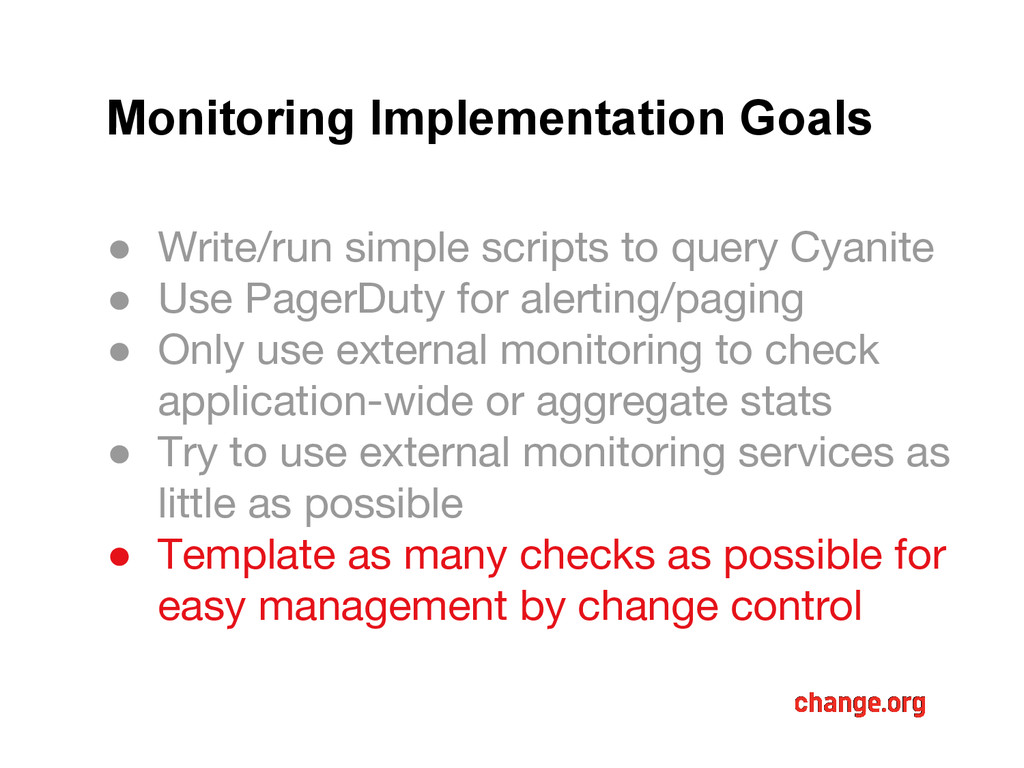
• Use PagerDuty for alerting/paging • Only use external monitoring to check application-wide or aggregate stats • Try to use external monitoring services as little as possible
• Use PagerDuty for alerting/paging • Only use external monitoring to check application-wide or aggregate stats • Try to use external monitoring services as little as possible • Template as many checks as possible for easy management by change control
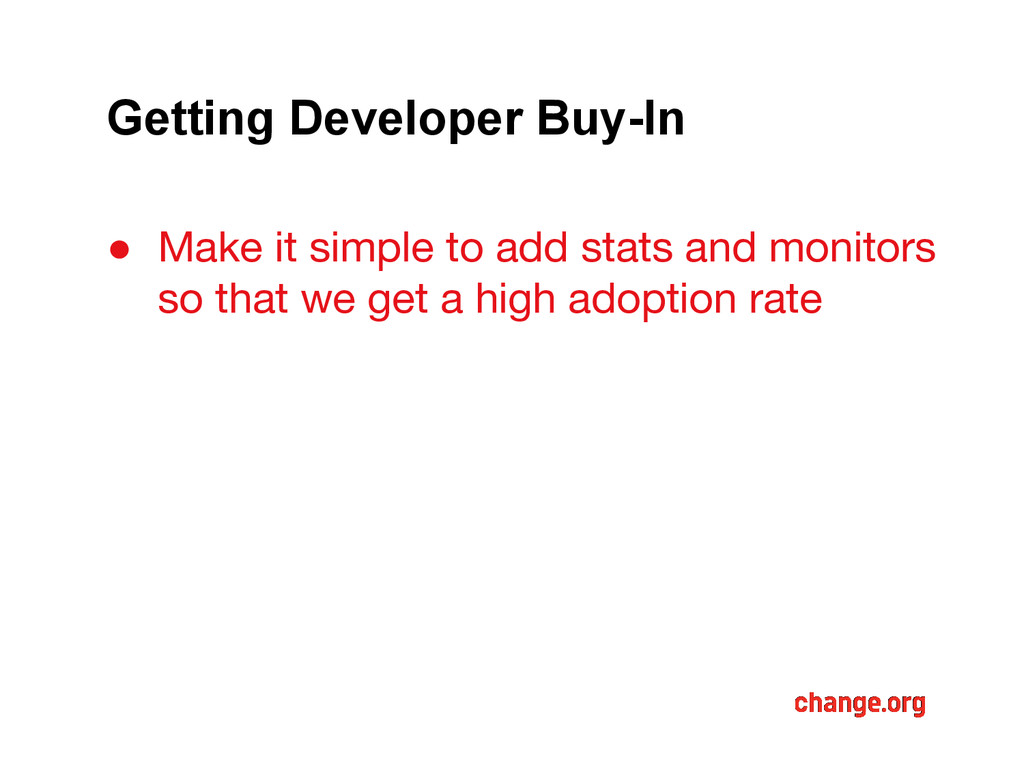
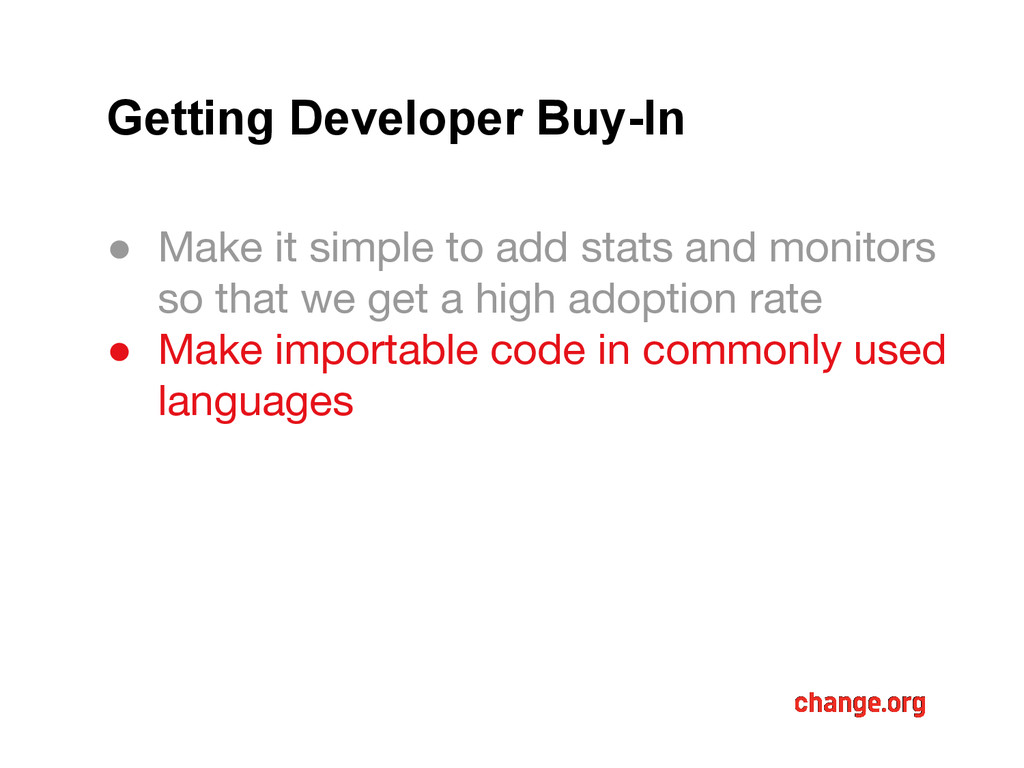
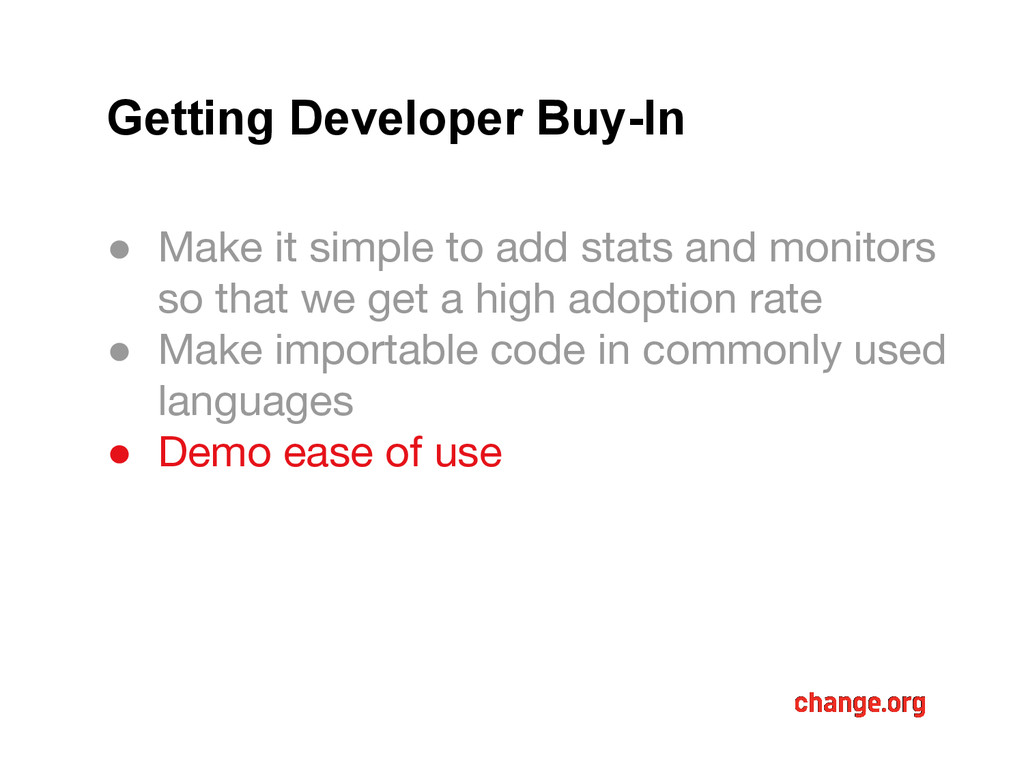
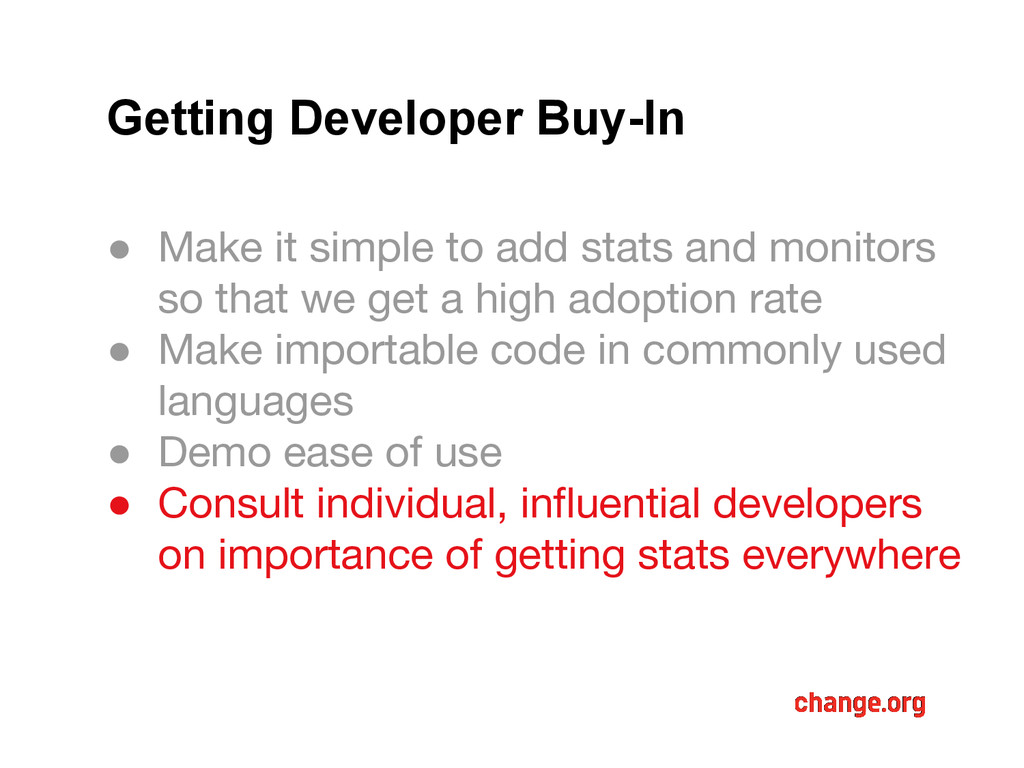
and monitors so that we get a high adoption rate • Make importable code in commonly used languages • Demo ease of use • Consult individual, influential developers on importance of getting stats everywhere
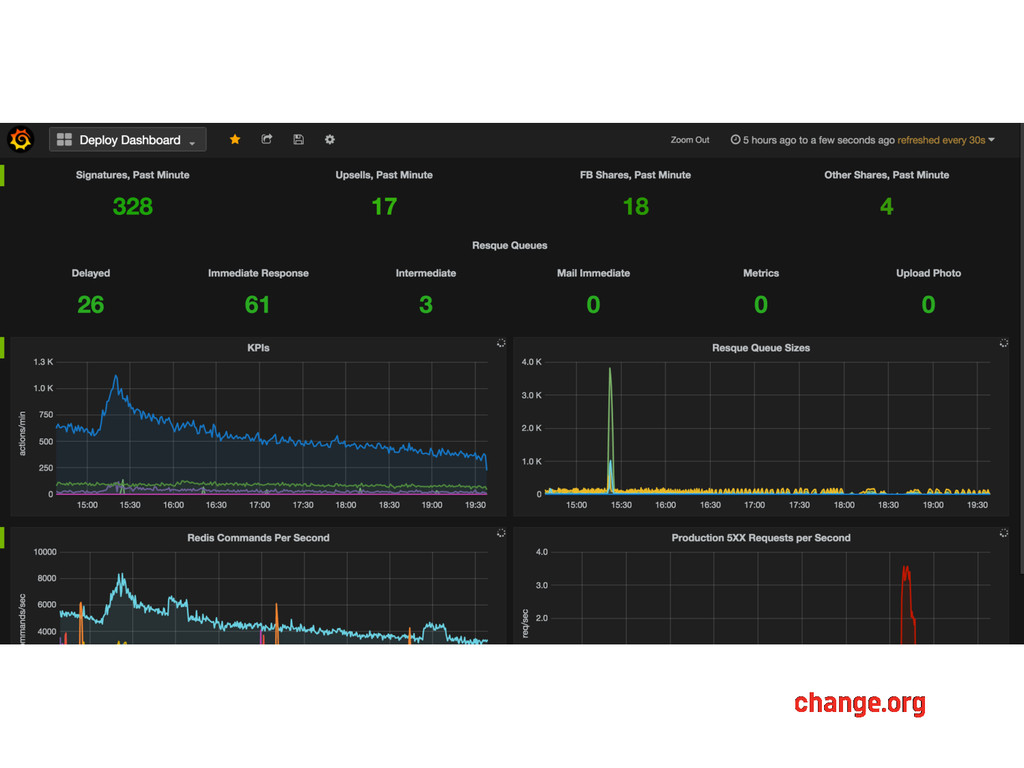
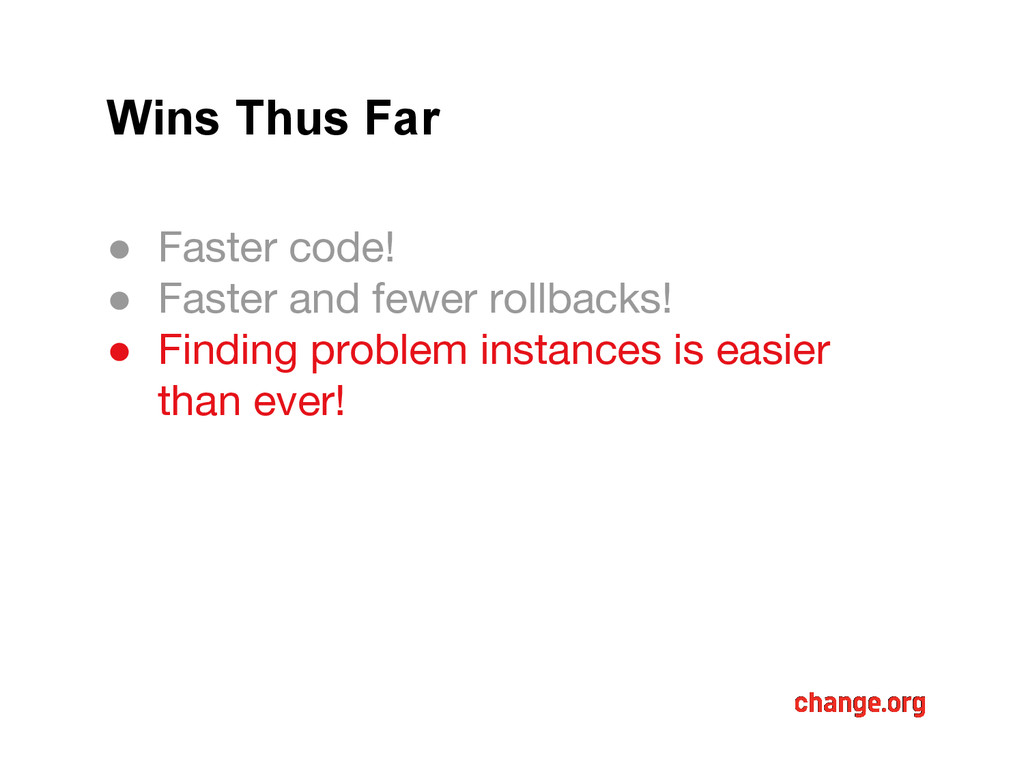
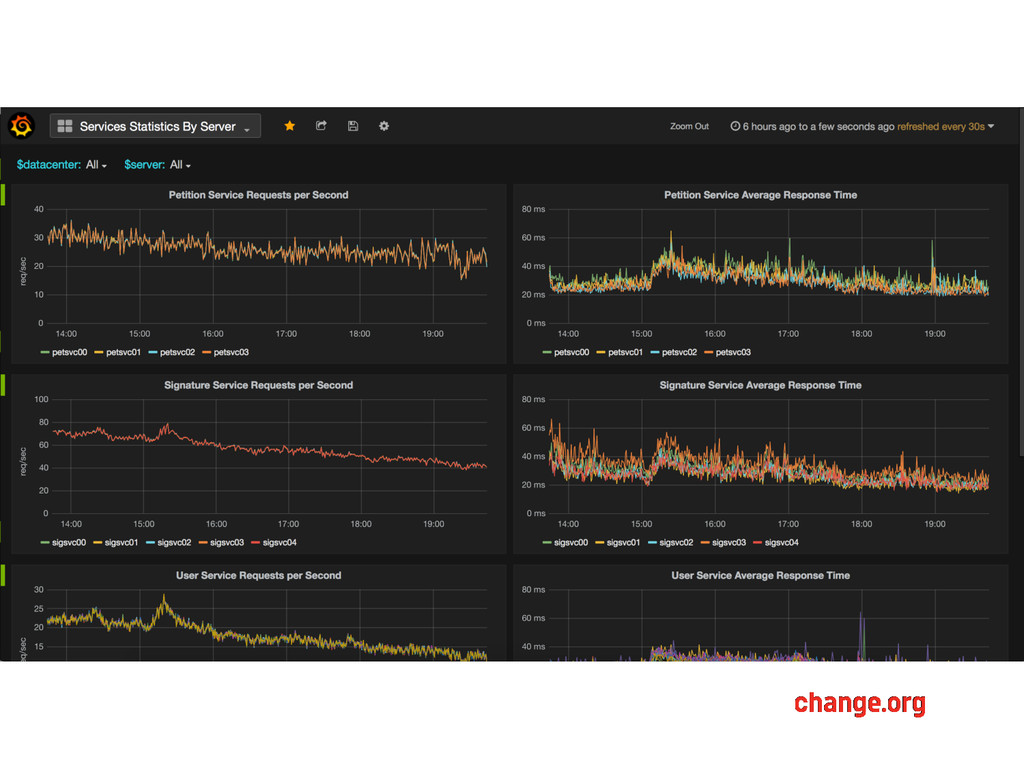
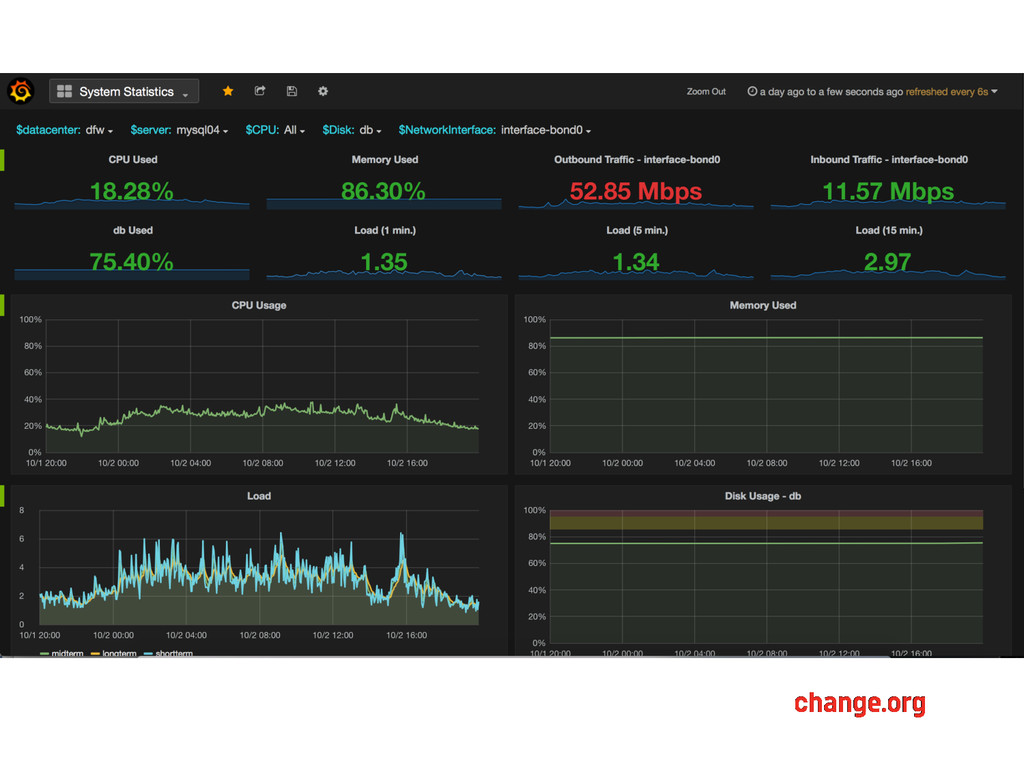
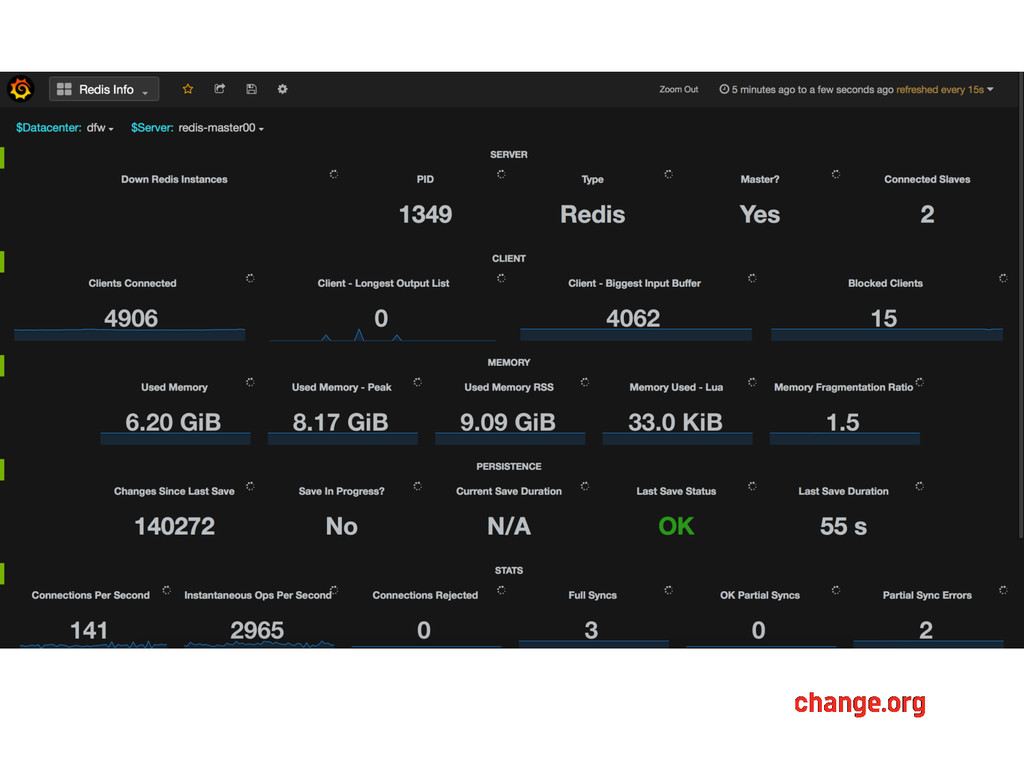
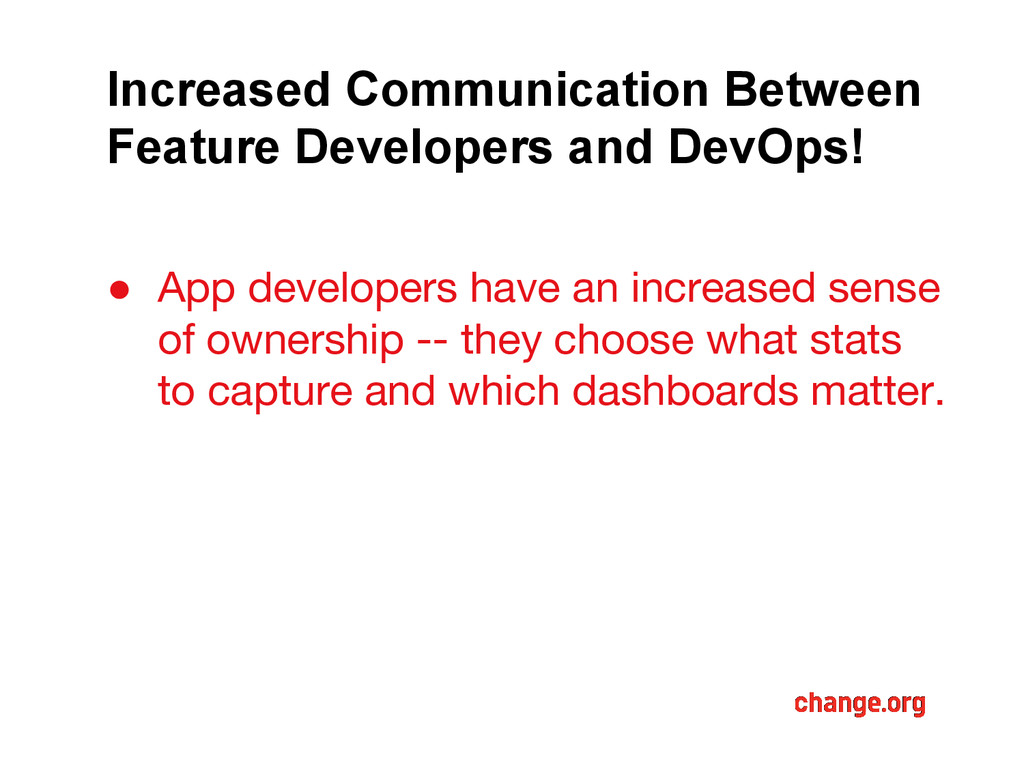
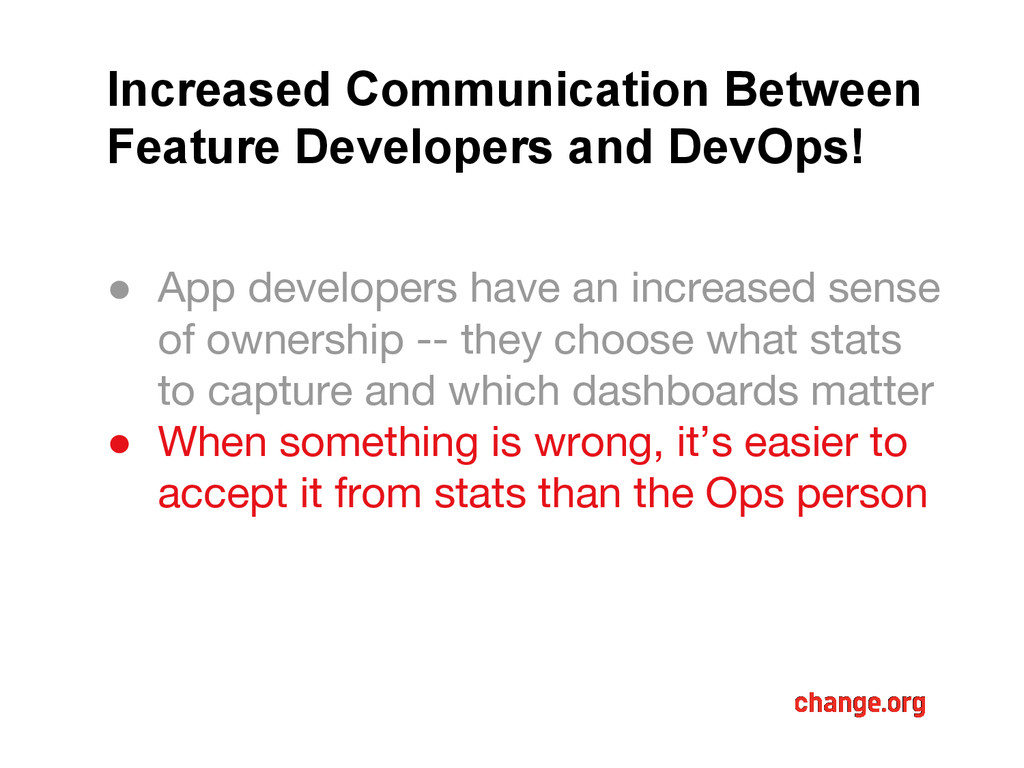
have an increased sense of ownership -- they choose what stats to capture and which dashboards matter • When something is wrong, it’s easier to accept it from stats than the Ops person
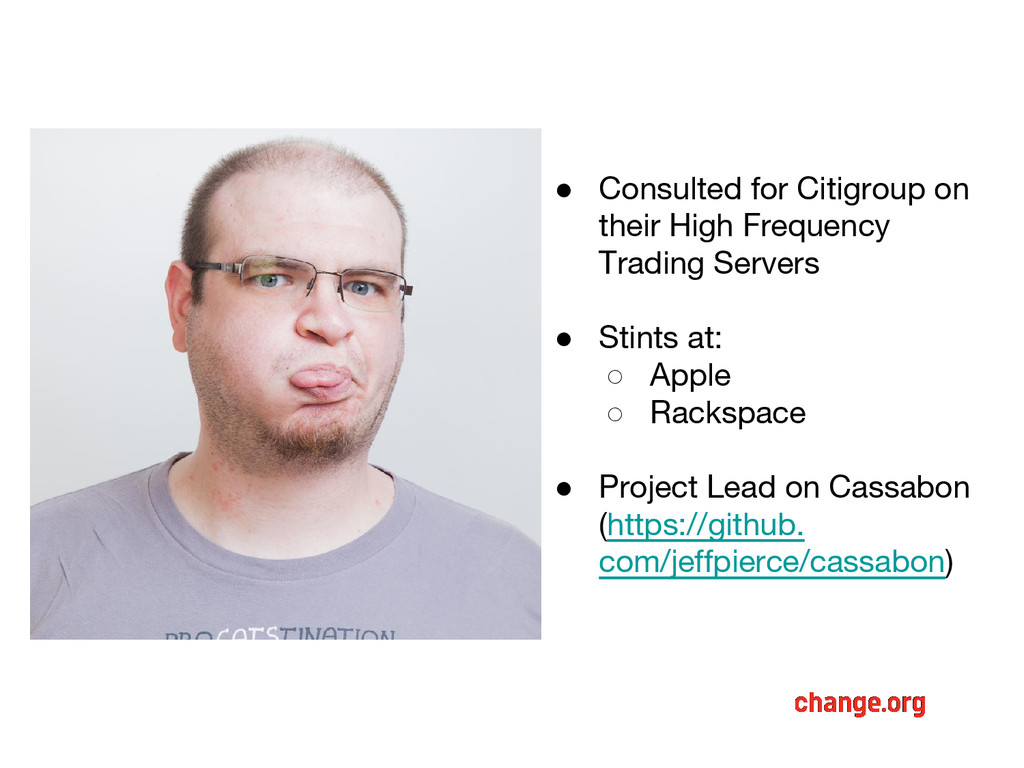
![Jeff Pierce Senior DevOps Engineer @ Change.org [email protected] https://github.com/jeffpierce @Th3Technomancer](https://files.speakerdeck.com/presentations/8e72f9e623534a6baedca60833071000/slide_1.jpg)