$30 off During Our Annual Pro Sale. View Details »

The Ukrainian IT sector report

The Ukrainian IT sector report

TechUkraine

August 14, 2020
Tweet

Other Decks in Technology

Transcript

  1. The Ukrainian IT Sector: An
    Overview of Publicly Available
    Data and Gaps in Market
    Knowledge

    View Slide

  2. Executive Summary:
    Overview of existing reports and data on Ukrainian IT
    Data on the local IT market and industries, which are the biggest consumers of IT in
    Ukraine.
    Vertical specialization and cross-specialization of companies in modern technology, the
    structure of exported IT services.
    Reliable data on the number of IT companies and their structure. Official figures
    overestimate actual numbers as one company often combines several legal entities, while
    experts’ estimates vary substantially. On the other hand, some companies are operating in
    Ukraine without a registered legal entity.
    This report identifies available and, respectively, missing data, which would be necessary for
    evaluating Ukrainian tech ecosystem. This study features all the reports we became aware of
    and other statistical sources available on the Ukrainian IT market, which were meticulously
    systematized and compared, along with the methodology behind them.
    Market participants and stakeholders have already made substantial efforts to present
    Ukraine’s tech ecosystem. There is a large number of reports available on the IT sector:
    general, regional, specialized on specific sub-sector ones, maps of different ecosystem
    components, etc. Overall, more than seventy sources on Ukraine’s tech ecosystem were
    studied by the authors of this report.
    We found useful information available on exports, output, and value added of IT industry,
    investment deals, professionals working in IT companies, salaries, challenges in human
    resources on the IT market. Profound regional information is available for several active local
    IT clusters.
    Still, notwithstanding the large number of reports, in many cases the data on critical elements
    of the ecosystem is lacking or has significant drawbacks, including having questionable
    sources and being outdated. Reciting unreliable data from one report to another misleads
    market participants and stakeholders.
    The objective of this report is to change this status quo, show the real picture with data about
    UA Ecosystem, agree among stakeholders on common methodologies and lay good ground
    for establishing new standards in reporting.
    Based on our research we identified the following areas which lack sufficient and/or reliable
    data:

    View Slide

  3. R&D: the market defines R&D companies as global in-house centers of large international
    companies, however, it is not always clear whether these centers are actually involved in
    R&D. There is a need to agree on the definition of R&D and to clearly distinguish R&D from
    non-R&D activities.
    Financial figures: data on profit and profit structure, comparable and detailed data on
    taxes paid by IT, reliable data on investments structure vary in different sources.
    Detailed analysis of infrastructure in a meaning of supportive businesses required for IT
    companies to operate well, is missing.
    Human Capital and labor market: data on school to work transition for IT specialists,
    number of IT specialists who work in non-IT companies, migration of IT specialists, amount
    of switchers, remote work for/from other countries is incomplete.
    Regional data: while there is a good overview of Lviv, Kharkiv, and, Dnipro, and Kyiv being
    well covered in general reports, data on other regions is scarce.
    There is a need to develop the ecosystem mapping featuring key stakeholders on each
    segment based on the findings of this report.
    Filling out the gaps where the report has identified missing data is crucial for
    understanding of the ecosystem needs. Thorough further research is required to cover
    the existing gaps in the data needed for informed policy making.
    This report is made possible with the support of the American People through the United
    States Agency for International Development (USAID) under the Competitive Economy
    Program. The authors’ views expressed in this report do not necessarily reflect the views of the
    United States Agency for International Development or the United States Government.
    Executive Summary:
    Overview of existing reports and data on Ukrainian IT

    View Slide

  4. Table of contents
    Tech ecosystem and business climate
    1.1. Ecosystem structure and market size
    Ecosystem map
    Stakeholders, elements of the ecosystem and interconnection chain thereof
    Characteristics of each element and added value for ecosystem
    1.1.2 Local Market
    Local market size (actual and potential) and market structure
    Share of IT in GDP
    Ukrainian industries that are the main clients of IT companies,
    actual and potential
    Identify, what is Ukrainian IT: companies, owned by Ukrainians or registered in UA
    only or any other format?
    1.1.3. UA Export
    Size of export, and main export destinations, actual and potential
    Main clients (companies) of Ukraine’s IT
    Main products and services exported in 2019 and dynamics over the last years
    Main countries of exporting destination and dynamics over the last years
    Share of Ukrainian IT on the global market
    1.1.4. Typology of companies
    Number of companies registered in UA
    If possible number (or share) of companies which are not registered in Ukraine and
    main reasons why companies are not registering in UA
    Legal types of companies and percent of each type
    Types of companies by business models and percent of each type
    Types of companies by number of employees and percent of each type
    1.1.5 Scientific potential and innovation
    Number of research institutes and universities
    Number of patents issued
    Size of investments in R&D
    International cooperation in R&D
    1.1.6. International rankings
    Ecosystem rankings
    ICT & digital economy indices
    1.2 Financial and economic indicators of various types of IT companies
    1.2.1. Profits
    Profit structure of each type of companies
    1.2.2. Taxes
    Amount of taxes paid, distribution to local/state budgets
    8
    8
    8
    8
    11
    12
    12
    12
    15
    16
    17
    17
    18
    20
    20
    21
    24
    24
    24
    25
    25
    25
    27
    27
    27
    28
    29
    30
    30
    31
    32
    32
    32
    33
    33

    View Slide

  5. Table of contents
    1.2.3. Salaries
    Structure of salaries in percent
    Salary growth trends in the last and coming years by category/position
    1.2.4. Capital and Investments
    Size of investments in the IT sector
    Types of investments by phase
    Type of investments by sources
    Number of exits and M&A
    Types of investors and investor map
    1.3 Infrastructure
    1.3.1. Types of infrastructure, required for IT companies to operate well
    1.3.2. Broadband internet, 4G and similar indicators in narrow understanding of infrastructure
    4G
    Fixed broadband
    2. Human Capital
    2.1. Human capital in IT: market overview
    2.1.1. Specialists
    Number of specialists that work in IT sphere in IT companies
    Number of specialists that work in IT sphere in non-IT companies
    Types of specialists by maturity level
    Gender type
    Language skills, soft skills
    2.1.2. Professions
    Types of professions in IT sector and percent of various professions in IT
    2.1.3. Demand
    Number of vacancies and their structure
    2.1.4. Challenges
    2.2.1. General numbers
    2.2.2 Education market overview. Stakeholder map of education
    2.3.1 Existing gaps analysis. comparing industry demand with existing supply (quality
    and quantity)
    3. Country niches for USP positioning and go-to-market strategy
    3.1. Specialization
    3.1.1 Vertical: percent of companies doing projects in various verticals
    3.1.2. International trends: percent of companies having cross-specialization on
    international trends (AI, AR/VR, Robotics, etc).
    3.2 Regional distribution
    3.2.1 Share of each region in each element of ecosystem structure
    3.2.2. Smart specialization of regions
    Methodology and uncovered needs for a comprehensive report of the IT Sector in
    Ukraine and key criteria for comparing Ukrainian IT Sector with other countries
    References
    34
    34
    34
    36
    36
    36
    36
    37
    37
    38
    38
    38
    38
    38
    39
    40
    40
    40
    40
    40
    41
    41
    42
    42
    43
    43
    45
    47
    50
    51
    52
    53
    53
    55
    56
    56
    56
    61
    63

    View Slide

  6. List of abbreviations
    B2B - Business-to-Business
    B2C - Business-to-consumer
    BRDO - Better Regulation Delivery Office
    CEO - Chief Executive Officer
    CVC - Corporate Venture Capital
    CTO - Chief Technology Officer
    EBOPS 2010 - Extended Balance of Payments Services Classification
    FMCG- Fast-Moving Consumer Goods
    GDP - Gross Domestic Product
    GIC - Global In House Centers
    HR - Human Resources
    ICT - Information Communications Technology
    IT - Information Technology
    M&A - Mergers and Acquisitions
    NACE - European Classification of Economic Activities
    NBU - National Bank of Ukraine
    NGO - Non-Governmental Organization
    PR - Public Relations
    R&D - Research and Development
    SaaS - Software as a Service
    SME - Small and Medium Enterprises
    SSSU - State Statistics Service of Ukraine
    WTO - World Trade Organization
    UNESCO - United Nations Educational, Scientific and Cultural Organization
    USAID - U.S. Agency for International Development
    UVCA - Ukrainian Venture Capital and Private Equity Association

    View Slide

  7. Tech Ecosystem and
    Business Climate
    1. 2
    Financial and
    economic indicators
    of various types of IT
    companies
    1. 3
    Infrastructure
    1. 1
    Ecosystem structure
    and market size
    1

    View Slide

  8. By Cerulean Industries
    01
    Stakeholders, elements of the ecosystem and interconnection chain thereof
    The purpose of this report is to identify available data as well as gaps in the data for
    Ukrainian tech ecosystem evaluation. There is no standardized approach to what tech
    ecosystem consists of. Therefore we present here conceptual framework which we consider
    appropriate for this purpose. The basis for this model is taken from the OC&C reports on
    Tech entrepreneurship ecosystems (1). Additional Information is taken from the Export
    Strategy of Ukraine for the ICT sector. Other materials were also studied. Table below gives
    a detailed structure of the ecosystem, while the diagram presents software ecosystem
    framework and interaction of ecosystem elements.
    1.1.1
    Ecosystem map
    Ecosystem structure and market size
    1 OC&C uses standardized approach and model to analyse tech ecosystems. There are several reports available, one of the
    examples to illustrate approach is OC&C, 2018. Tech Entrepreneurship Ecosystem in Turkey.
    Input/Prerequisites Business Markets Output/Results
    Grants/subsidies/ donors
    Individual investors
    Venture capital
    Public funding
    Corporate investment
    (CVCs and M&A)
    Securities market
    Debt financing
    Educational foundations
    Scientific institutes and
    R&D centers
    Think tanks
    Skills development
    Attracting local talent to
    tech entrepreneurship
    Acquiring international
    talent
    FINANCIAL CAPITAL:
    - Crowdfunding
    - Angel investors
    - Personal networks
    SKILLED TALENT AND
    INNOVATION
    - Schools, courses, programs
    - On the job training
    Technological Service
    Providers
    Product companies
    Technological Startups
    Service and System
    Integrators
    Vendors and resellers:
    By types of services:
    - Outsourcing
    - Outstaffing
    - Global InHouse Centers
    (GIC)
    (software, including SaaS
    and other “-as-a-service”
    product models, and
    hardware)
    - Hardware Vendors,
    - Software Vendors
    - Internet Providers
    - Data-Centers
    USA
    UK
    Canada
    Germany
    Israel
    Sweden
    Switzerland
    Norway
    Netherlands
    Ireland
    others
    B2B
    Corporations
    SMEs
    Startups
    Public clients
    B2C
    Various audiences
    By geographic location:
    Local Market
    International Market:
    By types of clients:
    Size of tech e-ship:
    Workforce employed in
    tech entrepreneurship
    Growth rate
    Value creation
    Global reach
    ECONOMIC
    CONTRIBUTION
    - Revenue
    - Number of startups
    - Share in GDP
    - Revenue, Number
    - Market cap, Unicorns
    - Share of int’l revenues
    - Number of int’l operations
    08

    View Slide

  9. By Cerulean Industries
    01
    Input/Prerequisites Business Markets Output/Results
    1.1.1 Ecosystem map
    Ecosystem structure and market size
    Communities,
    Associations, Clusters,
    other IT NGOs, public
    organizations
    Mentors and coaches
    Accelerators / incubators
    Diaspora networks
    International linkages
    Events (inspirational,
    sharing knowledge,
    teaming up, hackathons,
    investors networking)
    University-industry
    partnership
    Tech transfer offices
    Physical clusters
    NETWORKS
    - Co-working spaces
    - Technoparks
    Telecom and data-
    centers
    Banks & insurance
    Legal
    Accounting
    Recruiting
    Creative businesses
    (marketing and PR,
    media, digital agencies)
    Event companies
    Educational
    Consulting offices etc
    Kindergartens,
    Cafes, restaurants, bars,
    clubs
    Shops
    Travel companies etc
    Adjoining Industry
    Companies to IT and Tech:
    Providing B2B services:
    Providing B2C services:
    End clients
    Intermediaries
    By types of cooperation:
    Innovation created by
    tech entrepreneurs
    INNOVATION CREATION
    - Number of innovative
    products, processes,
    - business models
    introduced in the country in
    a given year
    Tech-influencers, role-
    models, evangelists, tech
    bloggers,
    Media
    Society’s attitude to
    entrepreneurship
    Entrepreneurial
    aspirations and appetite
    Promotion of role models
    / success stories
    Media coverage of
    entrepreneurship
    CULTURE
    ---------------
    Tech Giants
    Scaleups
    IT SMEs
    Freelancers
    By size:
    Agriculture
    Manufacturing
    Construction
    Metallurgy
    Logistics
    Energy
    Banking & Finance
    FMCG
    Air and Space
    Entertainment & Social
    Education
    Health
    Government
    By industry segment:
    Set of regulations,
    improving:
    Digital policies
    Government R&D policies
    REGULATIONS
    - Ease of doing business
    - Compliance
    - Trading across borders
    09

    View Slide

  10. By Cerulean Industries
    01
    Input/prerequisites Business Markets Output/results
    10
    1.1.1 Ecosystem map
    Ecosystem structure and market size
    Digital literacy /
    readiness
    Domestic market size
    Public procurement
    Local market efficiency
    LOCAL MARKET
    POTENTIAL
    - individual use
    - cloud migration
    - digitization of gov’t
    services
    - B2B
    - B2C
    Foreign Governments,
    Embassies, Chambers of
    Commerce, Associations,
    Communities
    Foreign Business
    Foreign Events
    Foreign Media and
    influencers
    Ukrainian Diaspora
    INTERNATIONAL MARKET
    POTENTIAL
    Accessibility and
    affordability of Internet
    (mobile / fixed)
    Cloud & data center
    experience
    Electricity
    Hardware
    Software
    Airports, roads
    ICT INFRASTRUCTURE

    View Slide

  11. By Cerulean Industries
    01
    The core of the IT sector and ecosystem is the
    business part: companies that create goods
    (services and products) in IT and Tech
    sectors and companies that sell to IT and
    Tech companies. Then, these companies
    operate on specific markets to generate
    profits, so markets are the next important
    aspect of the ecosystem.
    For the effective work of these two elements:
    value creation and money flows, there need
    to exist certain prerequisites that fill the
    needs and gaps of the business, empower it
    and allow it to bring results, described in the
    output section: economic contribution and
    innovation creation.
    The prerequisites are: Capital, Talent,
    Networks, Culture, Regulations,
    Infrastructure and Markets Potential.
    Markets potential creates an opportunity for
    business creation.
    Talents generate innovation and are executing
    on the ideas generated, that aim at fulfilling
    market needs. Infrastructure gives the
    instruments and basis for their work.
    Capital gives resources to work before the
    market pays back. Networks empower talent to
    share tangible and intangible resources.
    Culture and regulations establish public and
    private rules of such interactions.
    Missing any element will affect the
    effectiveness of the system overall and the end
    results - economic contribution and innovation
    creation. The task of Ecosystem stakeholders -
    grow the elements of the ecosystem evenly,
    make sure all parts are represented and grow
    simultaneously to maximize the results.
    Further parts of the report represent various
    data to evaluate the ecosystem and to be used
    for strategic initiatives on ecosystem
    development.
    Source: F. Kon, D. Cukier, C. Melo, O. Hazzan, H. Yuklea, 2015. Conceptual Framework for Software
    Startup Ecosystems: the case of Israel. Technical Report RT-MAC-2015-01
    Characteristics of each element and added value for ecosystem
    While table above named components of tech ecosystem in detail, scheme below
    describes interconnection between tech startup ecosystem elements
    11
    1.1.1 Ecosystem map
    Ecosystem structure and market size

    View Slide

  12. By Cerulean Industries
    01
    Share of IT in GDP - which exact economic activity is covered by this indicator in
    IT part
    Most of the reports show the share of IT in Gross Domestic Product (GDP) at 4% in 2018
    (National Investment Council of Ukraine 2018, UNIT.City and StrategIst 2017, UkraineInvest,
    2020).
    This corresponds to Information and communication category in GDP data reported by the
    State Statistics Service of Ukraine. PwC reports different figures, but their adjustments and
    methodology are not presented in the report (EBA and PwC 2016).
    Data on the local market size is scarce.
    Development of the local market, as well as reliable data regarding it, are essential as local
    market cross-fertilizes the tech ecosystem. Currently, the IT sector is mostly export-oriented
    as the local market does not have a substantial demand for IT services.
    The source that presented local market size and structure was the report by the Aequo,
    International Data Corporation (IDC), Baker Tilly and SI BIS (2017) Information technology
    industry in Ukraine. Total consumption of IT services (intermediate and final) can also be
    estimated using State Statistics Service of Ukraine IO tables. It constituted in 2017 $1.8bn
    including intermediate consumption in the IT sector.
    1.1.2 Local Market
    Ecosystem structure and market size
    Local market size (actual and potential) and market structure
    12
    Source: : AEQUO, IDC, Baker Tilly, SiBiS, 2017. Information technology industry in Ukraine as cited in the National Investment Council of Ukraine,
    2018. IT industry of Ukraine: Creating value on the global scale, page 7

    View Slide

  13. By Cerulean Industries
    01
    J 58 Publishing activities
    J 59 Production of film and video films, television programs,
    sound recordings
    J 60 Radio editing and television activities
    J 61 Telecommunications (telecommunication)
    J 62 Computer programming, consulting and presentation of
    their work
    J 63 Presentation of information services
    58.2 Software publishing,
    62 Computer programming, consultancy and related activities,
    63.1 Data processing, hosting and related activities; web
    portals.
    63.9 Other information services are also often used in the IT
    sector.
    26.1 Manufacture of electronic components and boards
    26.11 Manufacture of electronic components
    26.12 Manufacture of loaded electronic boards
    26.2 Manufacture of computers and peripheral equipment
    26.3 Manufacture of communication equipment
    26.4 Manufacture of consumer electronics
    26.5 Manufacture of instruments and appliances for measuring,
    testing and navigation; watches and clocks
    26.51 Manufacture of instruments and appliances for
    measuring, testing and navigation 2651
    26.52 Manufacture of watches and clocks
    26.6 Manufacture of irradiation, electromedical and
    electrotherapeutic equipment
    26.7 Manufacture of optical instruments and photographic
    equipment
    26.8 Manufacture of magnetic and optical media
    More detailed information can be found in input output
    tables produced by State Statistics Service of
    Ukraine (SSSU), but they are available with a lag (latest
    available 2017). It contains balanced data on output, export,
    import and value added.
    1.1.2 Local Market
    Ecosystem structure and market size
    Information and
    communication category
    contains both IT and non-
    –IT activities:
    At the same time, IT
    services are presented in
    the following categories:
    Hardware production is
    contained in 26
    Manufacture of computer,
    electronic and optical
    products:
    13
    NACE codes (2)
    2 Industry standard classification system used in the European Union

    View Slide

  14. By Cerulean Industries
    01
    Code
    Publishing activities; production of film and
    video films, television programs, sound
    recordings; radio and television
    broadcasting activities
    14
    Unbalanced but even more disaggregated data is available in the Structural survey of the enterprises.
    It is more recent (latest available is 2018). On the other hand, this data goes through several stages of
    adjustment to construct input-output tables, including adjustment for consumption level, i.e. partly
    includes shadow economy.
    Value added for IT sectors (58.2 Software publishing,62 Computer programming, consultancy
    and related activities, 63.1 Data processing, hosting and related activities; web portals)
    constituted 2.6% of total value added
    J58-J60
    J61
    J62-J63
    C26
    Title
    Telecommunications (telecommunication)
    Computer programming, consultancy and
    information services
    Manufacture of computers, electronic and
    optical products
    Value
    added
    UAH mln
    Import
    UAH mln
    Output
    UAH mln
    Share in
    GDP, %
    Export
    UAH mln
    14 982
    29 994 877 -4 302 10 149 0.3%
    58 778 8 297 -11 201 32 948 1.1%
    136 887 73 269 -16 869 67 199 2.3%
    9 104 -85 882 4 403 0.1%
    Source: State Statistics Service of Ukraine, input-output tables, 2017
    Source: AEQUO, IDC, Baker Tilly, SiBiS (2017) gives the following statistics on IT consumption structure in Ukraine in 2016
    In the tables mentioned above the following information is available.
    1.1.2 Local Market
    Ecosystem structure and market size

    View Slide

  15. By Cerulean Industries
    01
    15
    Ukrainian industries that are the main clients of IT companies, actual and
    potential
    Data on the Ukrainian traditional industries that are the main clients of IT companies scarce
    in the literature. Two available sources are hard to compare as they have different
    methodology and purpose. However, very different results suggest that more in-depth
    analysis is required. Analysis and forecasts on Ukrainian sectors which can be potential
    clients of IT companies are unavailable.
    AEQUO, IDC, Baker Tilly, SiBiS (2017) gives the following statistics on IT consumption
    structure in Ukraine in 2016
    Source: AEQUO, IDC, Baker Tilly, SiBiS (2017) gives the following statistics on IT consumption structure in Ukraine in 2016
    1.1.2 Local Market
    Ecosystem structure and market size

    View Slide

  16. By Cerulean Industries
    01
    Intermediate consumption of IT services in Ukraine is available in input-output tables of State Statistics
    Service of Ukraine. Over 70% of IT services are consumed by IT sector itself. 8.5% is consumed by trade.
    Other intermediate consumers include advertising, scientific and technical activities, activities in the
    fields of law and accounting etc. Intermediate consumption of Computer programming, consultancy
    and information services (NACE codes 62-63).
    Identify, what is Ukrainian IT: companies, owned by Ukrainians or registered in UA
    only or any other format?
    Data is unavailable
    Some of the reports state that they focus on companies registered in Ukraine (SaaS Nation,
    UNIT.City, Center42 Innovation Agency 2019), though most of the reports do not mention
    which companies they cover.
    16
    Intermediate consumption of Computer programming, consultancy and information
    services (NACE codes 62-63)
    1.1.2 Local Market
    Ecosystem structure and market size

    View Slide

  17. By Cerulean Industries
    01
    Ukrainian IT is a highly export oriented
    industry. The limited size of the internal
    market, lack of financial resources, digital
    literacy and management maturity of local
    companies stimulates extensive export of IT
    from Ukraine. Ukraine imports a comparably
    limited amount of IT services while the key
    share of IT import remains hardware. Over the
    past 10 years, IT exports increased
    significantly, growing on average by 20.7%
    annually (Export strategy IT sector 2019-
    2023).
    Compared to 2013 Export of ICT services
    increased almost twice (based on NBU data).
    Data on exports vary based on the source.
    The sources include State Statistics Service
    of Ukraine, National Bank of Ukraine,
    international organizations (WorldBank,
    WTO).
    According to State Statistics Service of
    Ukraine, export of ICT services amounted to
    USD 2.1 bn in 2018, including USD 1.6 bn of
    computer services.
    National bank of Ukraine (NBU) uses banks’
    reporting on operations with non-residents
    (NBU resolution 129 as of 01.03.2016) for
    more precise figures.
    NBU figures for ICT exports amounted to USD
    3.5 bn in 2018 and USD 4.3 bn in 2019. World
    Trade Organization (WTO) database
    corresponds to NBU figures and also gives
    statistics on services trade for other countries.
    PwC estimates Ukrainian IT export (USD 3.6
    billion in 2017) based on cost models and data
    provided by market participants (IT Ukraine
    and BRDO 2018).
    IT market stakeholders also publish the figures
    on exports. For instance, figure of USD 4.5B is
    widespread in reports (National Investment
    Council of Ukraine, 2018; Ni-X, 2019; Unit.City,
    Western NIS Enterprise Fund 2019) but it is a
    forecast for 2018 made in 2017 by PwC.
    Computer services have already become an
    important component of Ukrainian exports.
    Overall Ukrainian merchandise exports
    constituted USD 46 bn in 2019, while exports
    of services amounted to USD 17bn (27% of
    total trade). IT services amounted to USD 4.3
    bn (all based on NBU data). Export of computer
    services was the second-largest services export
    in 2019 after the transport services and
    demonstrated high growth of 30% year on year
    in 2019.
    Source: State Statistics Service of Ukraine
    1.1.3 UA Export
    Ecosystem structure and market size
    Size of export, and main export destinations, actual and potential
    17

    View Slide

  18. By Cerulean Industries
    01
    Telecommunications services
    Computer services consist of hardware- and software-related
    services and data processing services:
    Information services are divided into
    Research and development services: basic and applied research,
    experimental development of new products and processes
    Professional and management consulting services:
    Technical, trade-related and other business services:
    Computer software and
    Other computer services
    News agency services
    Other information services
    Legal, accounting, management consulting and public relations
    services
    Advertising, market research and public opinion polling
    Architectural, engineering, scientific and other technical services
    Waste treatment and de-pollution, agricultural and mining
    services
    Operating leasing services
    Trade-related services
    Other business services n.i.e.
    BRDO (2017) states that the
    World Bank classifies other
    business services as part of ICT
    services trade. We do not
    consider it as a widespread
    practice. According to
    Extended Balance of Payments
    Services Classification (EBOP
    2010) ICT services consist of:
    Other business services consist
    of:
    What should be in ICT services
    exports (3):
    Overall Ukrainian merchandise exports constituted $46 bn in 2019, exports of services
    amounted to $17bn, of which IT services amounted to $4.3 bn (all based on NBU data).
    Export of computer services is the second largest services export in 2019 after the
    transport services and demonstrates high growth - 30% year on year in 2019.
    Main clients (companies) of Ukraine’s IT
    There are two sources that name clients of IT companies, one is AVentures, Aventis Capital,
    Capital Times (2019) and AVentures Capital & Ukraine Digital News (2016). AVentures
    Capital & Ukraine Digital News (2016) presents companies by regions, while AVentures,
    Aventis Capital, Capital Times (2019) gives a smaller overview for Ukraine overall.
    18
    9.1 Telecommunications services
    9.2 Computer services
    9.2.1 Computer services - Computer software
    9.2.2 Computer services - Other computer services
    8.3 Licenses to reproduce and/or distribute computer software
    1.1.3 UA Export
    Ecosystem structure and market size
    3 United Nations Conference on Trade and Development (UNCTAD), 2015. International trade in ICT services and ICT-
    enabled services. Proposed Indicators from the Partnership on Measuring ICT for Development. UNCTAD Technical
    Notes on ICT for Development N˚3

    View Slide

  19. By Cerulean Industries
    01
    Delphi - Motorola, EMC2, Nuance, bwin.com
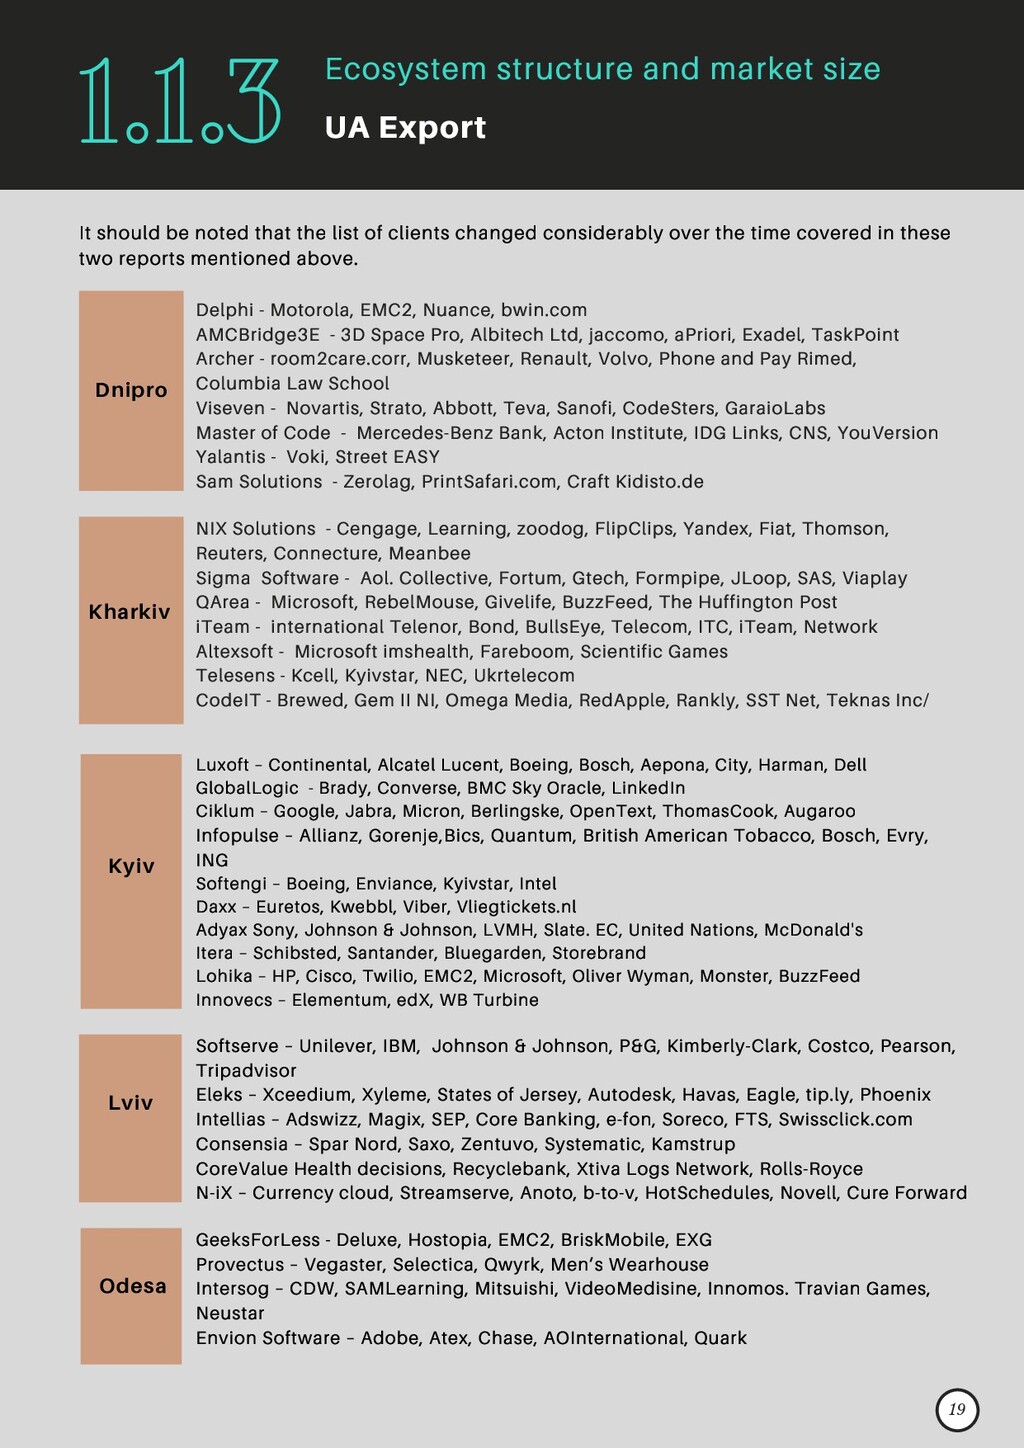
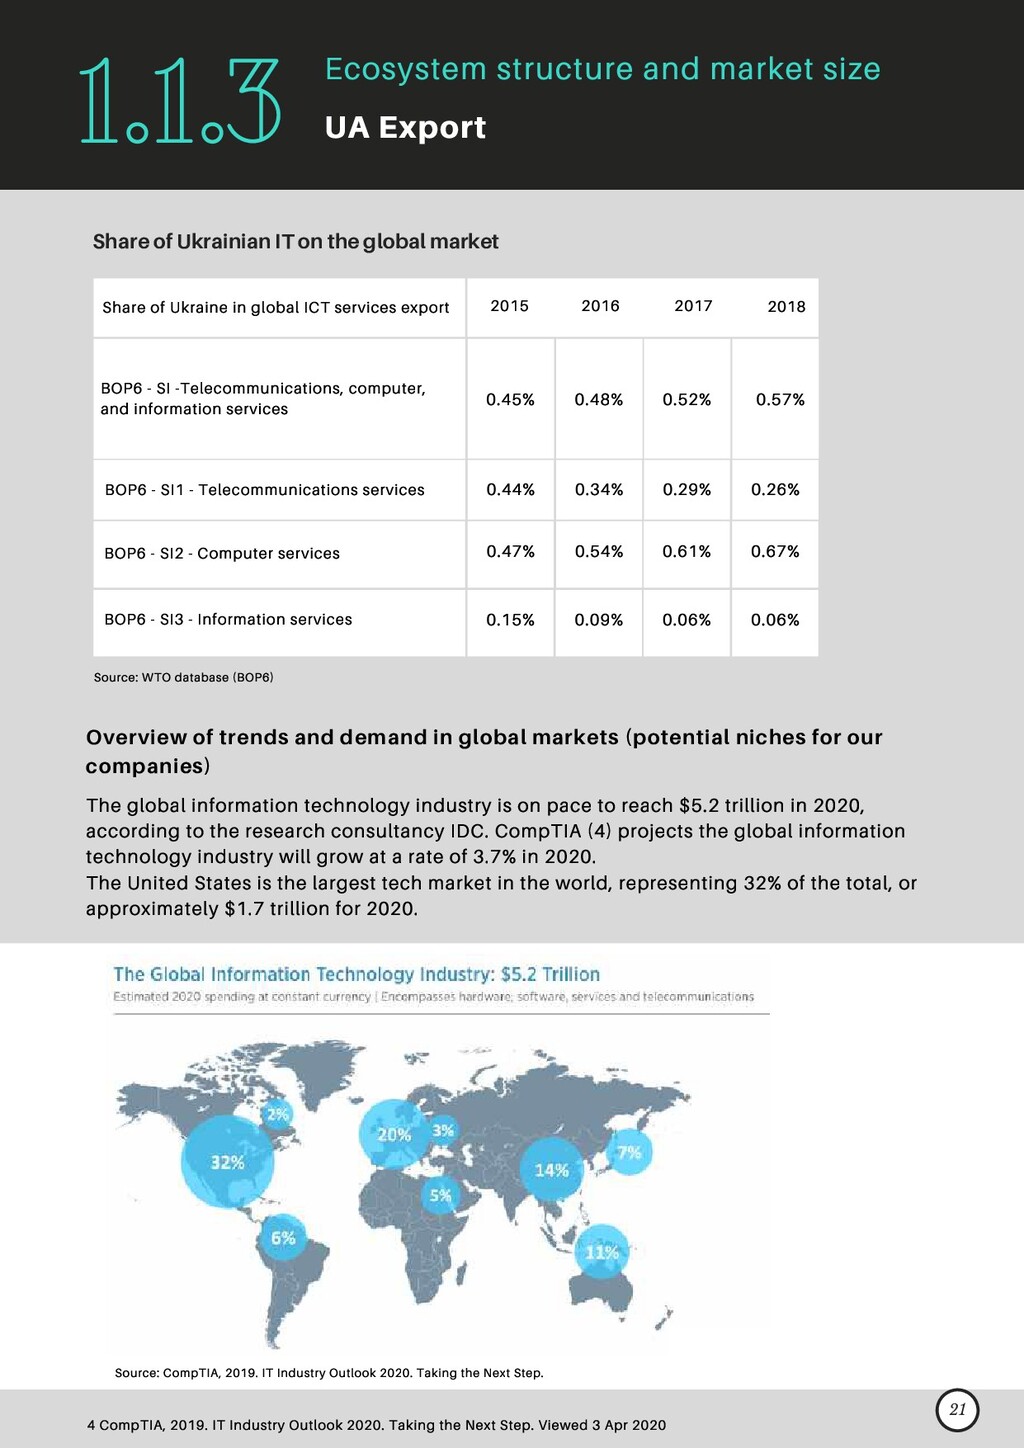
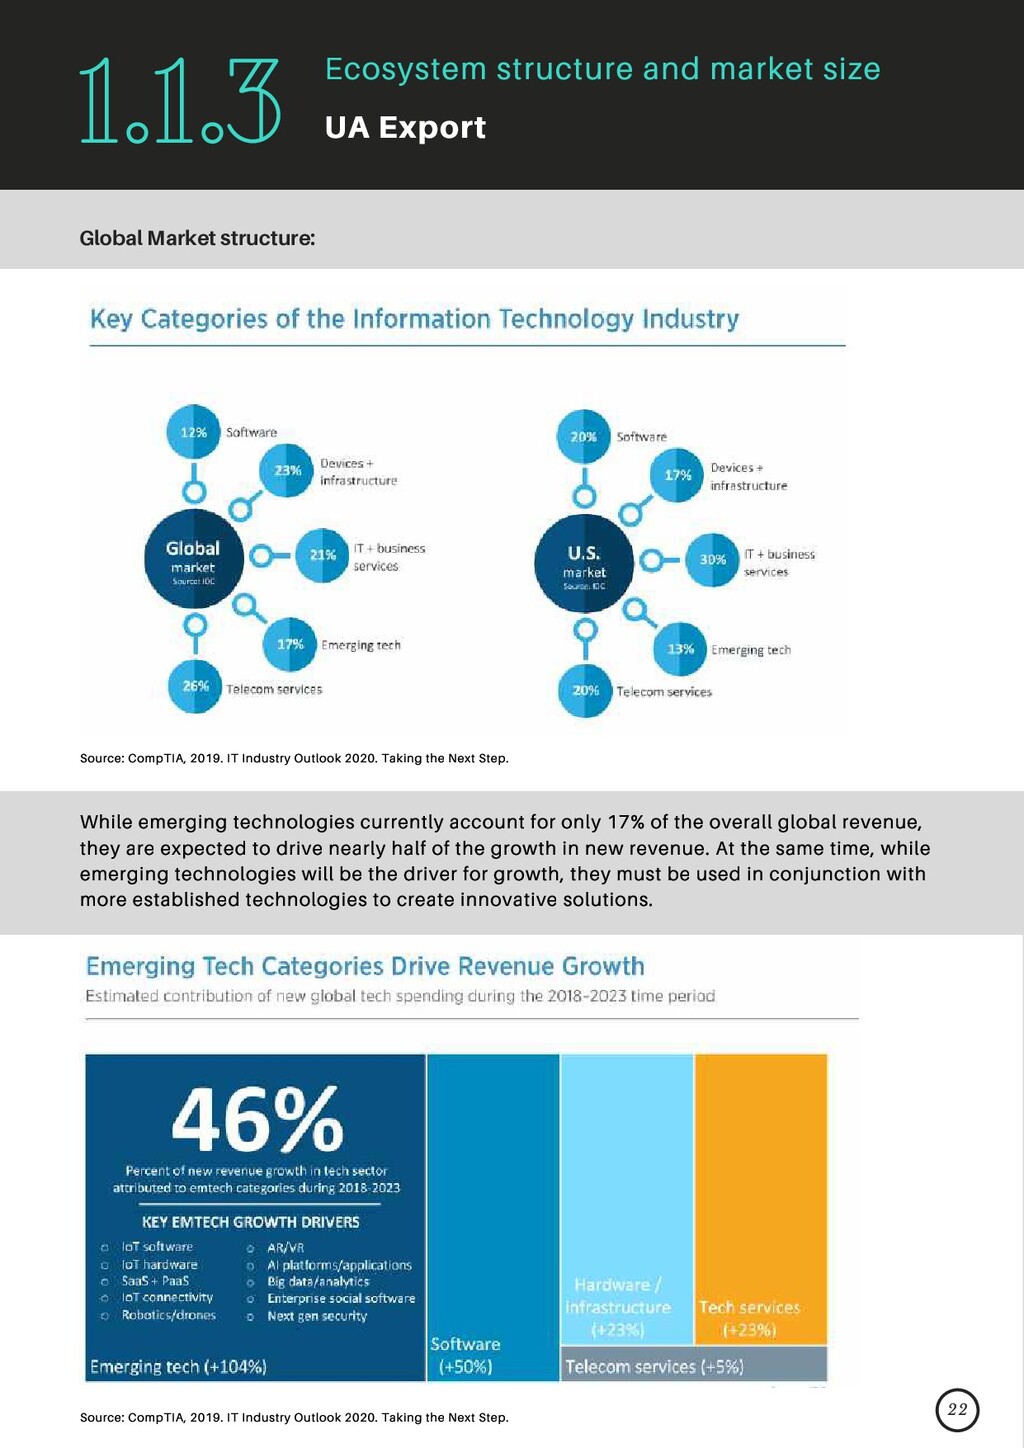
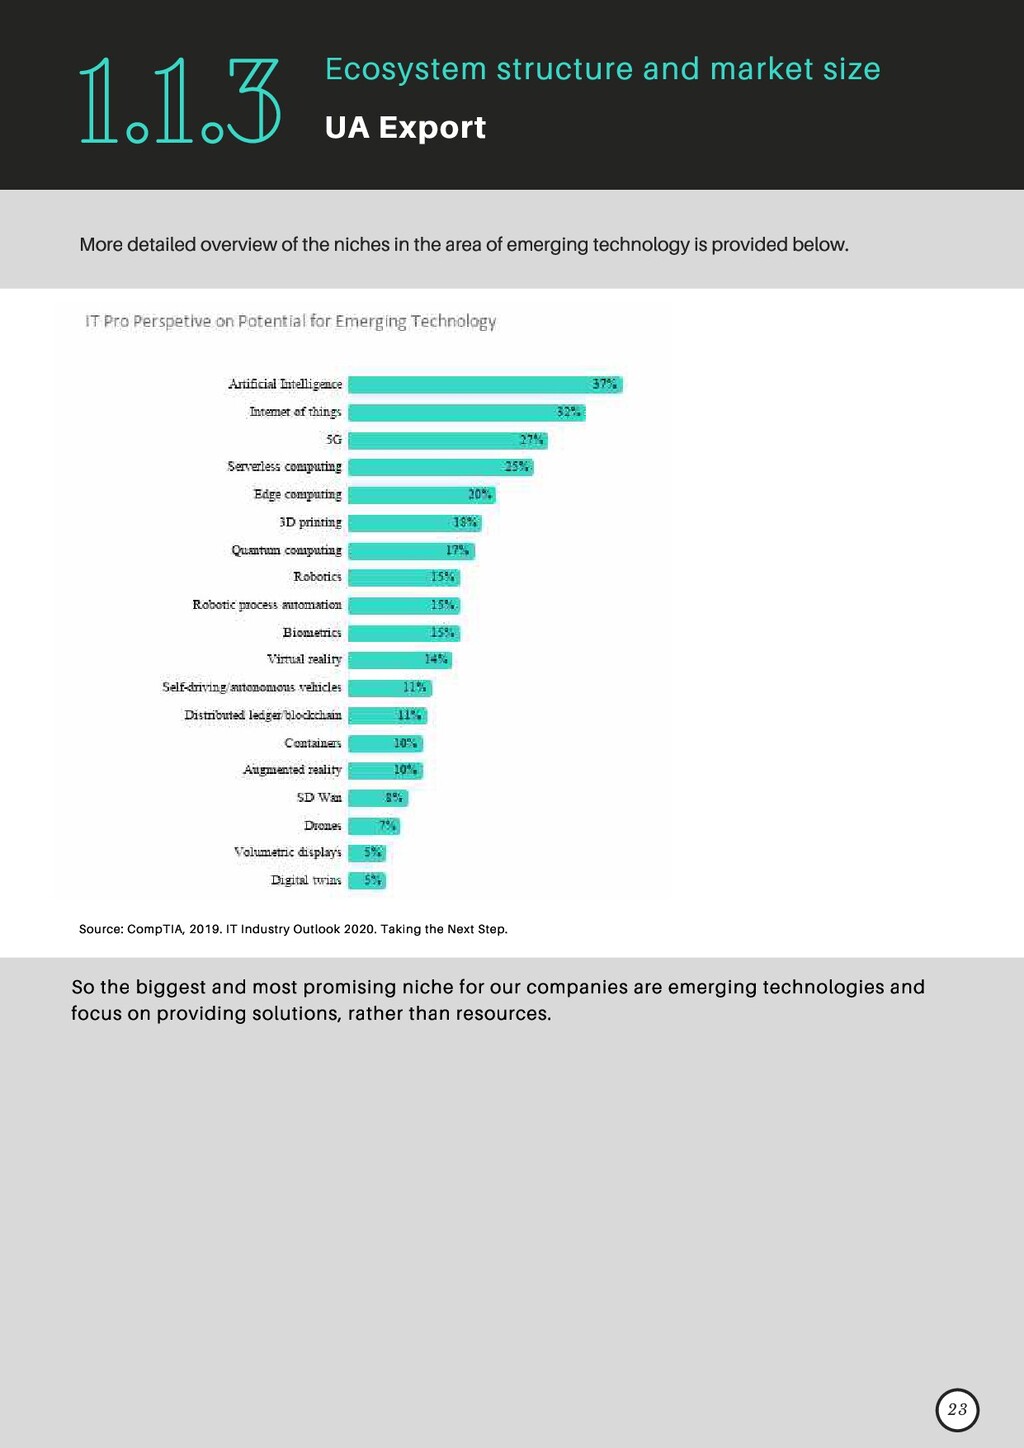
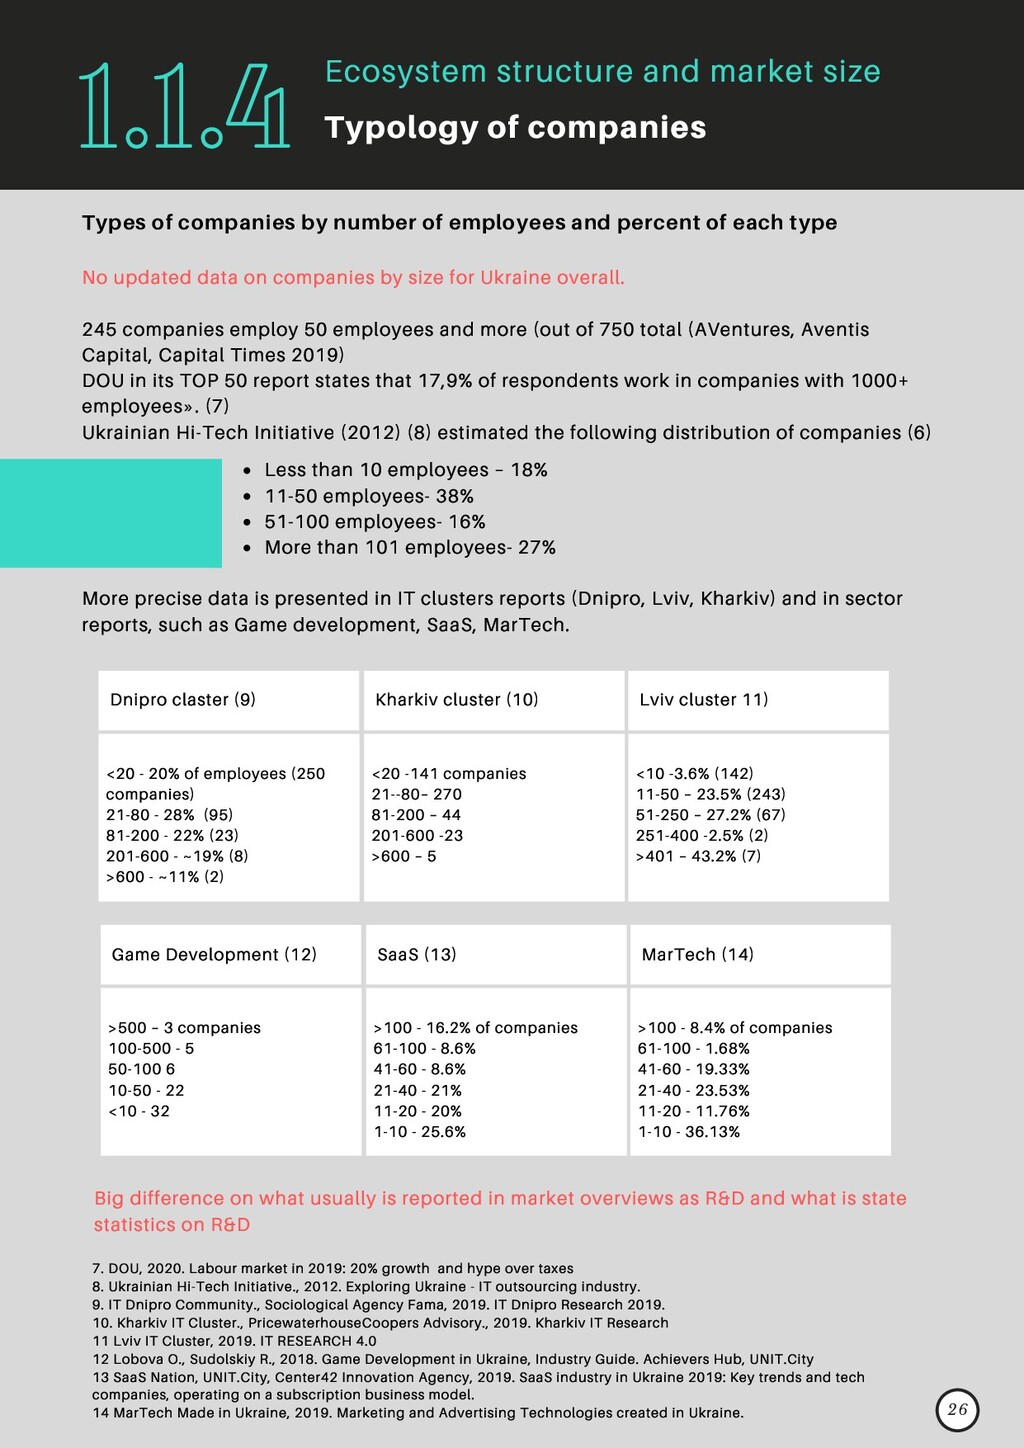
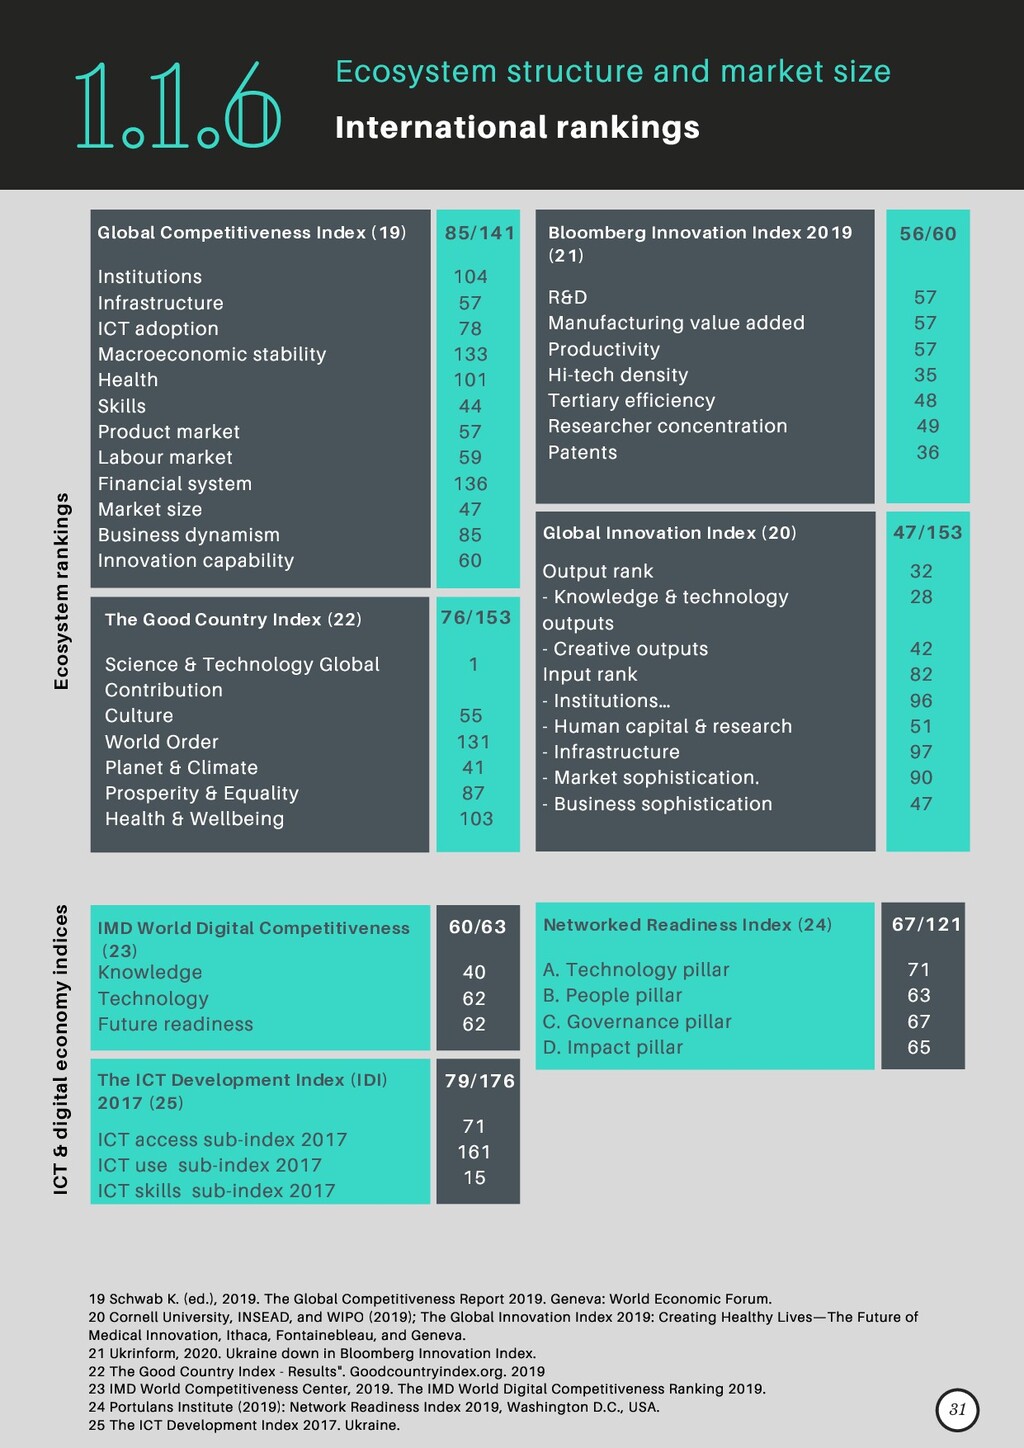
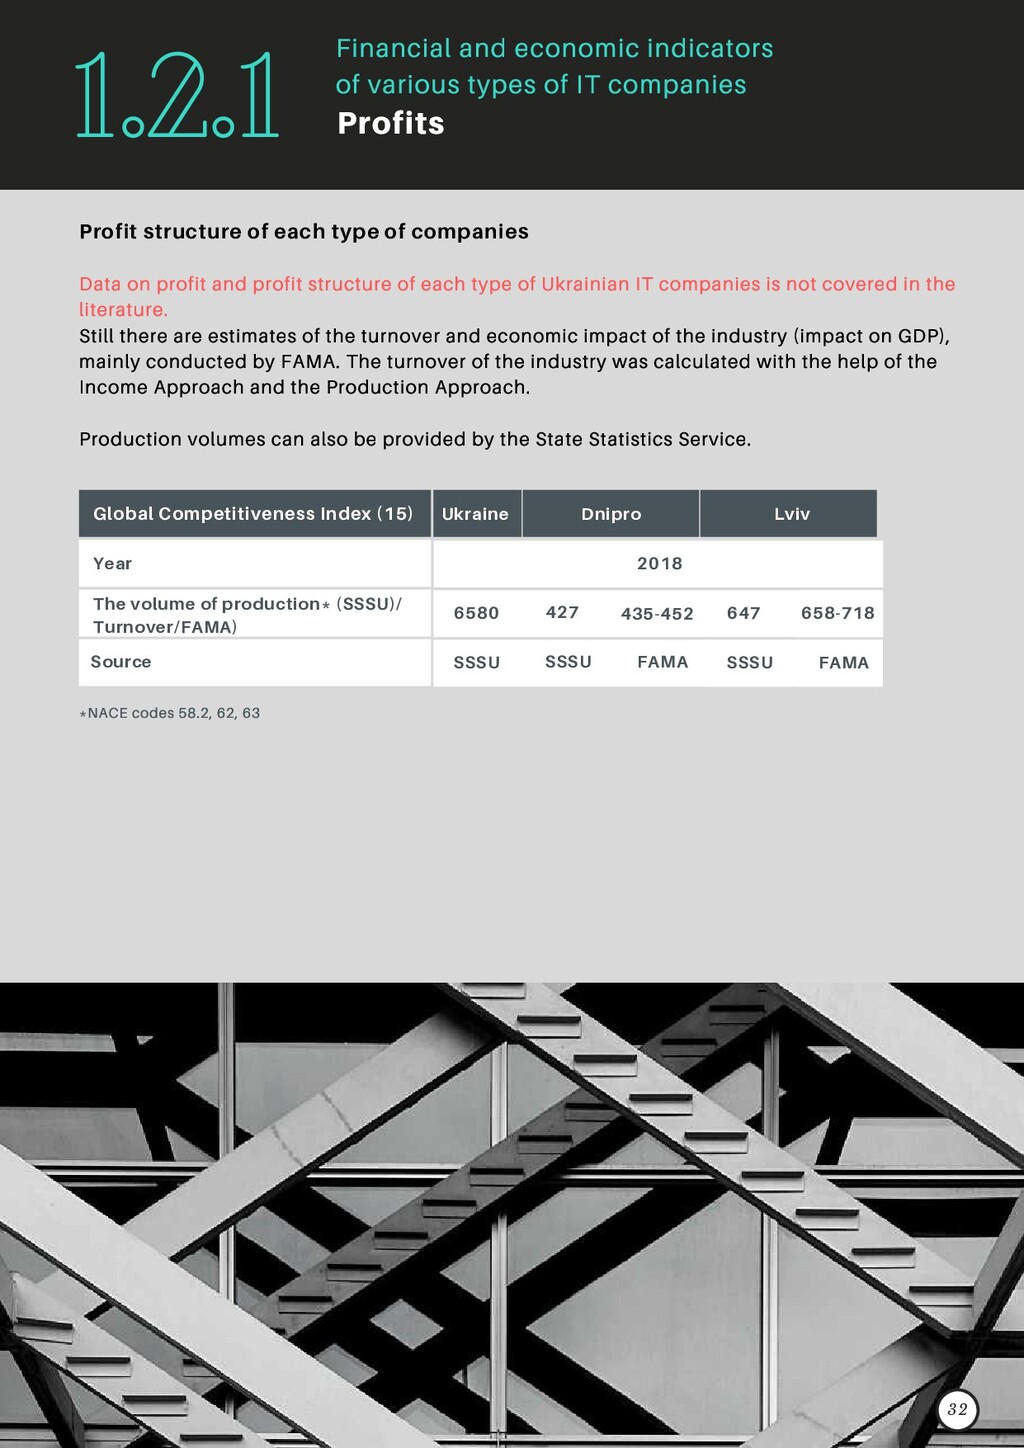
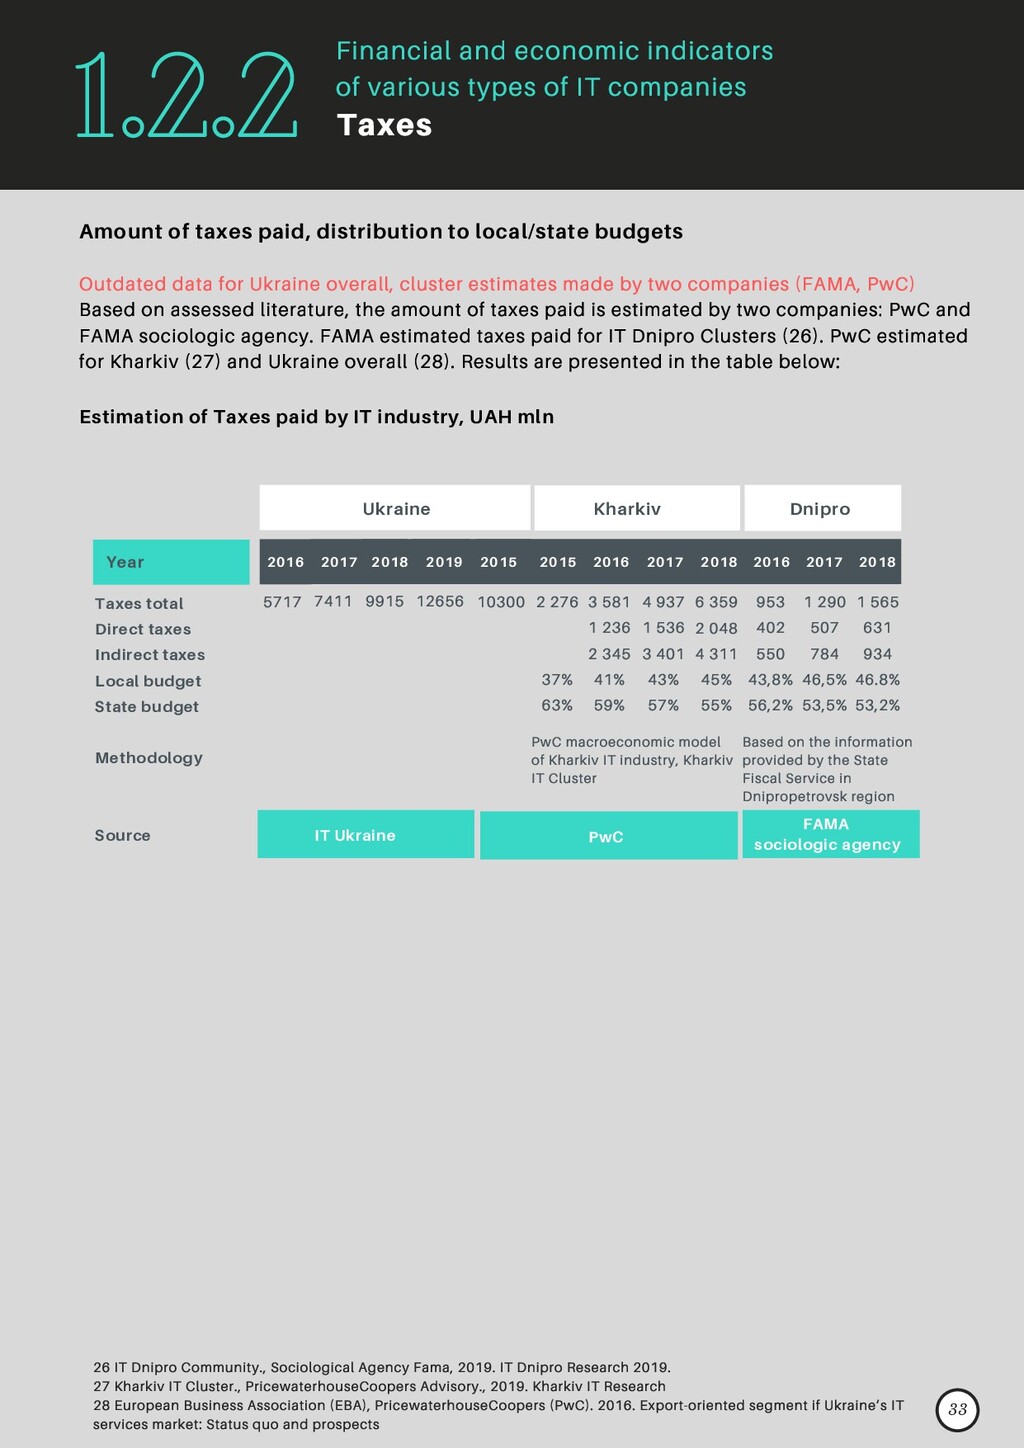
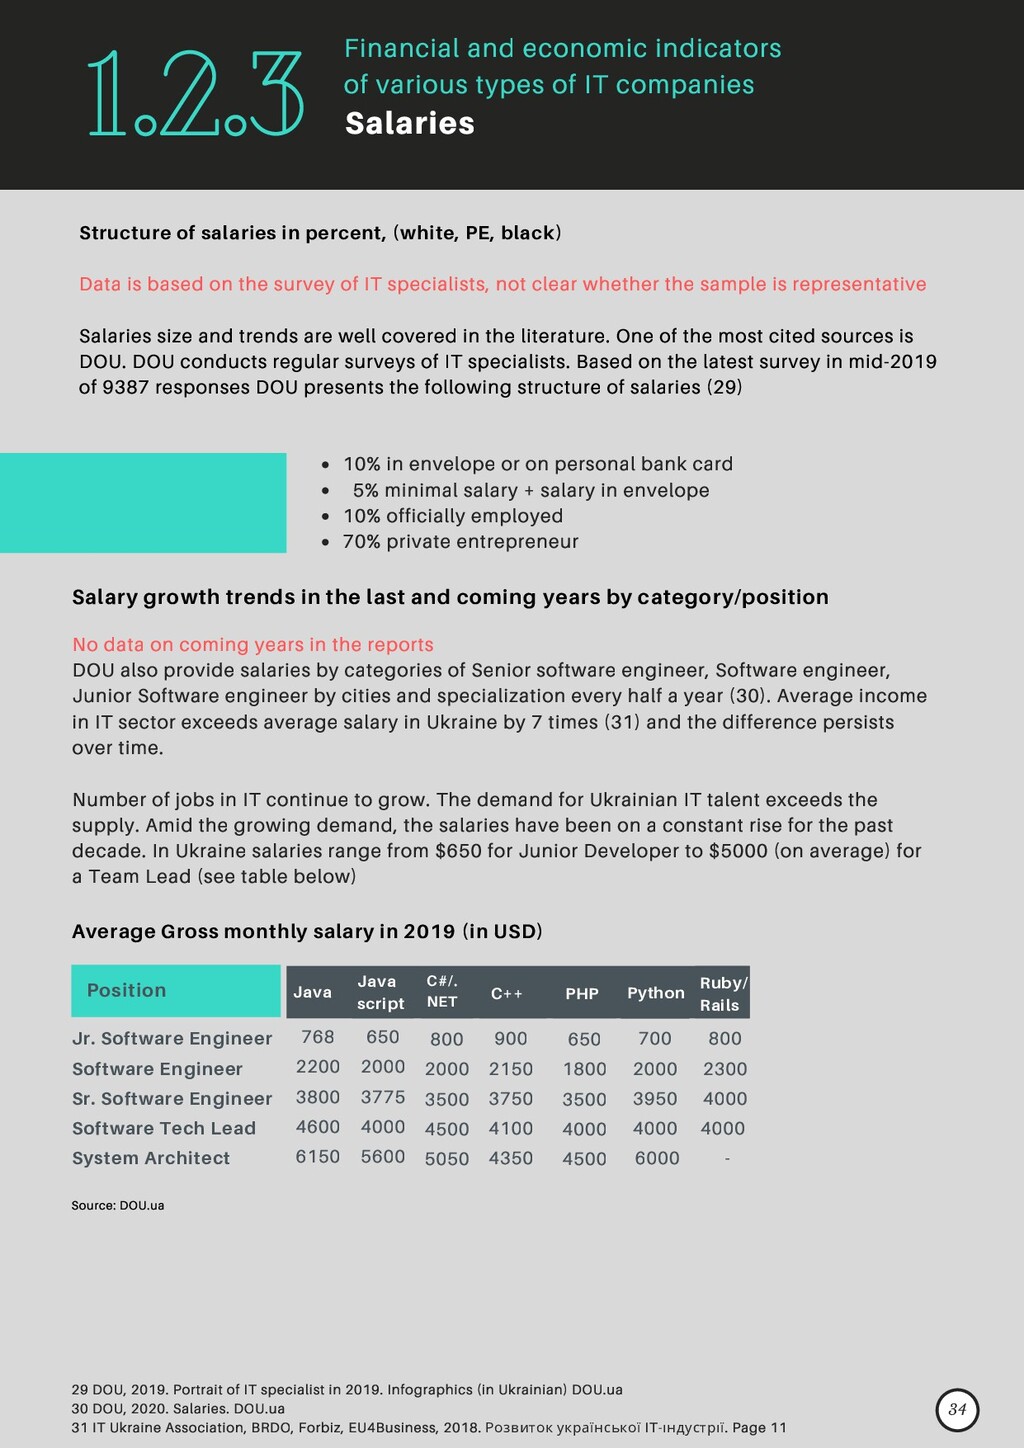
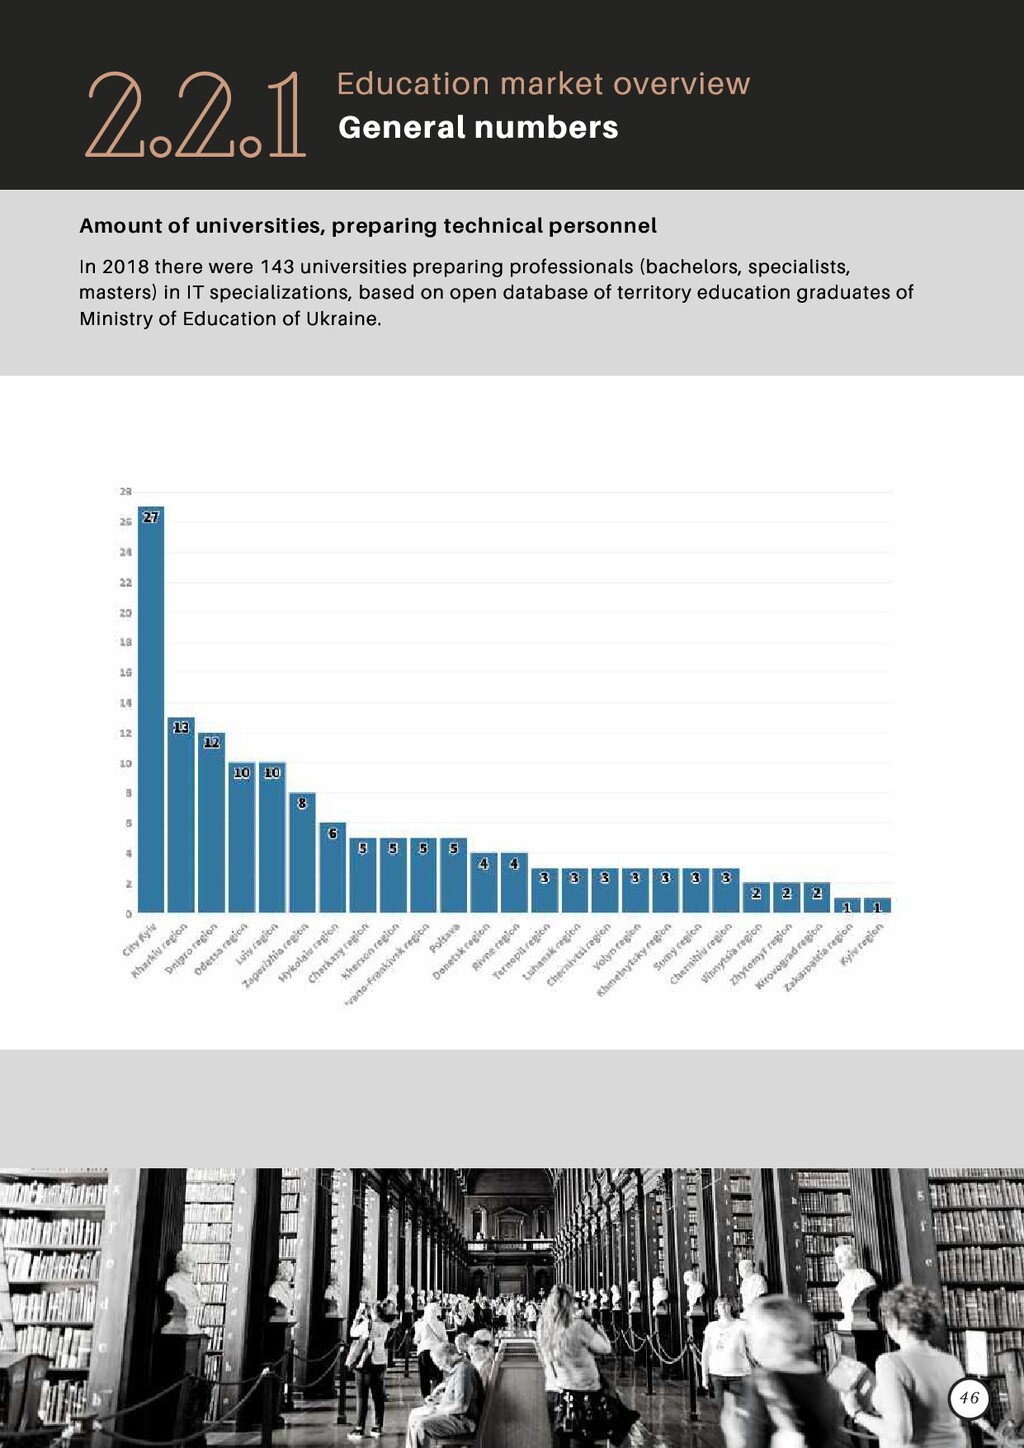
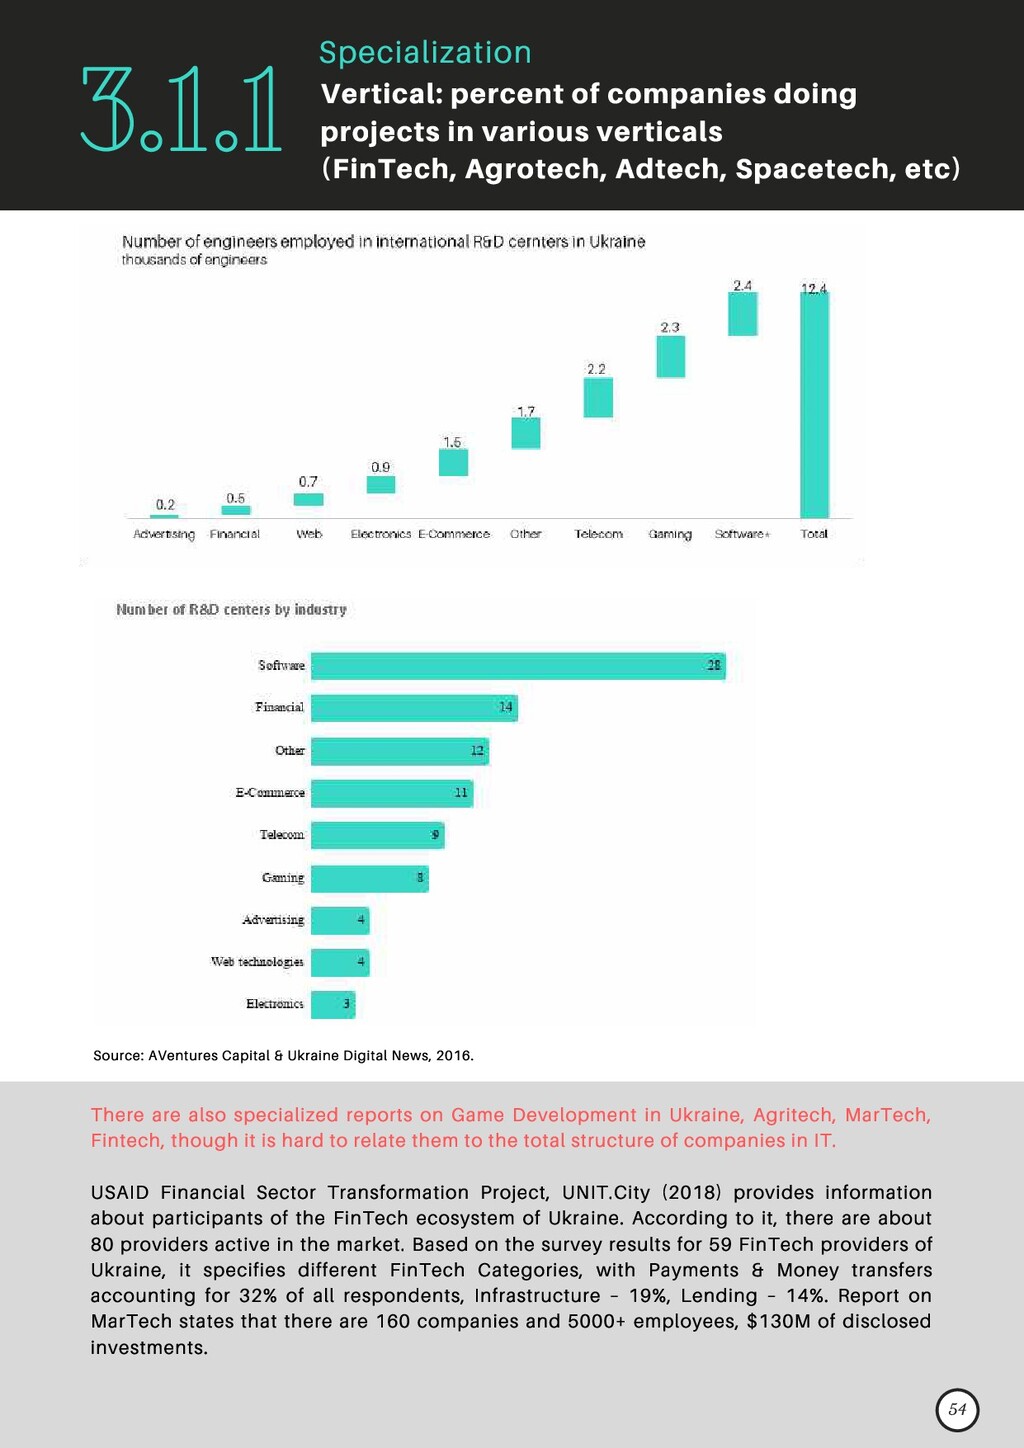
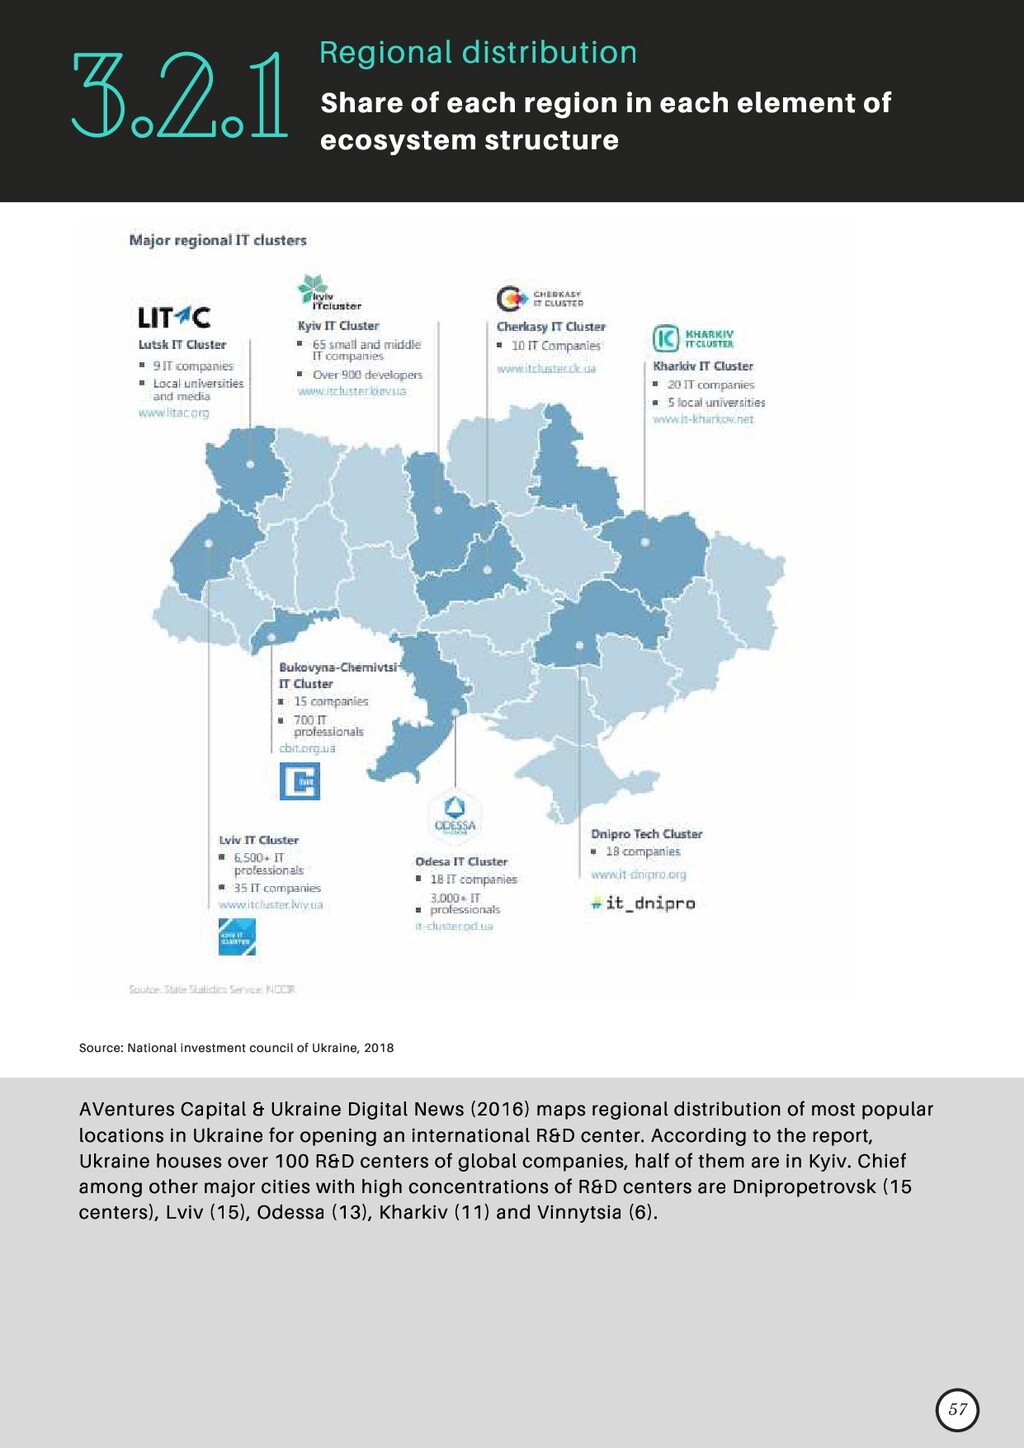
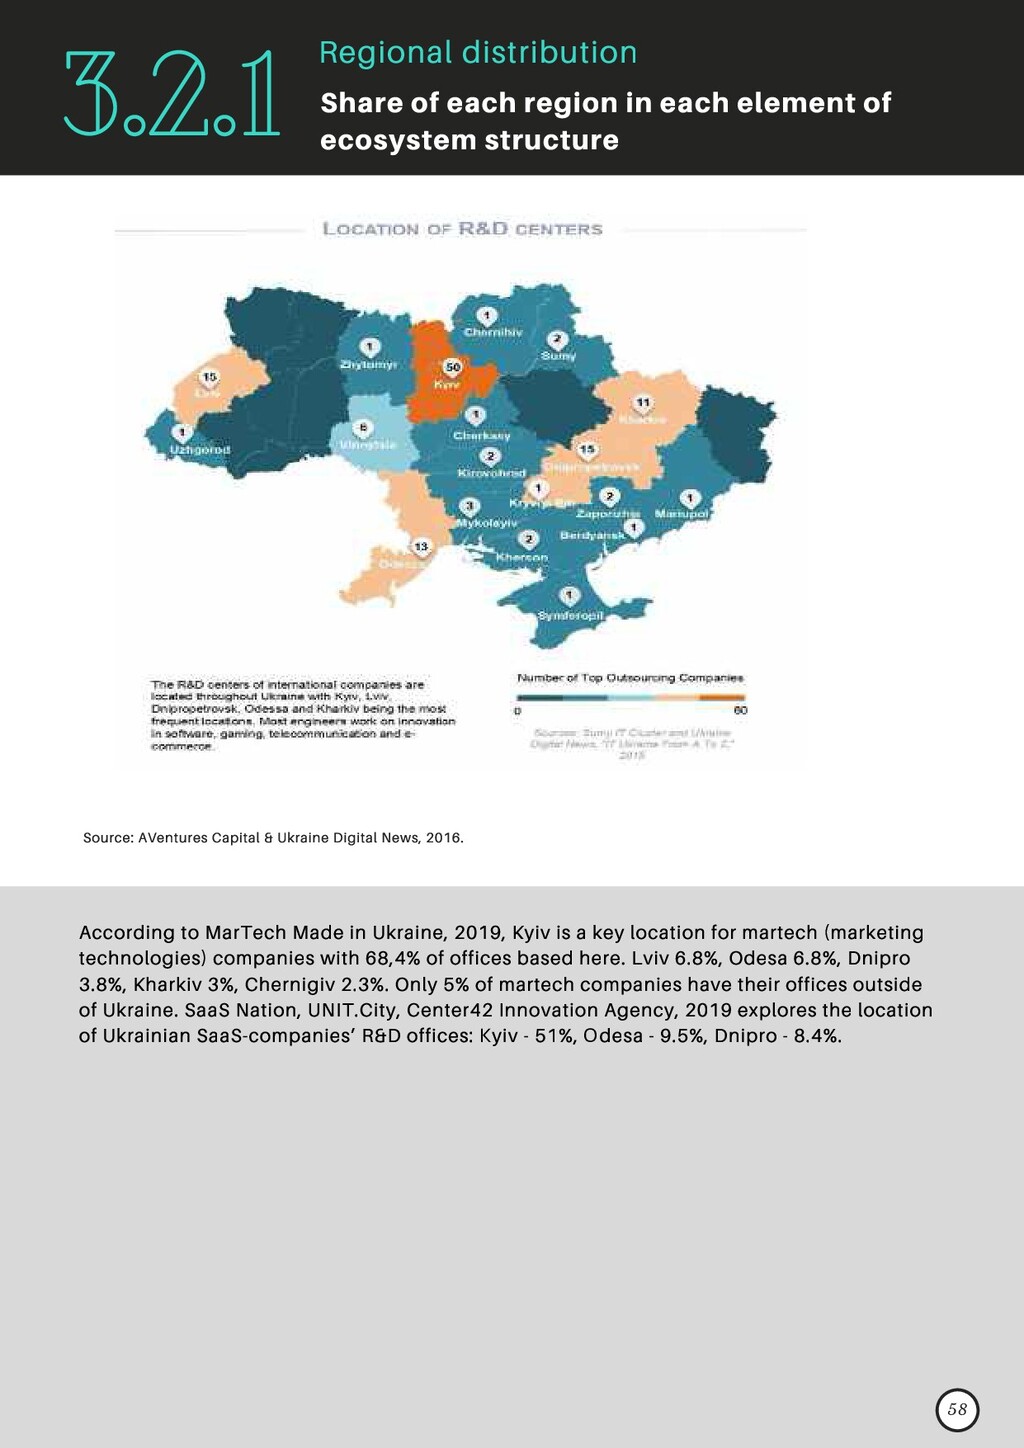
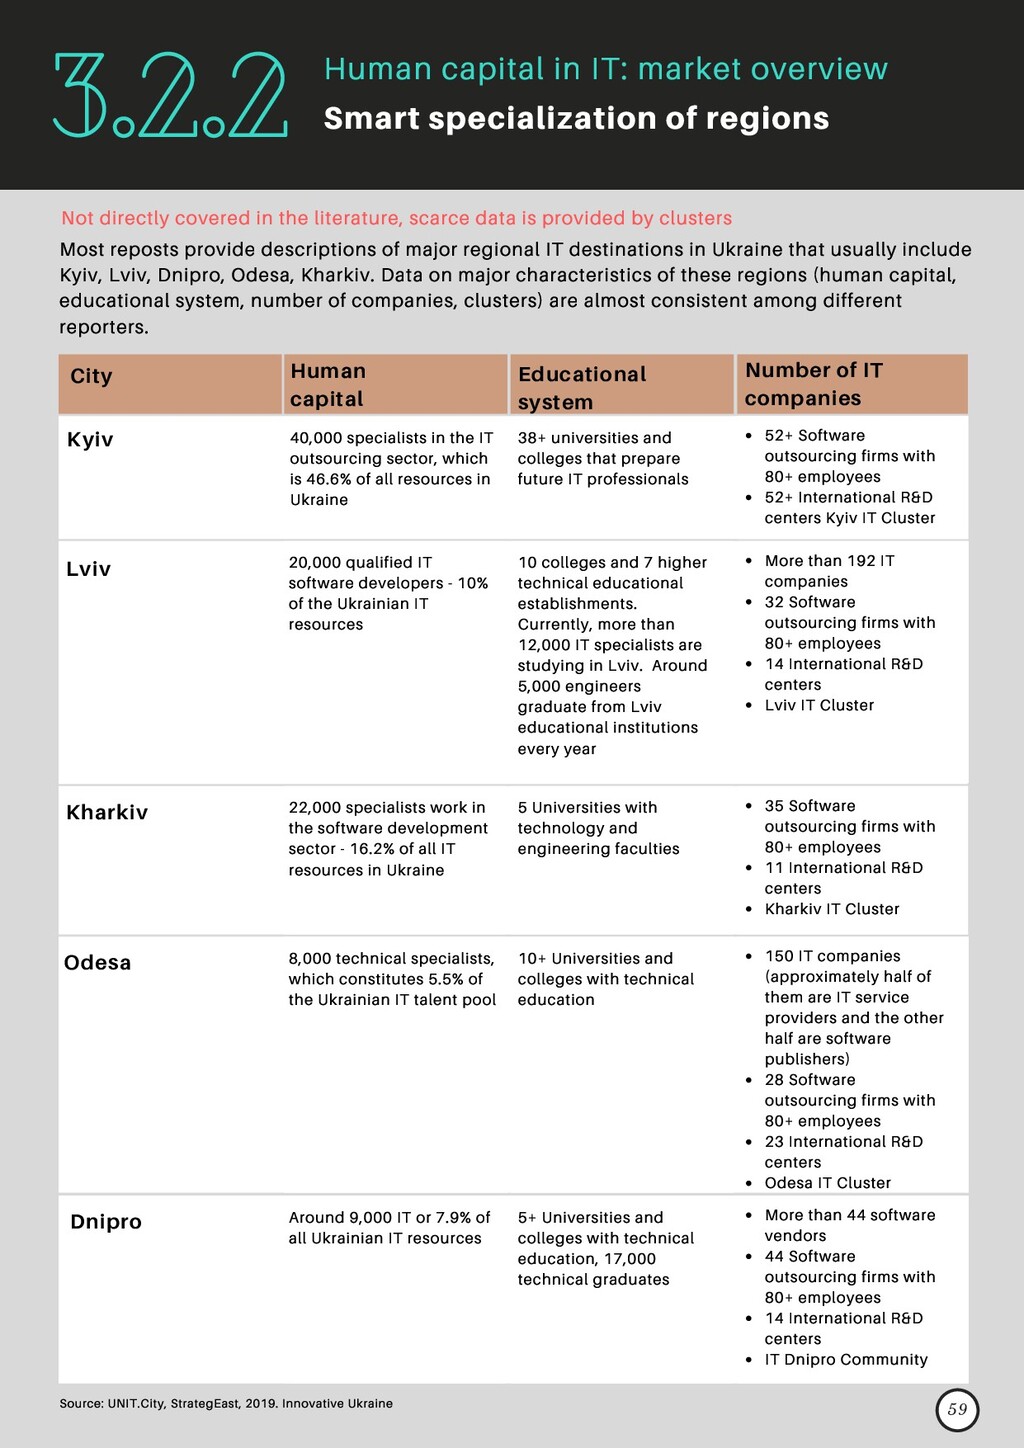
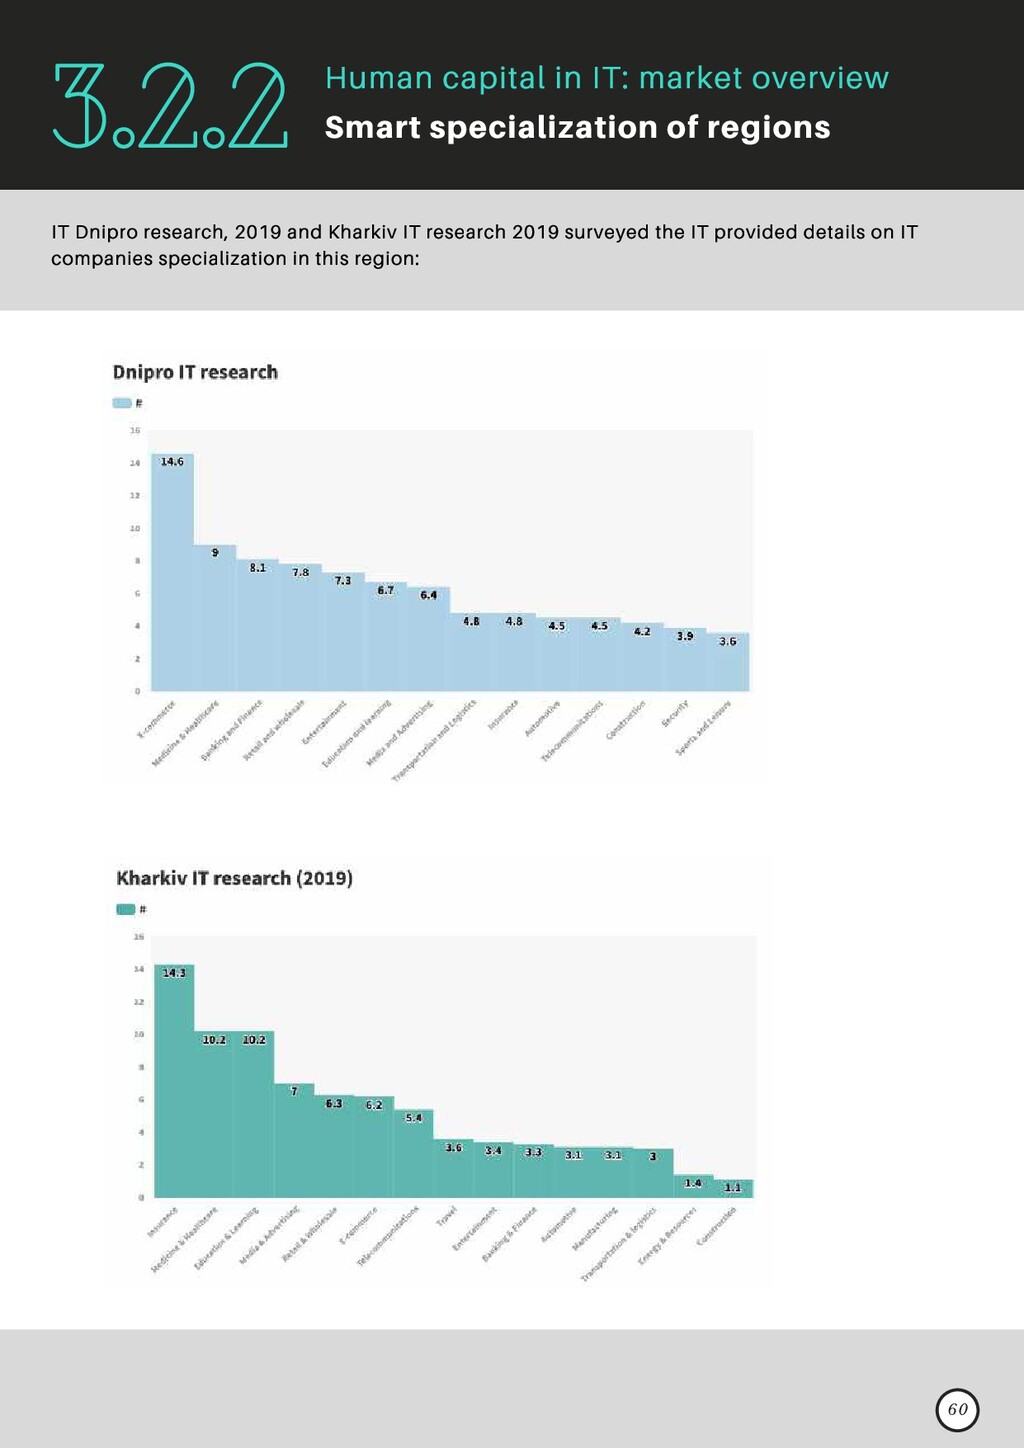
    AMCBridge3E - 3D Space Pro, Albitech Ltd, jaccomo, aPriori, Exadel, TaskPoint
    Archer - room2care.corr, Musketeer, Renault, Volvo, Phone and Pay Rimed,
    Columbia Law School
    Viseven - Novartis, Strato, Abbott, Teva, Sanofi, CodeSters, GaraioLabs
    Master of Code - Mercedes-Benz Bank, Acton Institute, IDG Links, CNS, YouVersion
    Yalantis - Voki, Street EASY
    Sam Solutions - Zerolag, PrintSafari.com, Craft Kidisto.de
    NIX Solutions - Cengage, Learning, zoodog, FlipClips, Yandex, Fiat, Thomson,
    Reuters, Connecture, Meanbee
    Sigma Software - Aol. Collective, Fortum, Gtech, Formpipe, JLoop, SAS, Viaplay
    QArea - Microsoft, RebelMouse, Givelife, BuzzFeed, The Huffington Post
    iTeam - international Telenor, Bond, BullsEye, Telecom, ITC, iTeam, Network
    Altexsoft - Microsoft imshealth, Fareboom, Scientific Games
    Telesens - Kcell, Kyivstar, NEC, Ukrtelecom
    CodeIT - Brewed, Gem II NI, Omega Media, RedApple, Rankly, SST Net, Teknas Inc/
    It should be noted that the list of clients changed considerably over the time covered in these
    two reports mentioned above.
    Luxoft – Continental, Alcatel Lucent, Boeing, Bosch, Aepona, City, Harman, Dell
    GlobalLogic - Brady, Converse, BMC Sky Oracle, LinkedIn
    Ciklum – Google, Jabra, Micron, Berlingske, OpenText, ThomasCook, Augaroo
    Infopulse – Allianz, Gorenje,Bics, Quantum, British American Tobacco, Bosch, Evry,
    ING
    Softengi – Boeing, Enviance, Kyivstar, Intel
    Daxx – Euretos, Kwebbl, Viber, Vliegtickets.nl
    Adyax Sony, Johnson & Johnson, LVMH, Slate. EC, United Nations, McDonald's
    Itera – Schibsted, Santander, Bluegarden, Storebrand
    Lohika – HP, Cisco, Twilio, EMC2, Microsoft, Oliver Wyman, Monster, BuzzFeed
    Innovecs – Elementum, edX, WB Turbine
    Softserve – Unilever, IBM, Johnson & Johnson, P&G, Kimberly-Clark, Costco, Pearson,
    Tripadvisor
    Eleks – Xceedium, Xyleme, States of Jersey, Autodesk, Havas, Eagle, tip.ly, Phoenix
    Intellias – Adswizz, Magix, SEP, Core Banking, e-fon, Soreco, FTS, Swissclick.com
    Consensia – Spar Nord, Saxo, Zentuvo, Systematic, Kamstrup
    CoreValue Health decisions, Recyclebank, Xtiva Logs Network, Rolls-Royce
    N-iX – Currency cloud, Streamserve, Anoto, b-to-v, HotSchedules, Novell, Cure Forward
    GeeksForLess - Deluxe, Hostopia, EMC2, BriskMobile, EXG
    Provectus – Vegaster, Selectica, Qwyrk, Men’s Wearhouse
    Intersog – CDW, SAMLearning, Mitsuishi, VideoMedisine, Innomos. Travian Games,
    Neustar
    Envion Software – Adobe, Atex, Chase, AOInternational, Quark
    Dnipro
    Kharkiv
    Kyiv
    Lviv
    Odesa
    19
    1.1.3 UA Export
    Ecosystem structure and market size

    View Slide

  20. By Cerulean Industries
    01
    Ciklum – ThomasCook, Just Eat, Jabra, Kantar Retail
    DataArt Nasdaq, Travelport, Ocado, Betfair
    Daxx – Studytube, Pricena, Oktopost, Kwebbl
    Epam – Amazon, Adobe, SAP, Hotels.com
    Infopulse – Vodafone, ING, Microsoft, Allianz, Bosch.
    Intellias – KIA, Playbuzz. Every Matrix, RTL group
    N-iX – Lebara, Currencycloud, Anoto, HotSchedules,
    Sigma Software – SAS, Volvo, Viaplay, Oath
    IBM, Fiducia & GAD, PTC, Atlassian Corporation, Dassault
    Systemes, Oracle Corporation , Autodesk, Inc, Microsoft,
    CISC, NASA, Manchester City FC, Siemens, Obamacare,
    Deutsche Bank, TOYOTA, Nissan, Jaguar, Mercedes-Benz,
    Peugeot , Toshiba , Infinity, Nestle, L’Oreal, Land Rover,
    Signal Iduna
    Source AVentures, Aventis Capital, Capital Times, 2019. Software development in Ukraine,
    Poland, Belarus and Romania
    IT Dnipro Community, Sociological Agency Fama, 2019. IT Dnipro Research 2019.
    Main countries of exporting destination and dynamics over the last years
    Main products and services exported in 2019 and dynamics over the last years
    Product companies and startups do not constitute a significant share of Ukraine’s exports
    so far but there is great potential for growth in the near future provided favourable
    conditions are created for such growth.
    IT Services Export: 70% development, 30% consulting, R&D, analytics, and other services
    (Tech ecosystem guide to Ukraine 2019, Unit). An absolute majority does web and mobile
    application development, followed by architecture consulting and testing services
    No data on exports in the sectors such as data management, gaming, e-commerce, etc.
    The US market is the main destination with an estimated more than 50% (2019 INNOVATIVE
    UKRAINE, Unit) or 80% (Invest in Ukraine Now Innovation and Opportunities, 2018) volume
    of exported services.
    The UK is in second place (2019 INNOVATIVE UKRAINE, Unit). Ukrainian companies also
    have a long record of cooperation with Germany, Canada, Israel, Sweden, and Switzerland.
    Despite positive trends the Ukrainian market still cannot boast a large amount of
    orders.
    According to the State Statistics Service of Ukraine, key export markets for Ukrainian ICT
    services are EU (including UK, Cyprus, Germany, the Netherlands, Ireland, Sweden), USA,
    Russian Federation, Switzerland, Norway, Israel, Canada and South Korea.
    20
    1.1.3 UA Export
    Ecosystem structure and market size

    View Slide

  21. By Cerulean Industries
    01
    21
    The global information technology industry is on pace to reach $5.2 trillion in 2020,
    according to the research consultancy IDC. CompTIA (4) projects the global information
    technology industry will grow at a rate of 3.7% in 2020.
    The United States is the largest tech market in the world, representing 32% of the total, or
    approximately $1.7 trillion for 2020.
    BOP6 - SI -Telecommunications, computer,
    and information services
    Share of Ukraine in global ICT services export
    BOP6 - SI1 - Telecommunications services
    BOP6 - SI2 - Computer services
    BOP6 - SI3 - Information services
    2018
    2017
    2015 2016
    0.45% 0.48% 0.52% 0.57%
    0.44% 0.34% 0.29% 0.26%
    0.47% 0.54% 0.61% 0.67%
    0.15% 0.09% 0.06% 0.06%
    Source: WTO database (BOP6)
    Share of Ukrainian IT on the global market
    4 CompTIA, 2019. IT Industry Outlook 2020. Taking the Next Step. Viewed 3 Apr 2020
    Source: CompTIA, 2019. IT Industry Outlook 2020. Taking the Next Step.
    Overview of trends and demand in global markets (potential niches for our
    companies)
    1.1.3 UA Export
    Ecosystem structure and market size

    View Slide

  22. By Cerulean Industries
    01
    22
    While emerging technologies currently account for only 17% of the overall global revenue,
    they are expected to drive nearly half of the growth in new revenue. At the same time, while
    emerging technologies will be the driver for growth, they must be used in conjunction with
    more established technologies to create innovative solutions.
    Global Market structure:
    Source: CompTIA, 2019. IT Industry Outlook 2020. Taking the Next Step.
    Source: CompTIA, 2019. IT Industry Outlook 2020. Taking the Next Step.
    1.1.3 UA Export
    Ecosystem structure and market size

    View Slide

  23. By Cerulean Industries
    01
    23
    So the biggest and most promising niche for our companies are emerging technologies and
    focus on providing solutions, rather than resources.
    More detailed overview of the niches in the area of emerging technology is provided below.
    Source: CompTIA, 2019. IT Industry Outlook 2020. Taking the Next Step.
    1.1.3 UA Export
    Ecosystem structure and market size

    View Slide

  24. By Cerulean Industries
    01
    Data on the number of companies registered in Ukraine vary among sources. According to
    SSSU there were 16465 legal entities in the IT sector (58.2 Software publishing,62 Computer
    programming, consultancy and related activities,63.1 Data processing, hosting and related
    activities; web portals) plus 2894 legal entities in other informational services (63.99) often
    used in IT sector. However, all sources agree that this is not reliable data for a number of IT
    companies as many companies can operate several legal entities. In addition, a part of
    companies can be not active on the market. According to SSSU there were only 6241 of
    economically active legal entities in IT in 2018 plus 976 in other informational services
    (63.99). Most sources rely on experts’ estimations of IT companies in Ukraine in general (not
    focusing on the fact whether company is registered in Ukraine or not). And these estimations
    vary widely, including:
    bureaucratic restrictions on accepting payments,
    inability to process smaller and numerous payments for applications from the
    App Store and other sites,
    absence of electronic money and consequently no PayPal or similar method,
    lack of planning security checks,
    limited protection of IP rights,
    complicated processes of managing a company.
    Reliable data on the number of IT companies registered in Ukraine is missing, while experts’
    estimate vary substantially
    Number of companies registered in UA
    1.1.4 Typology of companies
    Ecosystem structure and market size
    4000 IT companies in IT Ukraine Association, BRDO, Forbiz, EU4Business
    report (2018). Only 2309 IT companies were active on the labour market
    1650 IT companies in 2016 in IT Ukraine and BRDO report (2018).
    1000+ IT outsourcing companies and 2000 startups in 2016 in AVentures
    Capital & Ukraine Digital News (2016) and National Investment Council of
    Ukraine (2018).
    750+ IT service companies in AVentures, Aventis Capital, Capital Times report
    (2019).
    More precise estimates can be found in regional reports, though they do not cover Ukraine
    overall.
    Number (or share) of companies which are not registered in Ukraine and main
    reasons why companies are not registering in UA
    Legislative limitations, which are the main reasons not to register in Ukraine are summarized
    in Export strategy for information technologies sector for 2019-2023 and include:
    24

    View Slide

  25. By Cerulean Industries
    01
    25
    Outdated or nonexistent laws to adapt and use the latest information
    technologies hinder sector expansion at the national level. A number of laws
    are either not in place, as is the case with electronic money (very limited
    regulation and extremely inefficient, which makes this instrument dormant),
    or outdated, as is the case with labour legislation that comes from Soviet
    times and restricts the IT sector development to a significant extent.
    In addition, there is a worldwide competition of jurisdictions that compete
    for the opportunity to attract as many technological startups and mature
    companies as possible, and Ukraine is currently losing it to primarily systems
    with Anglo–American law, because they have a lot of experience and
    reliability in dealing with intellectual property. (page 34)
    Legal types of companies and percent of each type
    Not available
    Types of companies by business models (outsourcing, product, startups, etc)
    and percent of each type
    Data is based on the survey of IT specialists, not clear whether the sample is representative
    Based on 9387 responses of IT specialists DOU (5) gives the following distribution of
    workforce:
    IT outsourcing
    company
    45%
    IT product company
    28%
    IT outstaffing company
    9%
    non IT company
    5%
    Startup
    3%
    Freelance
    3%
    IT Ukraine Association, BRDO, Forbiz, EU4Business (6) (2018 ) based on their sample of
    companies state that “around 70% of companies provide services to a broad range of clients
    (EPAM, GlobalLogic, Netcracker and others), around 15% work as Global InHouse Centers
    (GIC) for one parent company (Wargaming.net, Ring, Samsung R&D Institute Ukraine,
    Oracle) and 15% create their own product (Genesis, EVO, Terrasoft)” (page 5-6).
    5 DOU, 2019. Portrait of IT specialist in 2019. Infographics.
    6 IT Ukraine Association, BRDO, Forbiz, EU4Business, 2018. Розвиток української IT- ндустр ї.
    In addition, the strategy states the following:
    1.1.4 Typology of companies
    Ecosystem structure and market size

    View Slide

  26. By Cerulean Industries
    01
    Types of companies by number of employees and percent of each type
    No updated data on companies by size for Ukraine overall.
    245 companies employ 50 employees and more (out of 750 total (AVentures, Aventis
    Capital, Capital Times 2019)
    DOU in its TOP 50 report states that 17,9% of respondents work in companies with 1000+
    employees». (7)
    Ukrainian Hi-Tech Initiative (2012) (8) estimated the following distribution of companies (6)
    7. DOU, 2020. Labour market in 2019: 20% growth and hype over taxes
    8. Ukrainian Hi-Tech Initiative., 2012. Exploring Ukraine - IT outsourcing industry.
    9. IT Dnipro Community., Sociological Agency Fama, 2019. IT Dnipro Research 2019.
    10. Kharkiv IT Cluster., PricewaterhouseCoopers Advisory., 2019. Kharkiv IT Research
    11 Lviv IT Cluster, 2019. IT RESEARCH 4.0
    12 Lobova O., Sudolskiy R., 2018. Game Development in Ukraine, Industry Guide. Achievers Hub, UNIT.City
    13 SaaS Nation, UNIT.City, Center42 Innovation Agency, 2019. SaaS industry in Ukraine 2019: Key trends and tech
    companies, operating on a subscription business model.
    14 MarTech Made in Ukraine, 2019. Marketing and Advertising Technologies created in Ukraine.
    Less than 10 employees – 18%
    11-50 employees- 38%
    51-100 employees- 16%
    More than 101 employees- 27%
    More precise data is presented in IT clusters reports (Dnipro, Lviv, Kharkiv) and in sector
    reports, such as Game development, SaaS, MarTech.
    <20 - 20% of employees (250
    companies)
    21-80 - 28% (95)
    81-200 - 22% (23)
    201-600 - ~19% (8)
    >600 - ~11% (2)
    Dnipro claster (9)
    <20 -141 companies
    21--80– 270
    81-200 – 44
    201-600 -23
    >600 – 5
    Kharkiv cluster (10)
    <10 -3.6% (142)
    11-50 – 23.5% (243)
    51-250 – 27.2% (67)
    251-400 -2.5% (2)
    >401 – 43.2% (7)
    Lviv cluster 11)
    >500 – 3 companies
    100-500 - 5
    50-100 6
    10-50 - 22
    <10 - 32
    Game Development (12)
    >100 - 16.2% of companies
    61-100 - 8.6%
    41-60 - 8.6%
    21-40 - 21%
    11-20 - 20%
    1-10 - 25.6%
    SaaS (13)
    >100 - 8.4% of companies
    61-100 - 1.68%
    41-60 - 19.33%
    21-40 - 23.53%
    11-20 - 11.76%
    1-10 - 36.13%
    MarTech (14)
    26
    Big difference on what usually is reported in market overviews as R&D and what is state
    statistics on R&D
    1.1.4 Typology of companies
    Ecosystem structure and market size

    View Slide

  27. By Cerulean Industries
    01
    IT sector reports define R&D centers as captive
    centers of international companies. Reports
    usually state that there are 90-110 R&D centers
    in Ukraine (AVentures Capital & Ukraine Digital
    News 2016, Unit.City, Western NIS Enterprise
    Fund 2019), though it is not actually known
    whether they do R&D or just provide services to
    their companies as Global InHouse Centers. In
    terms of number of employed IT professionals,
    the most popular industries for R&D in IT are
    telecommunications, e-commerce, gaming and
    other software (AVentures Capital & Ukraine
    Digital News 2016).
    Ukrainian patenting is well described in
    Innolytics Group, SingularityU Kyiv Chapter,
    Unit City and DLA Piper, 2018 (16) . Data
    covers 2007-2017 years. Number of patents
    registered abroad with priority in Ukraine
    amounted to 4 096 in 2007-2017, including
    152 patents in computer technologies.
    In comparison, patents registered abroad
    with foreign jurisdictions only (i.e. without
    priority in Ukraine) amounted to 4 633,
    including 1079 patens in computer
    technologies.
    The National Academy of Sciences counts
    R&D organizations in another way. Data is
    collected based on statistical forms for
    enterprises, scientific organizations,
    educational institutions. Number of
    organizations which conducted R&D
    activities was 950 in all sectors in 2018 and
    this number decreases steadily over years
    (SSSU 2019, page 12)(15). Number of
    employees in R&D activities amounted 88.1
    thousand,
    Out of 950 organizations in R&D, 457 were
    in the public sector, 351 in business, 142 in
    higher education and 0 in the private non-
    profit sector.
    Number of research institutes and universities
    1.1.5 Scientific potential and innovation
    Ecosystem structure and market size
    15 State Statistics Service of Ukraine(SSSU), 2019. Scientific and innovation activity in Ukraine in 2018 (in Ukrainian).
    Statistical digest.
    16 Innolytics Group, SingularityU Kyiv Chapter, Unit City and DLA Piper, 2018. Ukraine in the Global Innovation Dimension
    Report 2007-2017.
    Number of patents issued
    This implies that patents in computer
    technologies are focused on foreign
    markets.
    Patenting of IT sector is summarized on
    the figure below (see Innolytics Group,
    SingularityU Kyiv Chapter, Unit City and
    DLA Piper 2018, page 26).
    There was no significant increase in patent
    activity over 2014-2017.
    27

    View Slide

  28. By Cerulean Industries
    01
    Total
    natural sciences
    technical sciences
    medical sciences
    agricultural sciences
    social sciences
    humanities
    28
    16 773.7 100%
    3 457.0 21%
    10 678.6 64%
    616.1 4%
    976.0 6%
    687.9 4%
    358.2 2%
    Total R&D expenditures amounted to UAH 16.8 bn in 2018, including 3.8 bn on fundamental
    research, 3.6 bn on applied research, 9.4 bn on experimental development.R&D
    expenditures constituted 0.45% in 2017 (0.47% of GDP in 2018), compared to 2.06% in EU-
    28, 1.03% in Poland, 1.29% in Estonia, 0.51% in Latvia, 0.89% in Lithuania, 0.50% in Romania.
    For more details, please see SSSU 2019 or World Development Indicators database by the
    World Bank.
    SSSU gives the following distribution of R&D expenditures by sector (SSSU 2019, page 54)
    Size of investments in R&D
    Source: Innolytics Group, SingularityU Kyiv Chapter, Unit City and DLA Piper, 2018. Ukraine in the Global Innovation Dimension Report
    2007-2017, page 26
    UAH mln Share, %
    1.1.5 Scientific potential and innovation
    Ecosystem structure and market size

    View Slide

  29. By Cerulean Industries
    01
    29
    Ukraine’s largest partner for joint R&D activities in IT remains the United States, followed by
    the EU countries, Israel and others. (AVentures Capital & Ukraine Digital News 2016). Out of
    96 R&D centers in the report, 44 were from the US.
    International cooperation in R&D
    Source: AVentures Capital & Ukraine Digital News, 2016. IT Ukraine. IT services and software R&D in Europe’s rising tech nation, page 145
    1.1.5 Scientific potential and innovation
    Ecosystem structure and market size

    View Slide

  30. By Cerulean Industries
    01
    Overall, Ukraine usually scores higher in education (due to the higher education rollover
    ratio), skills and knowledge output and lower on macroeconomic stability, institutions,
    and business environment.
    1.1.6 International rankings
    Ecosystem structure and market size
    Ecosystem rankings
    StartupBlink Startup Ecosystem Rankings (17)
    A.T. Kearney Global Services locations (18)
    31/100
    Financial attractiveness
    20/50
    People skills and availability
    3
    Business environment
    33
    Digital resonance
    47
    34
    30
    17 StartupBlink, 2019. Startup Ecosystem Rankings Report 2019
    18 A.T..Kearney, 2019 Digital resonance: the new factor influencing location attractiveness. The 2019 Kearney Global Services
    Location Index

    View Slide

  31. By Cerulean Industries
    01
    Ecosystem rankings
    Global Competitiveness Index (19) 85/141
    Institutions
    Infrastructure
    ICT adoption
    Macroeconomic stability
    Health
    Skills
    Product market
    Labour market
    Financial system
    Market size
    Business dynamism
    Innovation capability
    104
    57
    78
    133
    101
    44
    57
    59
    136
    47
    85
    60
    Bloomberg Innovation Index 2019
    (21)
    56/60
    R&D
    Manufacturing value added
    Productivity
    Hi-tech density
    Tertiary efficiency
    Researcher concentration
    Patents
    57
    57
    57
    35
    48
    49
    36
    The Good Country Index (22) 76/153
    Science & Technology Global
    Contribution
    Culture
    World Order
    Planet & Climate
    Prosperity & Equality
    Health & Wellbeing
    1
    55
    131
    41
    87
    103
    Global Innovation Index (20) 47/153
    Output rank
    - Knowledge & technology
    outputs
    - Creative outputs
    Input rank
    - Institutions…
    - Human capital & research
    - Infrastructure
    - Market sophistication.
    - Business sophistication
    32
    28
    42
    82
    96
    51
    97
    90
    47
    19 Schwab K. (ed.), 2019. The Global Competitiveness Report 2019. Geneva: World Economic Forum.
    20 Cornell University, INSEAD, and WIPO (2019); The Global Innovation Index 2019: Creating Healthy Lives—The Future of
    Medical Innovation, Ithaca, Fontainebleau, and Geneva.
    21 Ukrinform, 2020. Ukraine down in Bloomberg Innovation Index.
    22 The Good Country Index - Results". Goodcountryindex.org. 2019
    23 IMD World Competitiveness Center, 2019. The IMD World Digital Competitiveness Ranking 2019.
    24 Portulans Institute (2019): Network Readiness Index 2019, Washington D.C., USA.
    25 The ICT Development Index 2017. Ukraine.
    IMD World Digital Competitiveness
    (23)
    60/63
    Knowledge
    Technology
    Future readiness
    40
    62
    62
    Networked Readiness Index (24) 67/121
    A. Technology pillar
    B. People pillar
    C. Governance pillar
    D. Impact pillar
    71
    63
    67
    65
    The ICT Development Index (IDI)
    2017 (25)
    79/176
    ICT access sub-index 2017
    ICT use sub-index 2017
    ICT skills sub-index 2017
    71
    161
    15
    ICT & digital economy indices
    31
    1.1.6 International rankings
    Ecosystem structure and market size

    View Slide

  32. By Cerulean Industries
    01
    Global Competitiveness Index (15)
    Year 2018
    The volume of production* (SSSU)/
    Turnover/FAMA)
    6580
    Source SSSU
    Ukraine
    427
    SSSU
    Dnipro
    435-452
    FAMA
    647
    SSSU
    658-718
    FAMA
    Lviv
    *NACE codes 58.2, 62, 63
    32
    1.2.1 Profits
    Financial and economic indicators
    of various types of IT companies
    Profit structure of each type of companies
    Data on profit and profit structure of each type of Ukrainian IT companies is not covered in the
    literature.
    Still there are estimates of the turnover and economic impact of the industry (impact on GDP),
    mainly conducted by FAMA. The turnover of the industry was calculated with the help of the
    Income Approach and the Production Approach.
    Production volumes can also be provided by the State Statistics Service.

    View Slide

  33. By Cerulean Industries
    01
    Amount of taxes paid, distribution to local/state budgets
    Outdated data for Ukraine overall, cluster estimates made by two companies (FAMA, PwC)
    Based on assessed literature, the amount of taxes paid is estimated by two companies: PwC and
    FAMA sociologic agency. FAMA estimated taxes paid for IT Dnipro Clusters (26). PwC estimated
    for Kharkiv (27) and Ukraine overall (28). Results are presented in the table below:
    26 IT Dnipro Community., Sociological Agency Fama, 2019. IT Dnipro Research 2019.
    27 Kharkiv IT Cluster., PricewaterhouseCoopers Advisory., 2019. Kharkiv IT Research
    28 European Business Association (EBA), PricewaterhouseCoopers (PwC). 2016. Export-oriented segment if Ukraine’s IT
    services market: Status quo and prospects
    Estimation of Taxes paid by IT industry, UAH mln
    Year
    Taxes total
    Direct taxes
    Indirect taxes
    Local budget
    State budget
    Methodology
    Source
    5717 7411 9915 12656 10300
    Ukraine
    2016 2017 2018 2019 2015
    2 276
    37%
    63%
    Kharkiv
    2015 2016 2017
    3 581
    1 236
    2 345
    41%
    59%
    4 937
    1 536
    3 401
    43%
    57%
    2018
    6 359
    2 048
    4 311
    45%
    55%
    Dnipro
    2016 2017
    953
    402
    550
    43,8%
    56,2%
    1 290
    507
    784
    46,5%
    53,5%
    2018
    1 565
    631
    934
    46.8%
    53,2%
    PwC macroeconomic model
    of Kharkiv IT industry, Kharkiv
    IT Cluster
    Based on the information
    provided by the State
    Fiscal Service in
    Dnipropetrovsk region
    IT Ukraine PwC
    FAMA
    sociologic agency
    33
    1.2.2
    Taxes
    Financial and economic indicators
    of various types of IT companies

    View Slide

  34. By Cerulean Industries
    01
    Structure of salaries in percent, (white, PE, black)
    Data is based on the survey of IT specialists, not clear whether the sample is representative
    Salaries size and trends are well covered in the literature. One of the most cited sources is
    DOU. DOU conducts regular surveys of IT specialists. Based on the latest survey in mid-2019
    of 9387 responses DOU presents the following structure of salaries (29)
    29 DOU, 2019. Portrait of IT specialist in 2019. Infographics (in Ukrainian) DOU.ua
    30 DOU, 2020. Salaries. DOU.ua
    31 IT Ukraine Association, BRDO, Forbiz, EU4Business, 2018. Розвиток української IT- ндустр ї. Page 11
    Salary growth trends in the last and coming years by category/position
    Position
    Jr. Software Engineer
    Software Engineer
    Sr. Software Engineer
    Software Tech Lead
    System Architect
    768
    2200
    3800
    4600
    6150
    650
    2000
    3775
    4000
    5600
    800
    2000
    3500
    4500
    5050
    900
    2150
    3750
    4100
    4350
    650
    1800
    3500
    4000
    4500
    Java
    Java
    script
    C#/.
    NET
    C++ PHP
    700
    2000
    3950
    4000
    6000
    Python
    Ruby/
    Rails
    800
    2300
    4000
    4000
    -
    10% in envelope or on personal bank card
    5% minimal salary + salary in envelope
    10% officially employed
    70% private entrepreneur
    No data on coming years in the reports
    DOU also provide salaries by categories of Senior software engineer, Software engineer,
    Junior Software engineer by cities and specialization every half a year (30). Average income
    in IT sector exceeds average salary in Ukraine by 7 times (31) and the difference persists
    over time.
    Number of jobs in IT continue to grow. The demand for Ukrainian IT talent exceeds the
    supply. Amid the growing demand, the salaries have been on a constant rise for the past
    decade. In Ukraine salaries range from $650 for Junior Developer to $5000 (on average) for
    a Team Lead (see table below)
    Average Gross monthly salary in 2019 (in USD)
    Source: DOU.ua
    34
    1.2.3
    Salaries
    Financial and economic indicators
    of various types of IT companies

    View Slide

  35. By Cerulean Industries
    01
    35
    As the demand greatly exceeds supply, companies compete not only with salaries but also
    offer other employee benefits, including modern office spaces, flexible working schedules,
    appealing food and challenging projects (32).
    Among Belarus, Poland, Romania and Ukraine, the salary rates are similar with Belarus being
    a slightly cheaper talent market (33).
    32 AVentures, Aventis Capital, Capital Times, 2019. Software development in Ukraine, Poland, Belarus and Romania
    33 AVentures, Aventis Capital, Capital Times, 2019. Software development in Ukraine, Poland, Belarus and Romania,
    page 15
    Source: AVentures, Aventis Capital, Capital Times, 2019. Software development in Ukraine, Poland, Belarus and Romania
    1.2.3
    Salaries
    Financial and economic indicators
    of various types of IT companies

    View Slide

  36. By Cerulean Industries
    01
    Size of investments in the IT sector
    Data on investment in IT comes from two sources: AVentures annual dealbook reports (34) and
    Ukranian Venture Capital Association and Aventures (35) publications.
    According to Aventures, investment to tech sector was USD 544 m (compared to USD 323 in
    2018). 77% of investment went to three companies Gitlab, Grammarly, People.ai. (AVentures
    Capital 2020, page 5-6)
    Investments amounted to USD 510m according to UVCA report (337m in 2018), including USD
    460m of M&A deals, USD 6.1m of angel investment, USD 38m of private equity investment.
    34 AVentures Capital, 2020. DealBook of Ukraine. 2020 edition.
    35 Ukrainian Venture Capital and Private Equity Association (UVCA), Delloitte, 2020. Ukrainian venture Capital and Private
    Equity Overview 2019.
    Types of investments by phase (seed, growth, etc)
    Two sources give the following estimates on funding on each stage.
    USD m
    Year
    Total investment
    Seed
    544
    20
    Aventures
    337
    18
    337
    12
    323
    30
    UVCA, Deloitte
    2018 2019 2018 2019
    Round A
    Round B
    26
    0
    18
    30
    15
    0
    19
    30
    Growth
    Undisclosed deals
    498
    -
    180
    87
    439
    40
    244
    -
    Type of investments by sources (UA located, attracted foreign capital etc.)
    Data vary between two sources
    Share of foreign capital in 2018: 53% (~11m out of 20) in seed stage and 61% (~16m out of
    26m) in Series A. Aventures notes that Ukraine-born companies typically build physical
    presence in their target markets (US/ EU) and raise Series A-C abroad. As a result, Ukrainian
    startups compete globally for early stage financing in international financing hubs.
    According to UVCA Ukranian funds constituted only USD 8m (1.7% of disclosed deals). Main
    countries of origin are US (423M), UAE, EU etc.
    Local VC funds slowed down new investments, waiting for exits to raise next funds.
    36
    1.2.4
    Capital & Investments
    Financial and economic indicators
    of various types of IT companies

    View Slide

  37. By Cerulean Industries
    01
    Number of exits and M&A
    According to UVCA and Deloitte (2020), number of exits has jumped to 29 in 2019 compared to
    8 in 2018
    Types of investors and investor map
    Maps are not complete
    Aventures (2020) and UVCA and Deloitte (2020) gives the following information on investors
    37
    36 Ukrainian Venture Capital and Private Equity Association (UVCA), 2017. Investors Book. Who is who on the Ukrainian
    investment market.
    Source: Aventures 2020, page 10
    UVCA and Deloitte (2020) cites the following companies: Aventures, Horizon Capital, SMRK
    VC Fund, ICU, FISON, Overkill, Genesis, Wise Guys, TA ventures, TAAS Capital Fund,
    Innovation D.TEK. Also in 2017 UVCA published investors’ book Who is who on the
    Ukrainian investment market with more detailed description of investors (36).
    1.2.4
    Capital & Investments
    Financial and economic indicators
    of various types of IT companies

    View Slide

  38. By Cerulean Industries
    01
    Types of infrastructure, required for IT companies to operate
    well (interconnections of IT sphere and infrastructure through analysis of cost
    structure - spending on infrastructure by companies as a share in costs)
    N/A
    1.3 1.3.1 Infrastructure
    1.3.2 Broadband internet, 4g and similar
    indicators
    Infrastructure
    37 BRDO, 2019. 900 MHz band use expands 4G coverage throughout Ukraine within 1.5 year.
    38 Boyland P., 2019. The State of mobile network experience. Benchmarking mobile on the eve of the 5G revolution.
    Opensignal.
    39 World bank. Fixed broadband subscriptions – Ukraine.World Development Indicatos, The World Bank Group.
    40 State Statistical Service of Ukraine (SSSU), 2019. Communication subscribers as of January 1, 2019
    4G
    BRDO cites unofficial data on 4G coverage.
    “In Europe, 4G communication is available
    to more than 90% of the population: in the
    Czech – to 98.8%, in Sweden – to 100% of
    the population. In Ukraine, according to
    unofficial data, this figure goes up to 65%
    (37).
    Similar data is provided in Opensignal report
    “The State of mobile network experience”
    (38). The report aims to provide comparable
    data across countries on mobile user
    experience as 4G Availability for 87
    countries. 4G Availability shows the
    proportion of time Opensignal users with a
    4G device have a 4G connection. 4G
    Availability is not a measure of coverage or
    the geographic extent of a network.
    According to the report, 4G is available
    66.4% of the time in Ukraine.
    The Radio-Frequency Resource (RFR) is a
    key in 4G provision: low frequencies provide
    a larger coverage range, while high
    frequencies are better suited for the
    transmission of large volumes of
    information.
    It is costly to provide coverage for the
    countryside and roads in these bans. In
    February, the Cabinet of Ministers of Ukraine
    lifted a prohibition on the use of 4G in the
    800-900 MHz bands (Order No. 41 of
    05.02.2020), which is better suited for large
    open spaces and countryside.
    Fixed broadband
    World Bank provides data on Fixed
    broadband subscription. For Ukraine it
    constitutes 5,405 (39).1 thousand as of end-
    2018. This corresponds to 12.8
    subscriptions per 100 people, compared to
    14.49 world average and 35.02 for the EU in
    2018. World Bank data comes from the
    International Telecommunication Union,
    World Telecommunication/ICT
    Development Report and database. SSSU
    also gives the number of internet
    subscribers, including 5288.3 thousand of
    fixed broadband subscribers as of end-2018
    (40).
    38
    Broadband internet, 4G and similar indicators (narrow understanding of
    infrastructure)

    View Slide

  39. Human Capital
    2. 1
    Human capital in IT:
    market overview
    2
    2. 2
    Education market
    overview
    2. 3
    Existing gaps analysis

    View Slide

  40. By Cerulean Industries
    01
    Junior 27%
    Middle 36%
    Senior 19%
    Lead 11%
    DOU, Ukraine Total
    Junior 25%
    Middle 42%
    Senior 33%
    Kharkiv (43)
    Trainee 3%
    Junior 24%
    Middle 45%
    Senior 28%
    Dnipro (44)
    Trainee 3%
    Junior 26%
    Middle 42%
    Senior 30%
    Lviv (45)
    40
    2.1.1 Specialists
    Human capital in IT: market overview
    Number of specialists that work in IT sphere in IT companies
    There are different sources on the number of people working in IT sector, but they all give
    very similar results
    41 DOU, 2019. Ринок прац 2019: р ст 20% й аж отаж навколо податк в.
    42 IT Ukraine Association, BRDO, Forbiz, EU4Business, 2018. Розвиток української IT- ндустр ї
    43 Kharkiv IT Cluster., PricewaterhouseCoopers Advisory., 2019. Kharkiv IT Research.
    44 IT Dnipro Community., Sociological Agency Fama, 2019. IT Dnipro Research 2019.
    45 Lviv IT Cluster, 2017. Economic impact of IT industry
    As industry development is very dynamic, even several months lag between the
    reports results in substantial difference in figures.
    191.8 thousand persons as of end-2019 according to DOU estimates (41)
    (compared to 159.7 thousand in 2018)
    192.1 thousand persons according to the State of European Tech Report 2019
    by Atomico.
    Unofficial estimates are very close to official data if number of employees is
    combined active private entrepreneurs. IT Ukraine Association, BRDO, Forbiz,
    EU4Business (2018) (42) compared DOU estimates (127 thousands in 2017)
    with official data for employees (46 thousands) and private entrepreneurs (94
    thousand total, but when liquidated individual entrepreneurs are excluded, 80
    thousand persons remains)
    SSSU gives slightly higher numbers: 201 thousand as of end-2018 in IT (both
    individual entrepreneurs and official employees)
    Number of specialists that work in IT sphere in non-IT companies
    This issue is not covered in the literature and is impossible to receive from official statistical
    sources. 4% of DOU sample work in non-IT companies.
    Types of specialists by maturity level
    Based on the online survey of 9387 respondents, DOU presents results for Ukraine overall.
    Similar distributions of IT specialists are also available in cluster reports.

    View Slide

  41. By Cerulean Industries
    01
    41
    Gender type
    As in previous question, data is provided by DOU and cluster reports DOU survey reports
    that there are 24% (46) of women in IT. They usually start career as quality assurance,
    developers, testers, designers, and non-technical jobs such as HR, PR, and Sales. 11% of
    developers and 38% of testers and project managers are women.
    Language skills, soft skills
    10% of angel investors are women according to the State of European
    Tech Report 2019 by Atomico
    Kharkiv cluster reports 28% of women, 72% of men in IT, while Lviv figures
    constitute 34% and 66% respectively in 2019
    Data on English knowledge is usually based on DOU survey as well. It is self-reported by IT
    specialists:
    These figures are hard to compare with data from other countries.
    Therefore, comparison is usually based on English proficiency index (47) , though it is for
    the country overall, not for the ICT sector. In this index Ukraine is classified as a country with
    low proficiency (rank 49) and is placed just after Belarus and Russia, compared to high
    proficiency in Hungary and Romania and very high proficiency in Poland.
    Ukrainian software developers are culturally close to European and American partners and is
    usually considered as strength (48) of Ukraine. More peculiarities are described by NIX (49).
    46 DOU, 2019. Portrait of IT specialist in 2019. Infographics.
    47 Education First. English Proficiency Index.
    48 Agile Engine, 2018. Top outsourcing destinations to watch in 2018
    49 Serheichuk, N., 2019. An honest look at Ukrainian software developers: cross-cultural communication in outsourcing, Ni-X
    2.1.1 Specialists
    Human capital in IT: market overview

    View Slide

  42. By Cerulean Industries
    01
    50 Kharkiv IT Cluster., PricewaterhouseCoopers Advisory., 2019. Kharkiv IT Research.
    51 IT Dnipro Community., Sociological Agency Fama, 2019. IT Dnipro Research 2019.
    52 Lviv IT Cluster, 2017. Economic impact of IT industry
    In addition, IT Ukraine Association, BRDO, Forbiz, EU4Business (2018) gave more aggregate
    classification in 2017:
    Developers 53%
    QA/QC testers 15%
    Non-technical professions
    (HR, PR, Sales) 6%
    Other technical
    Professions 5%
    System administrators 3%
    Business analysts 3%
    Designers 3%
    DOU, Ukraine Total
    Software Development -
    56.8%,
    Quality Assurance - 23.2%,
    business analysts - 2.5%,
    Project Management - 7.9%,
    Kharkiv (50)
    Software Development 45.2%
    Quality Assurance 13.8%
    Other technical staff 7.1%
    Other non-technical staff
    19.7%
    Project management 7.6%,
    Top-level Management 6.7%
    Dnipro (51)
    Software Development
    48,3%,
    Quality Assurance 18,7%,
    Other technical staff 4.6%
    Other non-technical staff
    15.9%
    Project Management
    Specialist10,6%,
    Top-level Management 2%,
    Lviv (52)
    Engineers (software engineer, quality assurance etc.) 74%
    Other staff (project managers, business analysts, designers) 15%
    Administrative staff (HR, PR, legal) 10%
    Service personnel (cleaners, security men, etc.) 1%
    Types of professions in IT sector and percent of various professions in IT
    The table below summarizes available data on the structure of IT processions in Ukraine
    overall and regional perspective as well.
    Main programming language
    JavaScript 28,3%
    Java 16,2%
    C#/.NET 15,6%
    PHP 13,0%
    Python 6,2%
    C++ 3,7%
    Swift 3,6%
    Kotlin 3,4%
    Ruby 2,2%
    Go 1,6%
    Other 6,3%
    SQL 60%
    JavaScript 45%
    Java 32%
    C# 28%%
    C++ 27%%
    Python 26%
    PHP 21%
    Node.js 16%
    Android/Kotlin 7%
    Objective-C/Swift 4%
    Golang 4%
    Ruby 3%
    Scala 2%
    Assembly 1%
    Other 5%
    Java 59%
    C++ 59%
    JavaScript 51%
    C57%
    C# 55%
    PHP 48%
    Python 45%
    TypeScript 45%
    Pascal / Delphi 39%
    T-SQL 35%
    PL-SQL 33%
    Ruby 21%
    Objective-C 20%
    Kotlin 16%
    Swift 16%
    The most popular
    programming languages
    among
    IT specialists in Lviv
    JavaScript 71%
    C++ 47.8%
    Java 47.5%
    C# 44.7%
    Python 43.4%
    42
    2.1.2 Professions
    Human capital in IT: market overview

    View Slide

  43. By Cerulean Industries
    01
    53 DOU, 2019. Labour market in 2019: 20% growth and hype over taxes.
    54 Ott M., Tymchenko O., 2020. Who to be: who are employers looking for and what specializations do students
    choose? (in Ukrainian) VoxUkraine
    55 DOU, 2020. Where, how and how much: we analyze hiring of juniors in 2019 (in Ukrainian).
    Ott and Tymchenko (54) (2020) based on Jooble, report 136 275 vacancies in IT in 2019
    (35% of total number), though as Jooble aggregates vacancies across job search websites,
    double counting of vacancies is not excluded.
    Front End 7 062
    QA 6312
    PHP 3979
    .NET 3837
    Java 3514
    Marketing 2654
    DevOps 2501
    Project Manager 2270
    Design 2246
    Analyst 2043
    Python 1995
    Node.js 1854
    Sales 1697
    HR 1621
    Support 1383
    C++ 1365
    iOS/macOS 1238
    Other 1226
    Number of university graduates, employed by IT sector
    DOU reports 5047 vacancies per month in 2019 (53) , total of 60570 vacancies in 2019,
    growing 9% year-on-year.
    Android 1067
    SysAdmin 934
    Data Science 917
    Ruby 837
    Product Manager 689
    DBA 547
    React Native 492
    Unity 413
    ERP/CRM 395
    Golang 393
    Embedded 384
    Technical Writer 339
    Security 273
    SEO 241
    Scala 234
    1С 234
    Blockchain 85
    Data is not available
    DOU estimates 191.8 thousand people as of end-2019 (compared to 159.7 thousand in
    2018). Share of juniors estimated at 27% in 2019, 26% in 2018 which corresponds to 51.8
    and 41.5 thousand respectively.
    DOU also surveyed 55 IT companies regarding employment of juniors in 2019 (55). Overall
    these companies hired 5370 junior level specialists. Large Companies hire juniors through
    their own free educational programs.
    43
    2.1.3 Demand
    Human capital in IT: market overview

    View Slide

  44. By Cerulean Industries
    01
    Amount of switchers
    This issue is not covered in the literature
    Remote work of UA workforce for international companies
    This issue is not covered in the literature
    Remote work of International workforce for Ukrainian companies
    This issue is not covered in the literature
    44
    Source: IT Ukraine Association as reported in Hlova M., 2018. Legal aspects of outsourced software development in Ukraine: Key
    highlights , Ni-X. Amount of foreign workforce attracted
    Migration of IT specialists and numbers of their return
    This issue is poorly covered in the literature
    2.1.3 Demand
    Human capital in IT: market overview

    View Slide

  45. By Cerulean Industries
    01
    Lack of non-technical professionals, like sales, marketing, business analysis
    and management specialists.
    High competition for top class IT-specialists leads to significant increase in
    senior employee compensation.
    Staff shortage is still tangible. Huge flow of people went into the IT industry
    creating a pay gap between the junior and senior level specialists.
    Limited practical knowledge and skills hinder the school to transition.
    Kharkiv cluster mention outflow of talented students abroad.
    Cooperation of universities with corporate IT varies between regions. Cluster
    reports emphasize the need for dual education so that students could gain
    practical knowledge at the workplace.
    Increase in labor cost – the rates are gradually reaching the cost of
    development in the countries of Eastern Europe.
    Big companies are aggressively growing. Entrance of large companies into the
    market will redistribute the market and these companies will poach the best
    specialists. Small IT-companies and startups experience challenges with
    attracting and retaining top talents due to limited financial resources at the
    beginning of their business life cycle.
    Obsolete labour legislation restricts hiring of professionals, forcing companies
    to use subcontractors instead; additionally, it limits the transition of students to
    the work environment, impedes internship opportunities and prevents
    professionals from teaching at universities.
    01
    List of challenges in human capital in IT
    45
    2.1.4 Challenges
    Human capital in IT: market overview

    View Slide

  46. By Cerulean Industries
    01
    01
    2.2.1 General numbers
    Education market overview
    Amount of universities, preparing technical personnel
    In 2018 there were 143 universities preparing professionals (bachelors, specialists,
    masters) in IT specializations, based on open database of territory education graduates of
    Ministry of Education of Ukraine.
    46

    View Slide

  47. By Cerulean Industries
    01
    Amount of universities, preparing technical personnel
    Relevant tech specializations also include physics and mathematics from natural sciences
    and automation and computer-integrated technologies. Other tech specializations may also
    be relevant, like electronics, applied mechanics, etc, but to less extent. Full list of
    specializations can be found in the list of specializations approved by the Cabinet of
    Ministers of Ukraine (56)
    Specializations
    IT specializations include
    Information Technology
    121
    122
    123
    124
    125
    12
    Software engineering
    Computer science and information
    technology
    Computer Engineering
    System analysis
    Cybersecurity
    Natural sciences
    104
    105
    Physics and astronomy
    Applied physics and nanomaterials
    10
    Mathematics and
    statistics
    111
    112
    113
    11
    Math
    Statistics
    Applied Mathematics
    Automation and
    instrumentation
    151
    Automation and computer-integrated
    technologies
    15
    47
    2.2.1 General numbers
    Education market overview
    56 Cabinet of Ministers of Ukraine, 2015. On approval of the list of specialties and specializations for the training of higher
    education students. Resolution 266 Viewed April 3, 2020.
    http://vnz.org.ua/zakonodavstvo/101-perelik-galuzej-znan-i-spetsialnostej

    View Slide

  48. By Cerulean Industries
    01
    Applied Mathematics
    Software engineering
    Computer science and information technology
    Computer Engineering
    Automation and computer-integrated technologies
    Total Junior Specialist
    179
    2 503
    739
    2 485
    1 353
    7 259
    113
    121
    122
    123
    151
    Junior specialist
    Physics and astronomy
    Applied physics and nanomaterials
    Math
    Statistics
    Applied Mathematics
    Software engineering
    Computer science and information technology
    Computer Engineering
    System analysis
    Cybersecurity
    Automation and computer-integrated technologies
    Total Barchelor
    839
    413
    1 243
    86
    743
    2 724
    5 240
    3 033
    397
    33
    2 637
    17 388
    104
    105
    111
    112
    113
    121
    122
    123
    124
    125
    151
    Bachelor
    Physics and astronomy
    Applied physics and nanomaterials
    Math
    Applied Mathematics
    Software engineering
    Computer science and information technology
    Computer Engineering
    System analysis
    Cybersecurity
    Automation and computer-integrated technologies
    Total
    3
    11
    38
    9
    140
    192
    162
    15
    78
    5
    653
    104
    105
    111
    113
    121
    122
    123
    124
    125
    151
    Specialist
    Physics and astronomy
    Applied physics and nanomaterials
    Math
    Statistics
    Applied Mathematics
    Software engineering
    Computer science and information technology
    Computer Engineering
    System analysis
    Cybersecurity
    Automation and computer-integrated technologies
    Total
    374
    417
    473
    95
    771
    1 438
    4 214
    1 969
    590
    938
    4
    11 283
    104
    105
    111
    112
    113
    121
    122
    123
    124
    125
    151
    Master
    Total IT
    Total
    26 890
    36 583
    48
    Number of graduates general and per each specialization
    2.2.1 General numbers
    Education market overview

    View Slide

  49. By Cerulean Industries
    01
    Number of IT courses (not in universities, private initiatives and corporate Academia)
    Total number is not presented in the literature
    Number of prepared students of courses
    The number of IT schools is growing with 43K+ graduates per year.
    49
    2.2.1 General numbers
    Education market overview

    View Slide

  50. By Cerulean Industries
    01
    46
    2.2.2 Stakeholder map in education
    Education market overview
    50

    View Slide

  51. By Cerulean Industries
    01
    2.3.1 Comparing industry demand with
    existing supply (quality and quantity)
    Existing gaps analysis
    There is a significant mismatch between
    education and labour market needs in
    Ukraine. Ukraine is among the most educated
    societies in the world with a tertiary gross
    enrolment ratio (GER) of 83% (2014,
    UNESCO). At the same time analysis of
    vacancies in Jooble by Ott and Tymchenko
    (57)(2020) shows that 82% of vacancies do
    not require higher education.
    Mismatch is present in specializations of
    higher education as well and it also concerns
    IT sector. Ott and Tymchenko (2020)
    compare Jooble vacancies with application
    to higher education. Number of vacancies in
    IT (136 275) was 3 times higher than
    applications to IT education (39908).
    There is a labor shortage of both IT and
    non-IT specialists due to a rapid industry
    growth.
    Number of vacancies increased by 30% in
    2019. However, this gap cannot be filled just
    with a higher number of graduates.
    Market participants admit, that there is a
    huge inflow of people into the IT industry
    that stopped salary growth at junior level. In
    2018 the number of graduates in IT (not
    including math and other tech education)
    was at around 24 thousand at the level of
    bachelor and higher (if math is included this
    number increases to 27 thousand), compared
    to total number of junior level IT specialist,
    that was at 51.8 thousand in 2019.
    51
    updated curriculum
    academic integrity
    more cooperation of universities with the
    corporate sector in terms of curriculum
    and internships/first jobs. Some of the
    clusters mention
    dual education as a possible solution as
    well.
    At the same time, there is still a significant
    shortage of middle level and senior
    specialists.
    As a result, the wage gap between junior and
    senior level widens.
    Further increase in IT education should
    match industry development. IT education
    exceeds the growth of industry and
    graduates are not able to find jobs at junior
    level, they will hardly become senior level
    employees in the IT industry. More likely they
    will work in another specialization or even at
    another level of qualification requirements.
    Another issue is quality of education, that
    includes:
    57. Ott M., Tymchenko O., 2020. Who to be: who are employers looking for and what specializations do students choose?(in
    Ukrainian) VoxUkraine.

    View Slide

  52. Country Niches for USP
    Positioning and Go-to-
    Market Strategy
    3. 1
    Specialization
    3
    3. 2
    Regional distribution

    View Slide

  53. By Cerulean Industries
    01
    Ukrainian IT companies primarily specialize in data management, telecommunications,
    cloud, gaming, e-commerce, media, fintech, healthcare, and others.
    Most of the reports (AVentures Capital & Ukraine Digital News 2016, National investment
    council of Ukraine 2018, Ni-X 2019) provide the same breakdown of almost 150 largest
    companies of Ukrainian IT industry by sub-sectors. This breakdown is based on the report
    by Ukraine Digital News "High Tech Ukraine From A To Z" as of 2015.
    According to this data, most popular sub-sectors include Data management
    (accounting for about 18%), Telecoms (13%), Cloud (12,5%), Gaming (11%), E-
    commerce (11%), Media (8%), Finance (8%), etc.
    53
    3.1.1 Vertical: percent of companies doing
    projects in various verticals
    (FinTech, Agrotech, Adtech, Spacetech, etc)
    Specialization
    Besides, AVentures Capital & Ukraine Digital News (2016) provides data on R&D
    subsidiaries of global companies working in Ukraine. They span many industries, with
    gaming, software, telecommunications and e-commerce being the most represented
    industry types in terms of number of employed IT professionals.
    AVentures Capital & Ukraine Digital News (2016) also lists R&D developers that work in
    certain sub-sectors:
    Source: AVentures Capital & Ukraine Digital News, 2016. National investment council of Ukraine, 2018.

    View Slide

  54. By Cerulean Industries
    01
    There are also specialized reports on Game Development in Ukraine, Agritech, MarTech,
    Fintech, though it is hard to relate them to the total structure of companies in IT.
    USAID Financial Sector Transformation Project, UNIT.City (2018) provides information
    about participants of the FinTech ecosystem of Ukraine. According to it, there are about
    80 providers active in the market. Based on the survey results for 59 FinTech providers of
    Ukraine, it specifies different FinTech Categories, with Payments & Money transfers
    accounting for 32% of all respondents, Infrastructure – 19%, Lending – 14%. Report on
    MarTech states that there are 160 companies and 5000+ employees, $130M of disclosed
    investments.
    54
    3.1.1 Vertical: percent of companies doing
    projects in various verticals
    (FinTech, Agrotech, Adtech, Spacetech, etc)
    Specialization
    Source: AVentures Capital & Ukraine Digital News, 2016.

    View Slide

  55. By Cerulean Industries
    01
    01
    There is no data on percent of companies having cross-specialization on international
    trends.There are reports on AI, AR/VR, Blockchain, but they are mostly focused on mapping.
    3.1.2 International trends: percent of companies
    having cross-specialization on international
    trends (AI, AR/VR, Robotics, etc).
    Specialization
    55

    View Slide

  56. By Cerulean Industries
    01
    Distribution of legal entities.
    According to UNIT.City and StrategEast, 2019. Innovative Ukraine, around 50% of the IT-
    related legal entities are registered in Kyiv. Also a lot of the companies reside in Kharkiv
    (7.5%), Dnipro (6%), Lviv (5%) and Odesa (4.5%).
    Distribution of IT specialists.
    DOU survey of the Ukrainian IT professionals demonstrates that 67% of Ukrainian IT
    specialists live in Kyiv, Kharkiv, and Lviv: Kyiv (37%), Kharkiv (14%), and Lviv (15%).
    IT clusters.
    Most reports provide information on major regional IT clusters in Ukraine (National
    investment council of Ukraine 2018, UNIT.City and StrategEast 2019, AVentures Capital &
    Ukraine Digital News 2016).
    According to UNIT.City and StrategEast, 2019. Innovative Ukraine, there are 16 IT clusters
    in Ukraine, the most significant of which are located in Lviv, Kharkiv, Kyiv, Dnipro, Lutsk,
    Ivano-Frankivsk, Chernigiv, Cherkasy. Lviv IT Cluster is the largest in Ukraine, uniting over
    80 members.
    However, the information about members of IT Clusters is outdated and some of the
    NGOs, related to clusters mentioned here are not active at the moment (Odesa IT
    Cluster).
    There is a good overview of Lviv, Kharkiv, Dnipro. Kyiv is well covered in general reports.
    Data on other regions is scarce.
    3.2.1 Share of each region in each element of
    ecosystem structure
    Regional distribution
    56

    View Slide

  57. By Cerulean Industries
    01
    57
    Source: National investment council of Ukraine, 2018
    3.2.1 Share of each region in each element of
    ecosystem structure
    Regional distribution
    AVentures Capital & Ukraine Digital News (2016) maps regional distribution of most popular
    locations in Ukraine for opening an international R&D center. According to the report,
    Ukraine houses over 100 R&D centers of global companies, half of them are in Kyiv. Chief
    among other major cities with high concentrations of R&D centers are Dnipropetrovsk (15
    centers), Lviv (15), Odessa (13), Kharkiv (11) and Vinnytsia (6).

    View Slide

  58. By Cerulean Industries
    01
    3.2.1 Share of each region in each element of
    ecosystem structure
    Regional distribution
    Source: AVentures Capital & Ukraine Digital News, 2016.
    According to MarTech Made in Ukraine, 2019, Kyiv is a key location for martech (marketing
    technologies) companies with 68,4% of offices based here. Lviv 6.8%, Odesa 6.8%, Dnipro
    3.8%, Kharkiv 3%, Chernigiv 2.3%. Only 5% of martech companies have their offices outside
    of Ukraine. SaaS Nation, UNIT.City, Center42 Innovation Agency, 2019 explores the location
    of Ukrainian SaaS-companies’ R&D offices: Кyiv - 51%, Оdesa - 9.5%, Dnipro - 8.4%.
    58

    View Slide

  59. By Cerulean Industries
    01
    3.2.2 Smart specialization of regions
    Human capital in IT: market overview
    Not directly covered in the literature, scarce data is provided by clusters
    Most reposts provide descriptions of major regional IT destinations in Ukraine that usually include
    Kyiv, Lviv, Dnipro, Odesa, Kharkiv. Data on major characteristics of these regions (human capital,
    educational system, number of companies, clusters) are almost consistent among different
    reporters.
    Kyiv
    City
    40,000 specialists in the IT
    outsourcing sector, which
    is 46.6% of all resources in
    Ukraine
    Human
    capital
    38+ universities and
    colleges that prepare
    future IT professionals
    Educational
    system
    52+ Software
    outsourcing firms with
    80+ employees
    52+ International R&D
    centers Kyiv IT Cluster
    Number of IT
    companies
    Lviv 20,000 qualified IT
    software developers - 10%
    of the Ukrainian IT
    resources
    10 colleges and 7 higher
    technical educational
    establishments.
    Currently, more than
    12,000 IT specialists are
    studying in Lviv. Around
    5,000 engineers
    graduate from Lviv
    educational institutions
    every year
    More than 192 IT
    companies
    32 Software
    outsourcing firms with
    80+ employees
    14 International R&D
    centers
    Lviv IT Cluster
    22,000 specialists work in
    the software development
    sector - 16.2% of all IT
    resources in Ukraine
    5 Universities with
    technology and
    engineering faculties
    35 Software
    outsourcing firms with
    80+ employees
    11 International R&D
    centers
    Kharkiv IT Cluster
    8,000 technical specialists,
    which constitutes 5.5% of
    the Ukrainian IT talent pool
    10+ Universities and
    colleges with technical
    education
    150 IT companies
    (approximately half of
    them are IT service
    providers and the other
    half are software
    publishers)
    28 Software
    outsourcing firms with
    80+ employees
    23 International R&D
    centers
    Odesa IT Cluster
    Around 9,000 IT or 7.9% of
    all Ukrainian IT resources
    5+ Universities and
    colleges with technical
    education, 17,000
    technical graduates
    More than 44 software
    vendors
    44 Software
    outsourcing firms with
    80+ employees
    14 International R&D
    centers
    IT Dnipro Community
    Kharkiv
    Odesa
    Dnipro
    Source: UNIT.City, StrategEast, 2019. Innovative Ukraine 59

    View Slide

  60. By Cerulean Industries
    01
    60
    3.2.2 Smart specialization of regions
    Human capital in IT: market overview
    IT Dnipro research, 2019 and Kharkiv IT research 2019 surveyed the IT provided details on IT
    companies specialization in this region:

    View Slide

  61. By Cerulean Industries
    01
    Methodology and uncovered needs for a comprehensive
    report of the IT Sector in Ukraine and key criteria for
    comparing Ukrainian IT Sector with other countries
    Despite a large number of reports, in many cases, the data on critical elements of the
    ecosystem is lacking or has significant drawbacks, including questionable sources,
    outdated information, or only regional covering of several clusters with no country
    perspective. Reсiting of unreliable data from one report to another misleads market
    participants and stakeholders. Based on our research we identified the following areas
    which lack sufficient data:
    Ecosystem mapping with key stakeholders on each segment
    Data on the size and structure of the local IT services market: available data on the local
    market is scarce, contradictory and outdated
    Biggest consumers of IT on the local market: partial, contradictory and outdated data
    Structure of exported IT products and services in 2019: fragmented and very scarce data
    Number of companies registered in Ukraine: Official data is not representative as one
    company often combines several legal entities, while experts’ estimates vary substantially
    Number of companies operating in Ukraine but not officially registered as legal entity
    Share of foreign companies in the Ukrainian IT sector
    Legal types of companies and share of each type
    Types of companies by business model: Data is based on the survey of IT specialists
    (which company you work for), not clear whether the sample is representative
    Structure of companies by the number of employees: fragmented cluster data is available,
    but there is no updated data on companies by size for Ukraine overall
    There is a big difference on what usually reported in market overviews as R&D and what is
    state statistics on R&D and a need to agree on a definition
    Size of investments in R&D in IT is also hard to measure and needs to be further
    investigated
    Profit Structure: Data on profit and profit structure of each type of Ukrainian IT companies
    is not covered in the literature
    Taxes: Overall estimates are up to date, but details are not revealed, cluster estimates
    made by two companies (FAMA, PwC) give a more detailed overview
    Structure of salaries: Data is based on the survey of IT specialists, but the
    representativeness of the sample is not guaranteed
    Salary growth trends in the last and coming years by category/position: No data on
    coming years in the reports
    Reliable data on investments structure (local vs foreign): Data vary between two sources
    Types of investors and investor map: Maps are not complete
    Data on infrastructure, required for IT companies to operate well: not available
    The number of specialists that work in the IT sphere in non-IT companies is not presented
    in the literature and is impossible to receive from official statistical sources
    The number of university graduates employed by IT sector: data on school to work
    transition for IT specialists is scarce, it is not known whether all IT graduates with IT
    specializations can find a job in the IT sector, how many graduates leave the country, etc.
    Migration of IT specialists is poorly covered in the literature
    Amount of switchers
    Remote work of UA workforce for international companies
    Remote work of international workforce for Ukrainian companies
    Share of companies doing projects in various verticals (FinTech, Agrotech, Adtech,
    Spacetech, etc): fragmented and partial data 61

    View Slide

  62. By Cerulean Industries
    01
    Methodology and uncovered needs for a comprehensive
    report of the IT Sector in Ukraine and key criteria for
    comparing Ukrainian IT Sector with other countries
    Cross-specialization of companies in modern technology (AI, AR/VR, Robotics, etc): data
    is not available. There are reports on AI, AR/VR, Blockchain, but they are mostly focused
    on mapping
    Share of each region in each element of ecosystem structure. There is a good overview of
    Lviv, Kharkiv, Dnipro. Kyiv is well covered in general reports. Information on other regions
    is scarce
    Smart specialization of regions. Not directly covered in the literature, scarce data is
    provided by clusters
    All global segments need to be analyzed
    surveys of IT companies and IT specialists,
    experts interviews;
    desk research.
    The data missing is crucial for the understanding of ecosystem needs.
    Thorough further research is required to cover existing gaps in the data needed for
    informed policy-making.
    This research should include:
    The next step is to compare Ukrainian tech ecosystem to its peers based on conceptual
    framework and key elements presented in the ecosystem map of this report. In addition,
    international experience should be studied.
    Literature on startup ecosystems is developing, evaluation of policies and impact of
    ecosystem elements is sporadic and rare.
    Comprehensive literature review is required.
    61

    View Slide

  63. By Cerulean Industries
    01
    References (p.1)
    1. AEQUO, IDC, Baker Tilly, SiBiS, 2017. Information technology industry in Ukraine. Infographic
    atlas. Viewed 20 May 2020, https://businessviews.com.ua/ru/get_file/id/the-infographics-report-it-
    industry-of-ukraine-2017.pdf?
    fbclid=IwAR3feJDsxAIMubNi_ruEiQPSEtsHZRRqnHtP2a5VTfx28Y_gnkcjCqVWflo
    2. Agile Engine, 2018. Top outsourcing destinations to watch in 2018 Viewed 3 April, 2020.
    https://agileengine.com/top-outsourcing-destinations/
    3. Association of Industrial Automation of Ukraine (APPAU), 2020. Landscape Industry 4.0 in Ukraine.
    76 pages. Viewed 3 Apr. 2020, https://industry4-0-ukraine.com.ua/landscape/#firstPage
    4. AVentures Capital., 2016. The Deal Book of Ukraine. Ultimate report about Ukrainian Startup and
    Venture scene. 2016 Edition. 128 pages. Viewed 3 Apr. 2020,
    https://inventure.com.ua/upload/library/ua_dealbook_2016.pdf
    5. AVentures Capital., 2018. The Dealbook of Ukraine. Ultimate report on Ukraine’s Venture
    Investment IT Industry. 32 pages. Viewed 3 Apr. 2020,
    https://www.slideshare.net/YevgenSysoyev/the-dealbook-of-ukraine-2018-edition
    6. AVentures Capital., 2019. DealBook of Ukraine. 2019 edition.26 pages. Viewed 3 Apr. 2020,
    https://www.slideshare.net/YevgenSysoyev/aventures-dealbook-2019-145451367
    7. AVentures Capital, 2020. DealBook of Ukraine. 2020 edition. 22 pages. Viewed 3 Apr. 2020,
    https://www.slideshare.net/YevgenSysoyev/aventures-dealbook-2020-229990810
    8. AVentures Capital & Ukraine Digital News, 2016. IT Ukraine. IT services and software R&D in
    Europe’s rising tech nation. Version 1.11. 251 pages. Viewed 3 Apr. 2020,
    http://www.uadn.net/files/ua_hightech.pdf
    9. AVentures, Aventis Capital, Capital Times, 2019. Software development in Ukraine, Poland, Belarus
    and Romania. 191 pages. Viewed 3 Apr. 2020, https://software-development-cee-report.com/
    10. Blockchain Association of Ukraine, 2019. Overview of the Blockchain Industry in Ukraine. 40
    pages. Viewed 3Apr2020, https://www.slideshare.net/DarinaMatkovska/overview-of-the-blockchain-
    industry-in-ukraine-145284361
    11. Boyland P., 2019. The State of mobile network experience. Benchmarking mobile on the eve of
    the 5G revolution. Opensignal. Viewed 3 Apr 2020, https://www.opensignal.com/sites/opensignal-
    com/files/data/reports/global/data-2019-05/the_state_of_mobile_experience_may_2019_0.pdf
    12. BRDO, 2019. 900 MHz band use expands 4G coverage throughout Ukraine within 1.5 year.
    Viewed 3 Apr 2020, https://en.brdo.com.ua/news/900-mhz-band-use-expands-4g-coverage-
    throughout-ukraine-within-1-5-years/
    13. Capital times, 2020. Tech M&A Report 2019. 23 pages. Viewed 3 Apr. 2020, https://www.capital-
    times.com/global_ma_trends_in_the_it_industry_2019?
    utm_source=pr&utm_medium=pressa&utm_campaign=global_ma_trends_in_the_it_industry_2019&
    utm_content=article&utm_term=ma_report#form
    14. Cheney, David Warren; Zolotarev, Andrey P.; Wyne, Jamil Uzair; Aridi, Anw, 2017. Ukraine -
    Innovation and entrepreneurship ecosystem diagnostic (English). Washington, D.C. : World Bank
    Group. 60 pages. http://documents.worldbank.org/curated/en/126971509628933853/Ukraine-
    Innovation-and-entrepreneurship-ecosystem-diagnostic
    15. Cirera, Xavier; Frias, Jaime Andres Uribe; Zolotarev, Andrey P.; Aridi, Anwar, 2017. Ukraine -
    Science, technology, and innovation public expenditure analysis (English). Washington, D.C. : World
    Bank Group. 43 pages http://documents.worldbank.org/curated/en/314581509695378056/Ukraine-
    Science-technology-and-innovation-public-expenditure-analysis
    16. CompTIA, 2019. IT Industry Outlook 2020. Taking the Next Step. Viewed 3 Apr 2020,
    https://comptiacdn.azureedge.net/webcontent/docs/default-source/research-reports/comptia-it-
    industry-outlook-2020.pdf?sfvrsn=8869ad68_0
    17. DOU, 2019a. Labour market in 2019: 20% growth and hype over taxes. (in Ukrainian). Viewed 3
    Apr. 2020, https://dou.ua/lenta/articles/jobs-and-trends-2019/?from=doufp
    18. DOU, 2019b. Portrait of IT specialist in 2019. Infographics. (in Ukrainian). Viewed 3 Apr. 2020,
    https://dou.ua/lenta/articles/portrait-2019/
    63

    View Slide

  64. By Cerulean Industries
    01References ( p.2)
    19. DOU, 2020. Where, how and how much: we analyze hiring of juniors in 2019 (in Ukrainian).
    Viewed 6 May 2020, https://dou.ua/lenta/articles/juniors-2019/?from=doufp
    20. EastWest Digital news, 2018. Startup Investment & Innovation in Emerging Europe. 2018 Edition.
    Version1 – February2018. The first-ever comprehensive startup research on 24 countries of Central
    and Eastern Europe PART 4: LOCAL LANDSCAPES. 240 pages. Viewed 3 Apr. 2020,
    https://cee.ewdn.com/
    21. European Business Association (EBA), PricewaterhouseCoopers (PwC). 2016. Export-oriented
    segment if Ukraine’s IT services market: Status quo and prospects. 34 pages. Viewed 3 Apr. 2020,
    https://eba.com.ua/static/export_it_industryfinal_29092016.pdf
    22. Guceri, Irem; Zolotarev, Andrey P.; Aridi, Anwar, 2017. Ukraine - Fiscal incentives for science,
    technology and innovation activities : good practice review report (English). Washington, D.C. :
    World Bank Group. 49 pages.
    http://documents.worldbank.org/curated/en/928361509629258438/Ukraine-Fiscal-incentives-for-
    science-technology-and-innovation-activities-good-practice-review-report
    23. HiTech office (2016). Цифрова адженда України – 2020. Концептуальн засади (верс я 1.0).
    Першочергов сфери, н ц ативи, проекти «цифров зац ї» України до 2020 року. 90pages.
    Viewed 3 Apr. 2020, https://ucci.org.ua/uploads/files/58e78ee3c3922.pdf
    24. Hlova M., 2018. Legal aspects of outsourced software development in Ukraine: Key highlights ,
    Ni-X. Viewed 3 April 2020, https://www.n-ix.com/legal-aspects-outsourced-software-development-
    ukraine-key-highlights/
    25. Innolytics Group, SingularityU Kyiv Chapter, Unit City and DLA Piper, 2018. Ukraine in the Global
    Innovation Dimension Report 2007-2017. 77 pages. Viewed 3 Apr. 2020,
    http://www.singularityukyiv.com/wp-content/uploads/2018/05/UReport_final-version_1.pdf
    26. InvestUkraine, 2018. Invest in Ukraine Now: Innovation and Opportunities.
    27. IT Ukraine., BRDO, 2018. Зелена книга «Регулювання ринку розробки програмного
    забезпечення». 44 стор нки. Переглянуто 3 кв тня 2020,
    https://cdn.regulation.gov.ua/af/2a/db/8b/regulation.gov.ua_Green%20Book_Software%20Develop
    ment%20Market_BRDO.pdf
    28. IT Ukraine Association, BRDO, Forbiz, EU4Business, 2018. Development of Ukrainian IT industry
    2018: analytical report 68 стор нок. Переглянуто 3 кв тня 2020,
    https://en.brdo.com.ua/development-ukrainian-industry-2018-analytical-report/
    29. Kirilenko A. and Tyshchuk T., 2018. From Legacy to Digital: Ukraine’s Plugged-in Economy.
    Atlantic Council Eurasia Center. Issue brief. 16pages. Viewed 3 Apr. 2020,
    https://atlanticcouncil.org/wp-content/uploads/2018/04/Ukraine_IT_FINAL.pdf
    30. Lobova O., Sudolskiy R., 2018. Game Development in Ukraine, Industry Guide. Achievers Hub,
    UNIT.City. 11 pages. Viewed 3Apr. 2020, https://42.unit.city/gamedev/guide2018
    31. MarTech Made in Ukraine, 2019. Marketing and Adverising Technologies created in Ukraine. 36
    pages. Viewed 3 Apr. 2020, https://42.unit.city/martech-guide-2019
    32. Ministry of Economic Development and Trade. Digital Agenda for Ukraine. 18pages. Viewed 3
    Apr. 2020, http://www.e-ukraine.org.ua/media/Lviv_Minich_2.pdf
    33. Ministry for Development of Economy, Trade and Agriculture of Ukraine, 2019. Export strategy
    Information Technology Sector 2019-2023. 94 pages. Viewed 3 Apr. 2020,
    https://www.me.gov.ua/Documents/Download?id=bd1f27f5-de0e-42da-8591-946ed0967603
    34. National Investment Council of Ukraine, 2018. IT industry of Ukraine: Creating value on the
    global scale. 34 pages. Viewed 3 Apr. 2020, https://www.slideshare.net/OfficeNIC/invest-in-ukraine-
    it-sector
    35. Nikandrov D. and Goncharuk V. , 2020. Artificial Intelligence in Ukraine v 1.0. Ukraine: Ministry of
    digital transformation of Ukraine, 9 pages.
    36. Ni-X, 2019. Ukraine the Country that Codes. IT Industry in Ukraine. 2019 Market Report. 29
    pages. Viewed 3 Apr. 2020, https://s3-eu-west-1.amazonaws.com/new.n-
    ix.com/uploads/2019/09/26/Software_development_in_Ukraine_2019_2020_IT_industry_market_re
    port.pdf 64

    View Slide

  65. By Cerulean Industries
    01 References ( p.3)
    37. Novchai V., Koriavets M., Kulchytskyi I., Oleksiuk L., Pryhodko O., Gorohovskyi K., Gryga V.,
    2018. Problems and perspectives of harmonization of Ukrainian digital market with EU and
    Eastern Partner states (in Ukrainian). Viewed 3 Apr. 2020, https://www.civic-synergy.org.ua/wp-
    content/uploads/2018/04/Problemy-ta-perspektyvygarmonizatsiyi-tsyfrovogo-rynku-Ukrayinyz-
    rynkamy-YES-ta-krayin-ShP.pdf
    38. Ott M., Tymchenko O., 2020. Who to be: who are employers looking for and what
    specializations do students choose?(in Ukrainian) VoxUkraine. Viewed 6 May 2020,
    https://voxukraine.org/uk/kim-buti-kogo-shukayut-robotodavtsi-ta-yaki-spetsialnosti-obirayut-
    studenti/
    39. SaaS Nation, UNIT.City, Center42 Innovation Agency, 2019. SaaS industry in Ukraine 2019:
    Key trends and tech companies, operating on a subscription business model. 26 pages. Viewed
    3 Apr. 2020, https://drive.google.com/open?id=1-B89iTPaGzbOcdE_wZu6051X7CmHg64O
    40. Serheichuk, N., 2019. An honest look at Ukrainian software developers: cross-cultural
    communication in outsourcing, Ni-X, Viewed 3 April, 2020. https://agileengine.com/top-
    outsourcing-destinations/
    41. Sensoramalab, Unit.City, 2019. VR-AR in Ukraine, Market Map. Viewed 3 Apr. 2020,
    http://xr.unit.city/vr-ar-market-map/
    42. Single state web portal of open data, 2020. Ministry of education and science, data sets (in
    Ukrainian). Viewed 3 Apr. 2020, https://data.gov.ua/organization/ministerstvo-osvity-i-nauky-
    ukrayiny
    43. Stanković, Mirjana; Aridi, Anwar. 2017. Ukraine - Intellectual property and technology
    transfer regulatory review (English). Washington, D.C. : World Bank Group. 50 pages.
    http://documents.worldbank.org/curated/en/133701509628796923/Ukraine-Intellectual-
    property-and-technology-transfer-regulatory-review
    44. State Statistical Service of Ukraine (SSSU), 2019a. Communication subscribers as of January
    1, 2019 http://www.ukrstat.gov.ua/operativ/operativ2019/zv/az/az_e/az0119_e.htm
    45. State Statistics Service of Ukraine(SSSU), 2019b. Input-Output tables at basic prices 2017.
    (in Ukrainian). Statistical digest. Viewed 3 Apr. 2020,
    http://www.ukrstat.gov.ua/druk/publicat/kat_u/2019/zb/05/zb_tvvoz2017xl.zip
    46. State Statistics Service of Ukraine(SSSU), 2019c. Scientific and innovation activity in Ukraine
    in 2018 (in Ukrainian). Statistical digest. Viewed 3 Apr. 2020,
    http://www.ukrstat.gov.ua/druk/publicat/kat_u/2019/zb/09/zb_nauka_2018.pdf
    47. Ukrainian Hi-Tech Initiative., 2012. Exploring Ukraine - IT outsorsing industry. 79 pages.
    Viewed 3 Apr. 2020, https://hi-tech.org.ua/wp-content/uploads/2012/08/Exploring-Ukraine-IT-
    Outsourcing-Industry-20121.pdf
    48. Ukrainian Venture Capital and Private Equity Association (UVCA), 2017. Investors Book. Who
    is who on the Ukrainian investment market. 45 pages. Viewed 3 Apr. 2020,
    https://www.slideshare.net/UVCA/uvca-investors-book-2017-who-is-who-on-ukrainian-
    investment-market
    49. Ukrainian Venture Capital and Private Equity Association (UVCA), Delloitte, 2020. Ukrainian
    venture Capital and Private Equity Overview 2019. 41 pages. Viewed 3 Apr. 2020,
    https://www2.deloitte.com/ua/en/pages/press-room/press-release/2020/investments-into-
    startups-2019.html
    50. Ukrainian Venture Capital and Private Equity Association (UVCA), Delloitte, 2019. Ukrainian
    venture Capital and Private Equity Overview. 41 pages. Viewed 3 Apr. 2020,
    https://www.slideshare.net/UVCA/ukrainian-venture-capital-and-private-equity-overview-2018-
    141626280
    51. UkraineInvest, 2018. 2nd Half 2018 REPORT. 18pp. Viewed 3 Apr. 2020,
    https://ukraineinvest.com/wp-content/uploads/2019/03/Ukraineinvest-2018-H2-report-ENG.pdf
    52. UkraineInvest, 2019. Ukraine NOW: efficient R&D and production hub. 12pages.
    53. UkraineInvest, 2019. Invest in Ukraine Now Innovation and Opportunities, 34 pages
    54. UkraineInvest, 2020. Ukraine's IT industry Overview. Ukraine: UkraineInvest, 18 pages. 65

    View Slide

  66. By Cerulean Industries
    01
    References ( p.4)
    55. UNIT.City., StrategEast., 2017. Innovative Ukraine. 29 pages. Viewed 3 Apr. 2020,
    https://www.strategeast.org/wp-content/uploads/2019/09/Innovative-Ukraine_web.pdf
    56. Unit.City Western, NIS Enterprise Fund (2019) Tech ecosystem guide to Ukraine. 61 pages.
    Viewed 3 Apr. 2020, https://data.unit.city/tech-guide/Tech_Ecosystem_Guide_To_Ukraine_En-
    1.1.pdf
    57. UNIT.City, 2017. Ukrainian Agritech Industry Guide. 8 pages. Viewed 3 Apr. 2020,
    https://data.unit.city/agritech/guide/f98ewf9fewfw/AgriTech_Industry_guide_ua.pdf
    58. United Nations Conference on Trade and Development (UNCTAD), 2015. International trade
    in ICT services and ICT-enabled services. Proposed Indicators from the Partnership on
    Measuring ICT for Development. UNCTAD Technical Notes on ICT for Development N˚3. Viewed
    3 April 2020, https://unctad.org/en/PublicationsLibrary/tn_unctad_ict4d03_en.pdf
    59. USAID Financial Sector Transformation Project, UNIT.City., 2018. Fintech in Ukraine: Trends,
    Market Overview and Catalogue. 40 pages. Viewed 3 Apr. 2020,
    https://data.unit.city/fintech/fgt34ko67mok/fintech_in_Ukraine_2018_en.pdf
    60. UVentures, 2018. The state of the UKR tech ecosystem the way forward.57pages.
    61. World bank. Fixed broadband subscriptions – Ukraine.World Development Indicators, The
    World Bank Group. Viewed 3 Apr 2020, https://data.worldbank.org/indicator/IT.NET.BBND?
    locations=UA
    Regional reports
    1. IT Dnipro Community, 2018. DNIPRO IT Industry overview. 21 pages.
    2. IT Dnipro Community., Sociological Agency Fama, 2019. IT Dnipro Research 2019. 42 pages.
    Viewed 3 Apr. 2020, https://www.slideshare.net/YevhenHostishchev/it-dnipro-research-2019
    3. FAMA sociological agency, 2019. IT Dnipro research, intermediate report (in Ukrainian). 17
    pages4. Kharkiv IT Cluster., PricewaterhouseCoopers Advisory., 2019. Kharkiv IT Research. 112
    pages.
    5. Lviv IT Cluster, 2017. Economic impact of IT industry. 45 pages. Viewed 3 Apr. 2020,
    https://itcluster.lviv.ua/en/research-2-0-ekonomichnyj-efekt-galuzi-lvova/
    6. Lviv IT Cluster, 2019. IT RESEARCH 4.0. 57 pages. Viewed 3 Apr. 2020,
    https://itcluster.lviv.ua/en/projects/it-research/#report
    International
    1. A.T..Kearney, 2019 Digital resonance: the new factor influencing location attractiveness. The
    2019 Kearney Global Services Location Index. Viewed 3 Apr. 2020,
    https://www.kearney.com/digital-transformation/gsli/2019-full-report
    2. Cornell University, INSEAD, and WIPO (2019); The Global Innovation Index 2019: Creating
    Healthy Lives—The Future of Medical Innovation, Ithaca, Fontainebleau, and Geneva.
    https://www.globalinnovationindex.org/gii-2019-report#
    3. Education First. English Proficiency Index. Ukraine. Viewed 3 Apr. 2020,
    https://www.ef.com/wwen/epi/regions/europe/ukraine/
    4. European Commission, 2019. EU Industrial Policy. 20 pages. Viewed 3 Apr. 2020,
    https://ec.europa.eu/commission/sites/beta-
    political/files/brochure_industrial_policy_euco13032019_0.pdf
    5. Elie Ofek, Margot Eiran, 2018. From Start-Up to Grown-Up Nation: The Future of the Israeli
    Innovation Ecosystem. Harvard Business School. 62 pages
    6. Good Country Index, https://www.goodcountry.org/index/results
    66

    View Slide

  67. By Cerulean Industries
    01References ( p.5)
    7. Education First. English Proficiency Index. Ukraine. Viewed 3 Apr. 2020,
    https://www.ef.com/wwen/epi/regions/europe/ukraine/
    8. IMD World Competitiveness Center, 2019. The IMD World Digital Competitiveness Ranking
    2019. Viewed 3 Apr. 2020https://www.imd.org/globalassets/wcc/docs/release-2019/digital/imd-
    world-dig ital-competitiveness-rankings-2019.pdf
    9. ICT Development Index 2017. Ukraine. Viewed 3 Apr. 2020 https://www.itu.int/net4/ITU-
    D/idi/2017/index.html#idi2017economycard-tab&UKR
    10. Portulans Institute (2019): Network Readiness Index 2019, Washington D.C., USA. Viewed 3
    Apr. 2020https://networkreadinessindex.org/
    11. Schwab K. (ed.), 2019. The Global Competitiveness Report 2019. Geneva: World Economic
    Forum. http://www3.weforum.org/docs/WEF_TheGlobalCompetitivenessReport2019.pdf
    12. StartupBlink, 2019. Startup Ecosystem Rankings Report 2019. 158 pages. Viewed 3 Apr.
    2020, https://www.startupblink.com/blog/startup-ecosystem-rankings-report-2019-by-
    startupblink/
    13. Startup Genome, 2019. Global Startup Ecosystem Report 2019. 199 pages. Viewed 3 Apr.
    2020, https://about.crunchbase.com/blog/startup-genome-report-2019/
    14. Ukrinform, 2020. Ukraine down in Bloomberg Innovation Index. Viewed 3 Apr. 2020,
    https://www.ukrinform.ua/rubric-economy/2859436-ukraina-opustilasa-v-rejtingu-innovacijnih-
    ekonomik-bloomberg.html
    67

    View Slide