Upgrade to Pro — share decks privately, control downloads, hide ads and more …

SymfonyCon June 2023 : Firefighting a Symfony &...

SymfonyCon June 2023 : Firefighting a Symfony & Elasticsearch app with Blackfire

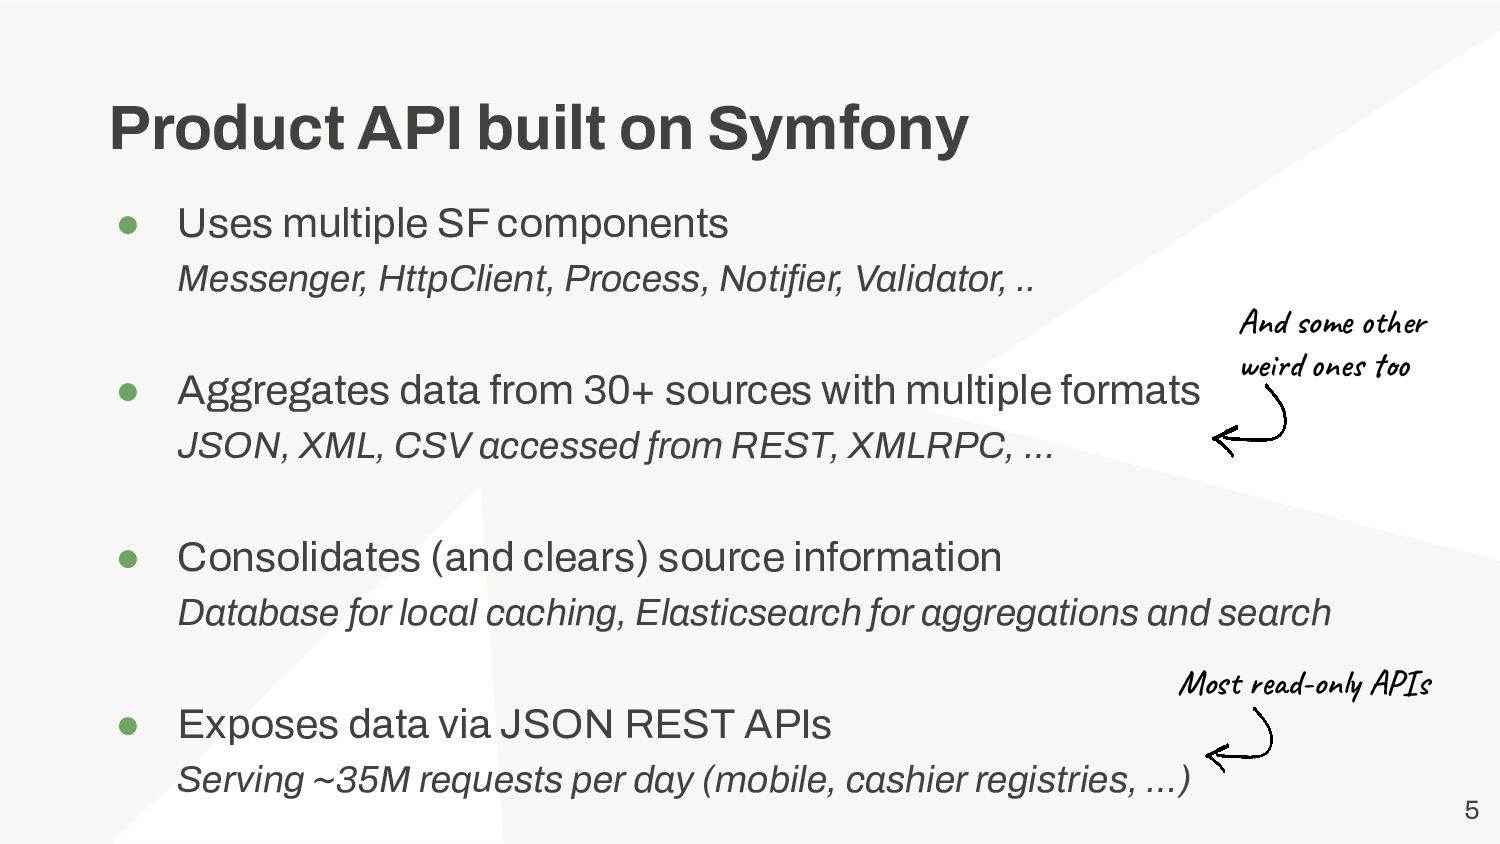
This talk will cover the journey and findings of firefighting a complex Symfony application (with Messenger, Serializer, Varnish, Redis, RabbitMQ, and Elasticsearch) with Blackfire.

The topics covered will be:
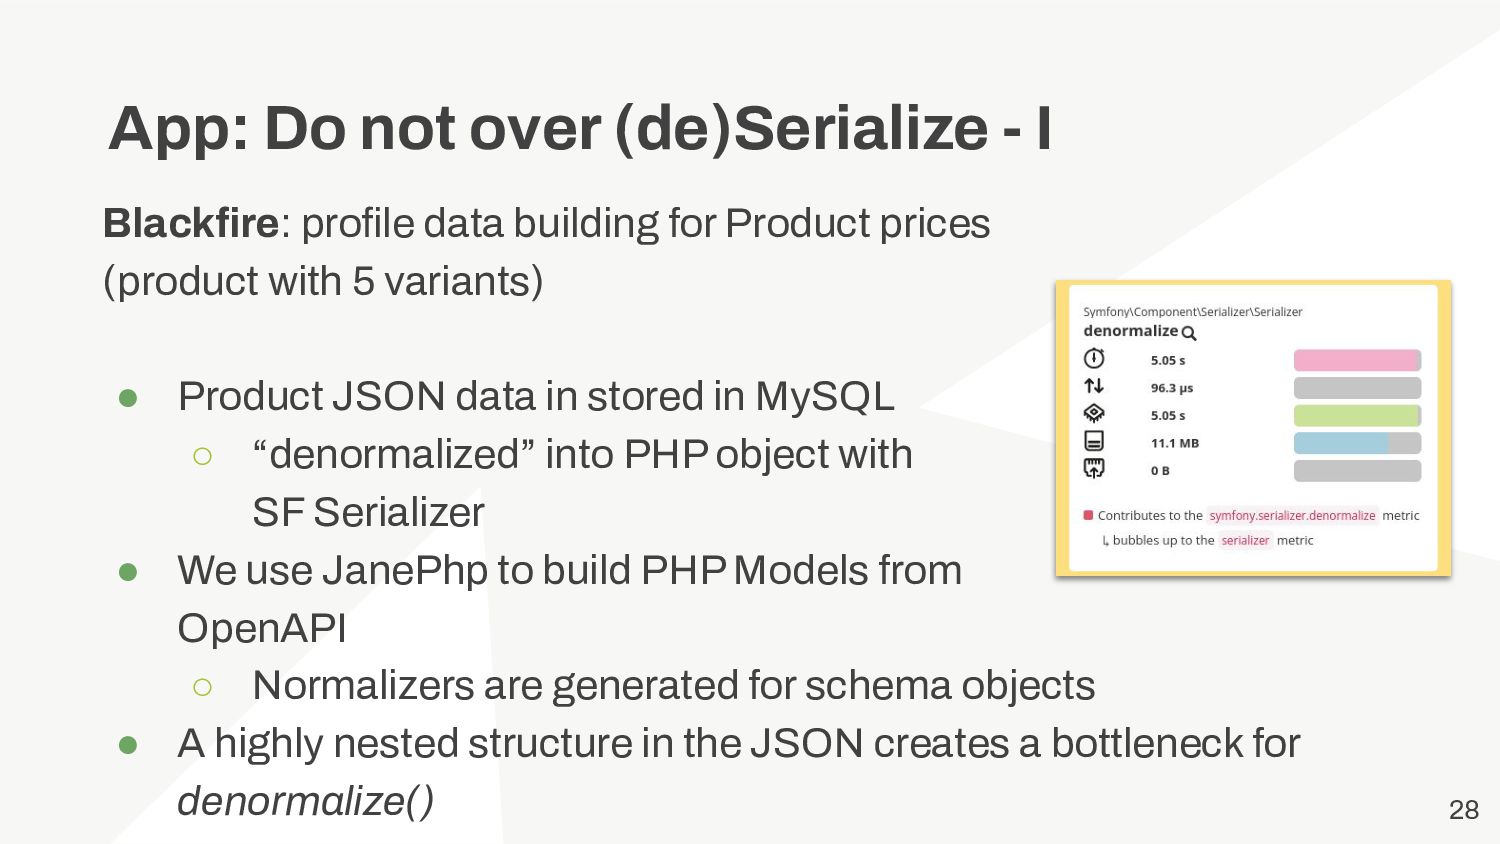
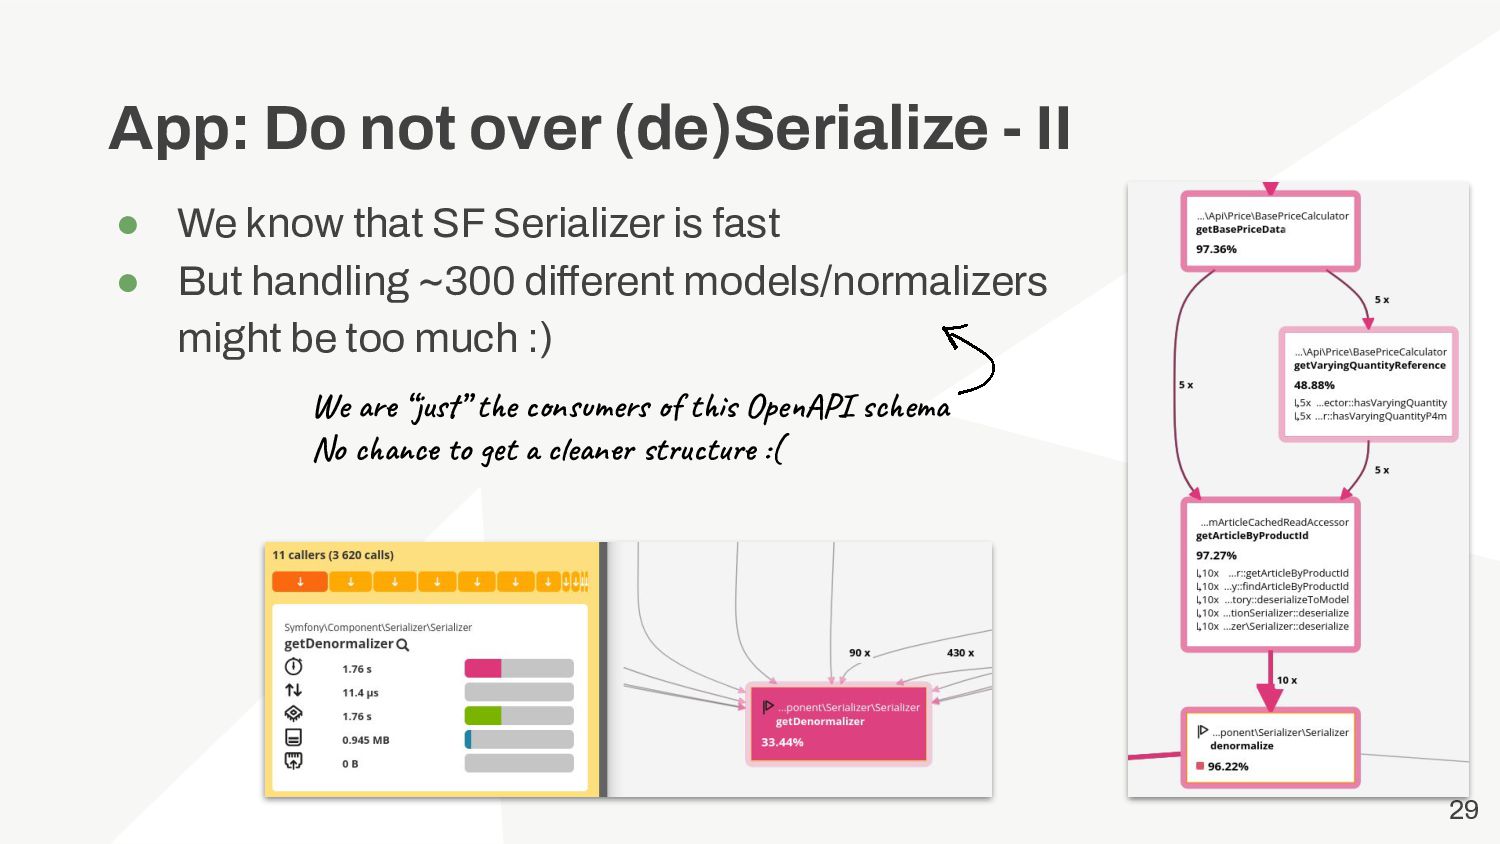
- Bottleneck within the Serializer
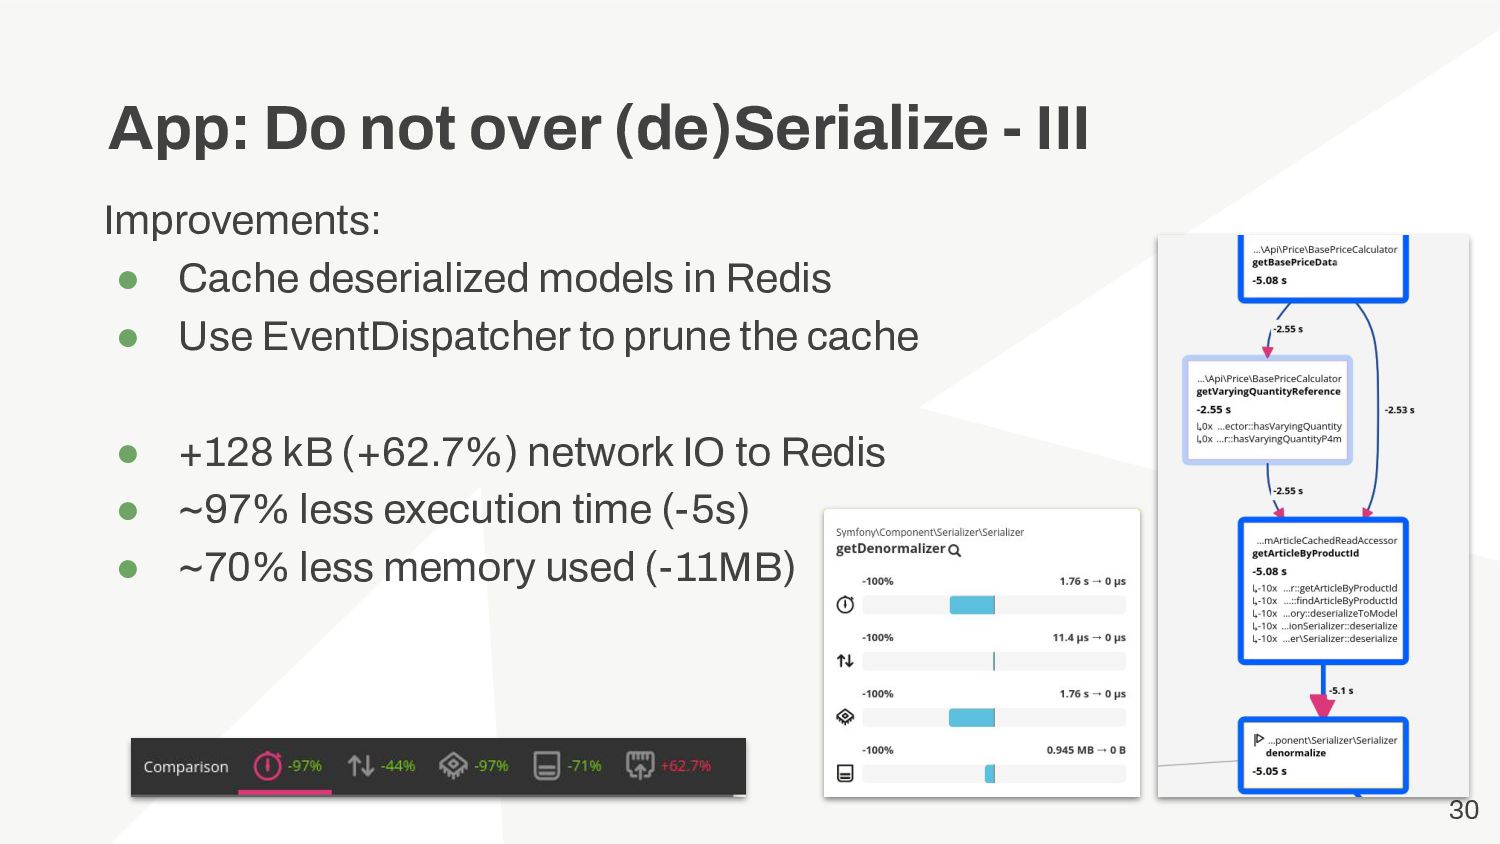
- Caching serialized object
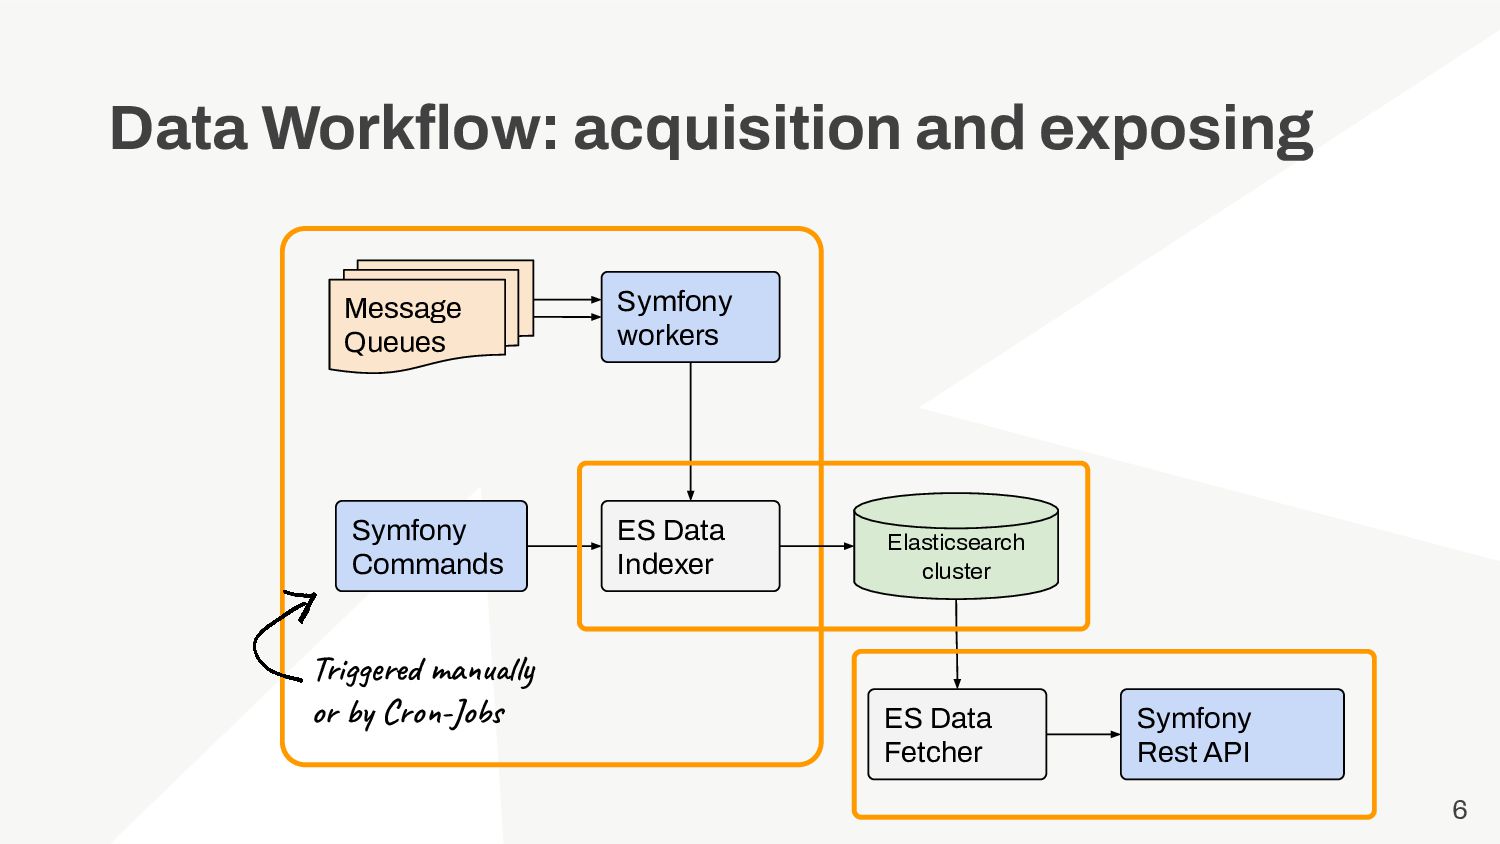
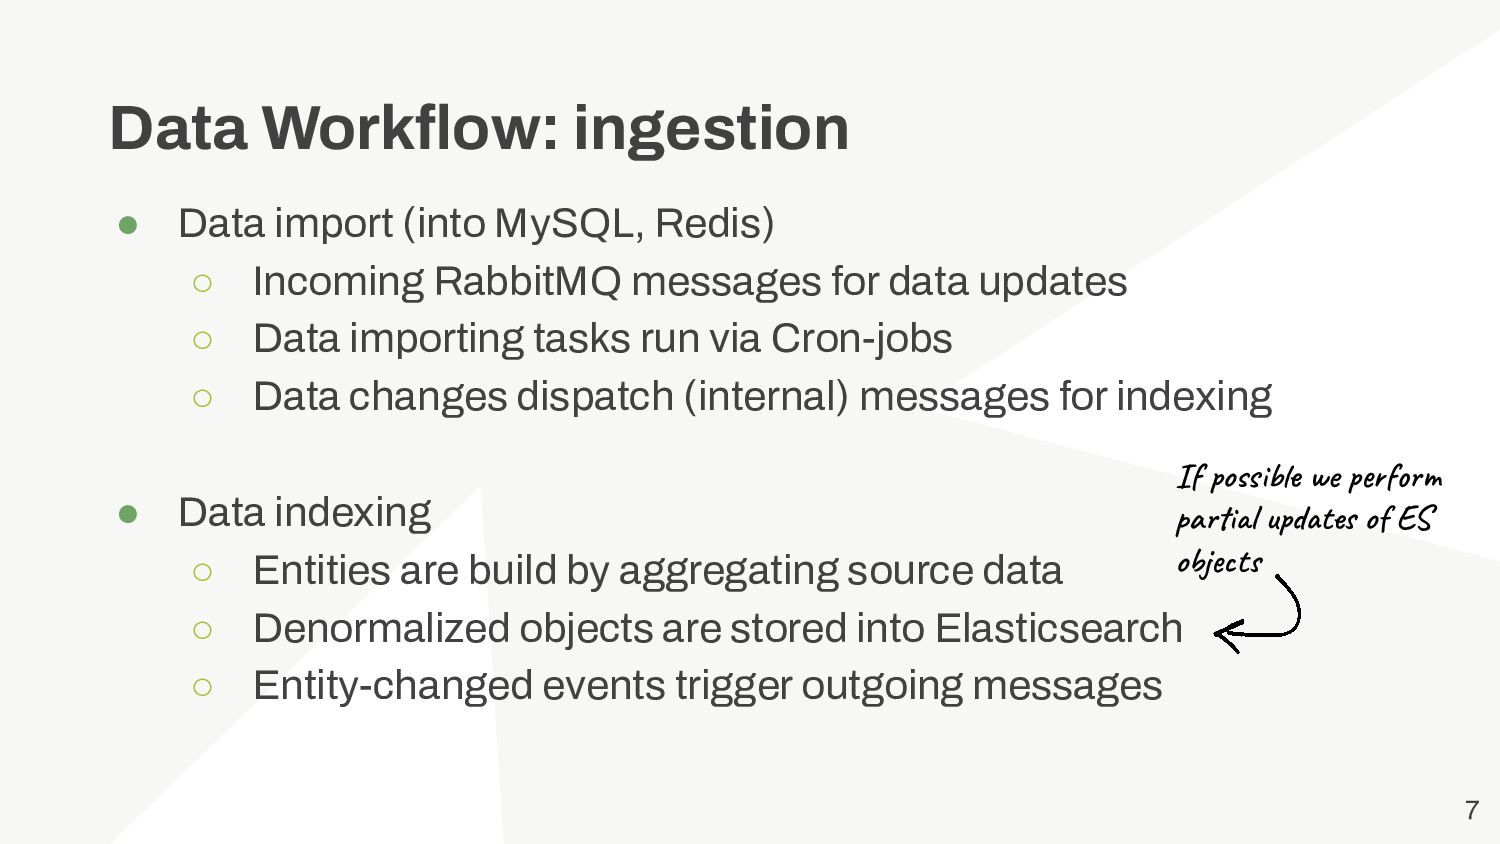
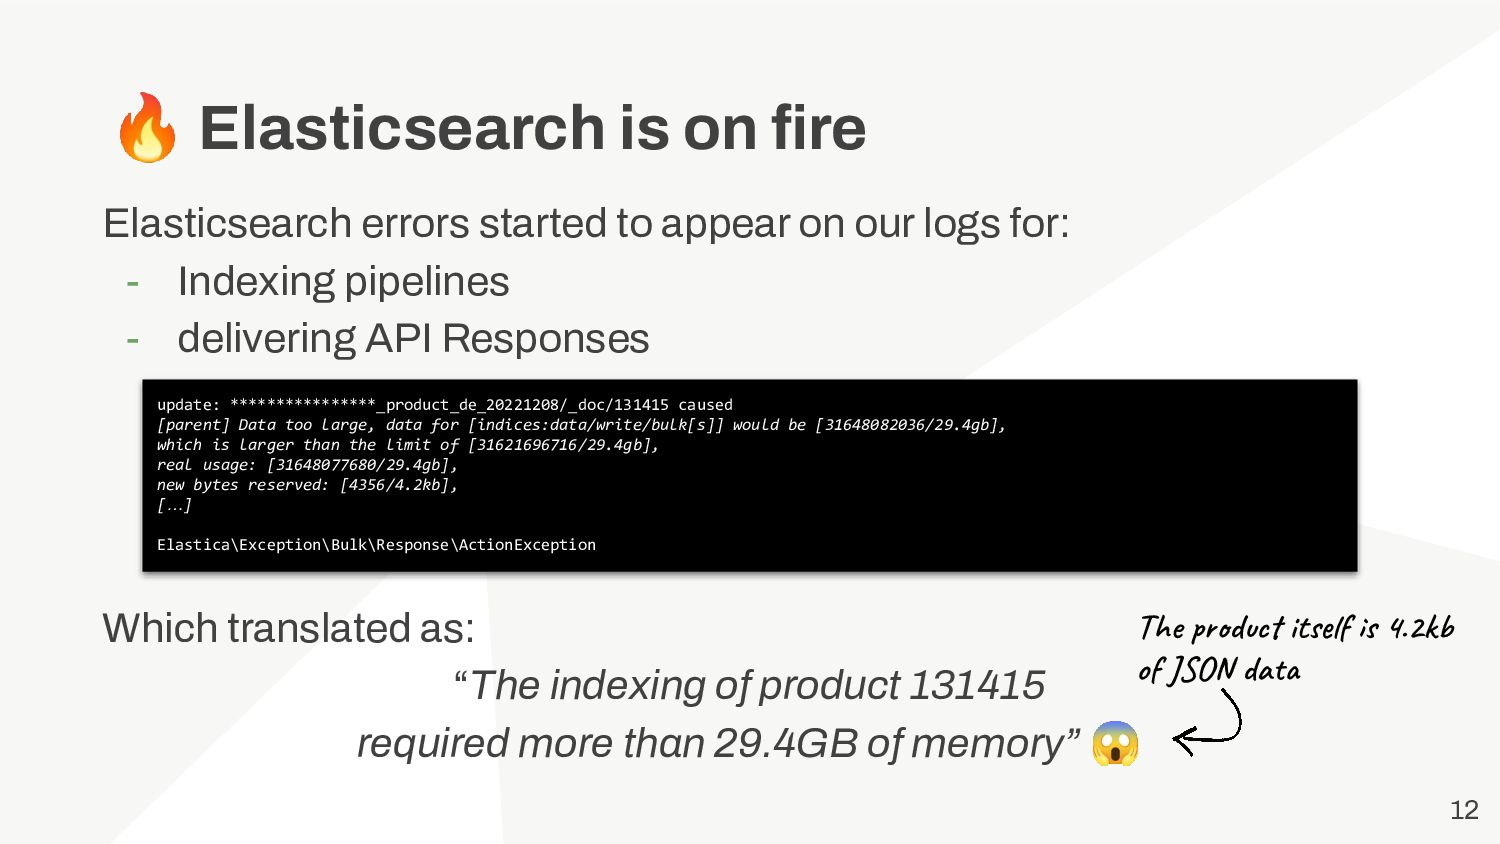
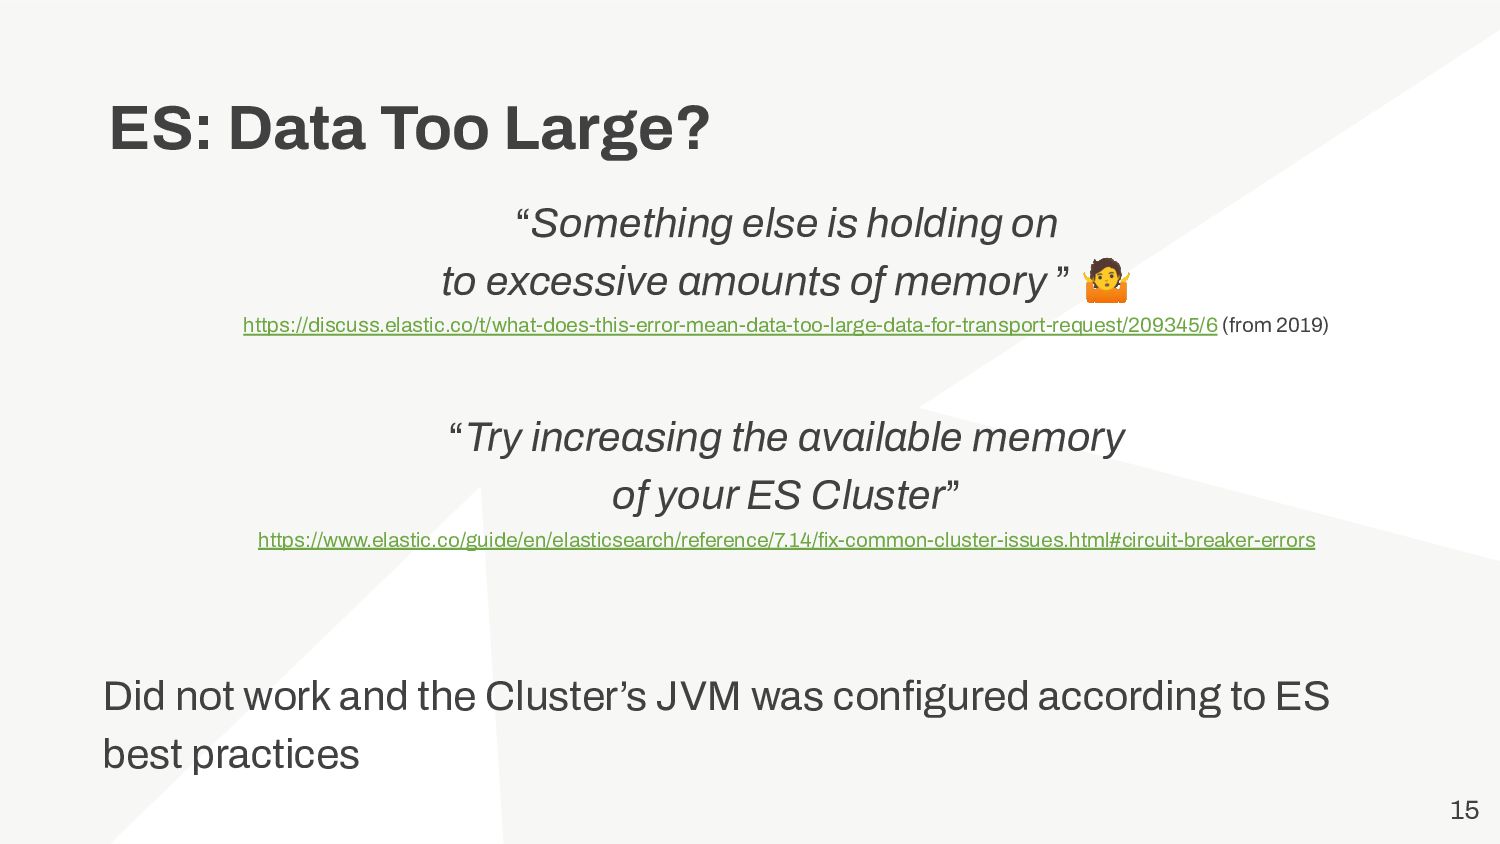
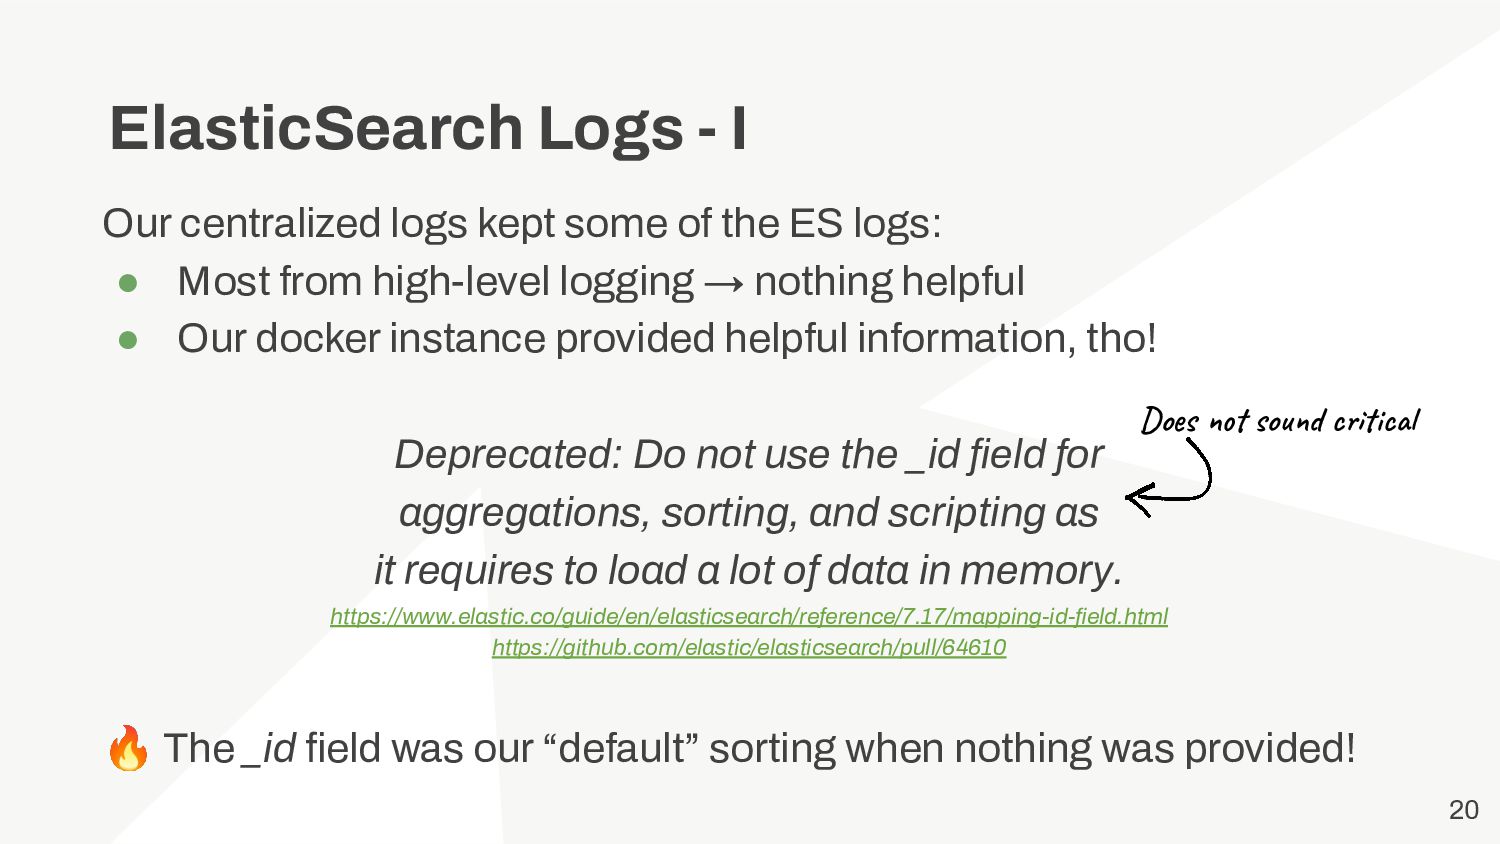
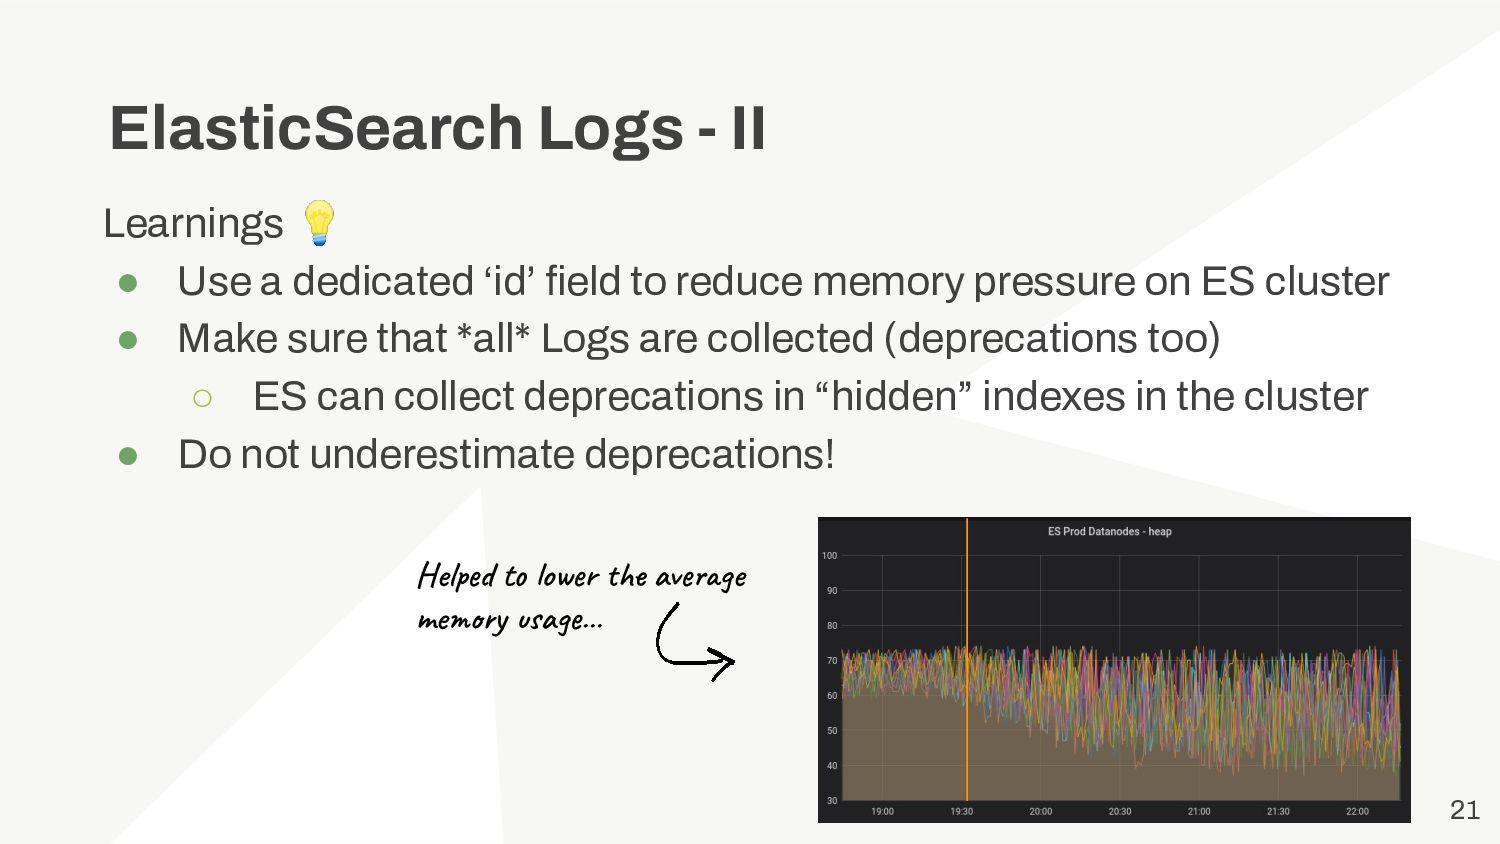
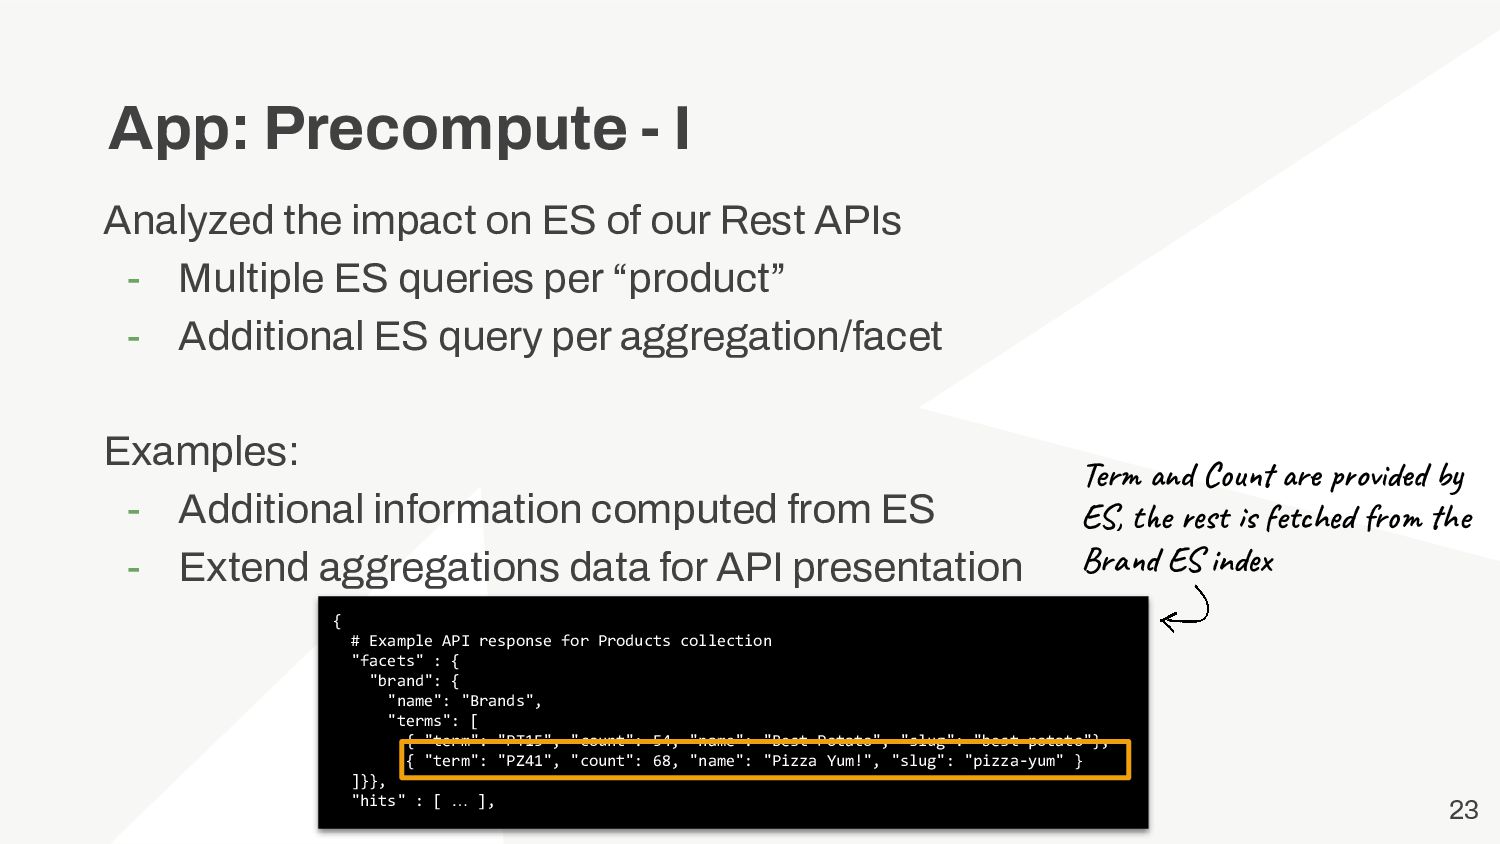
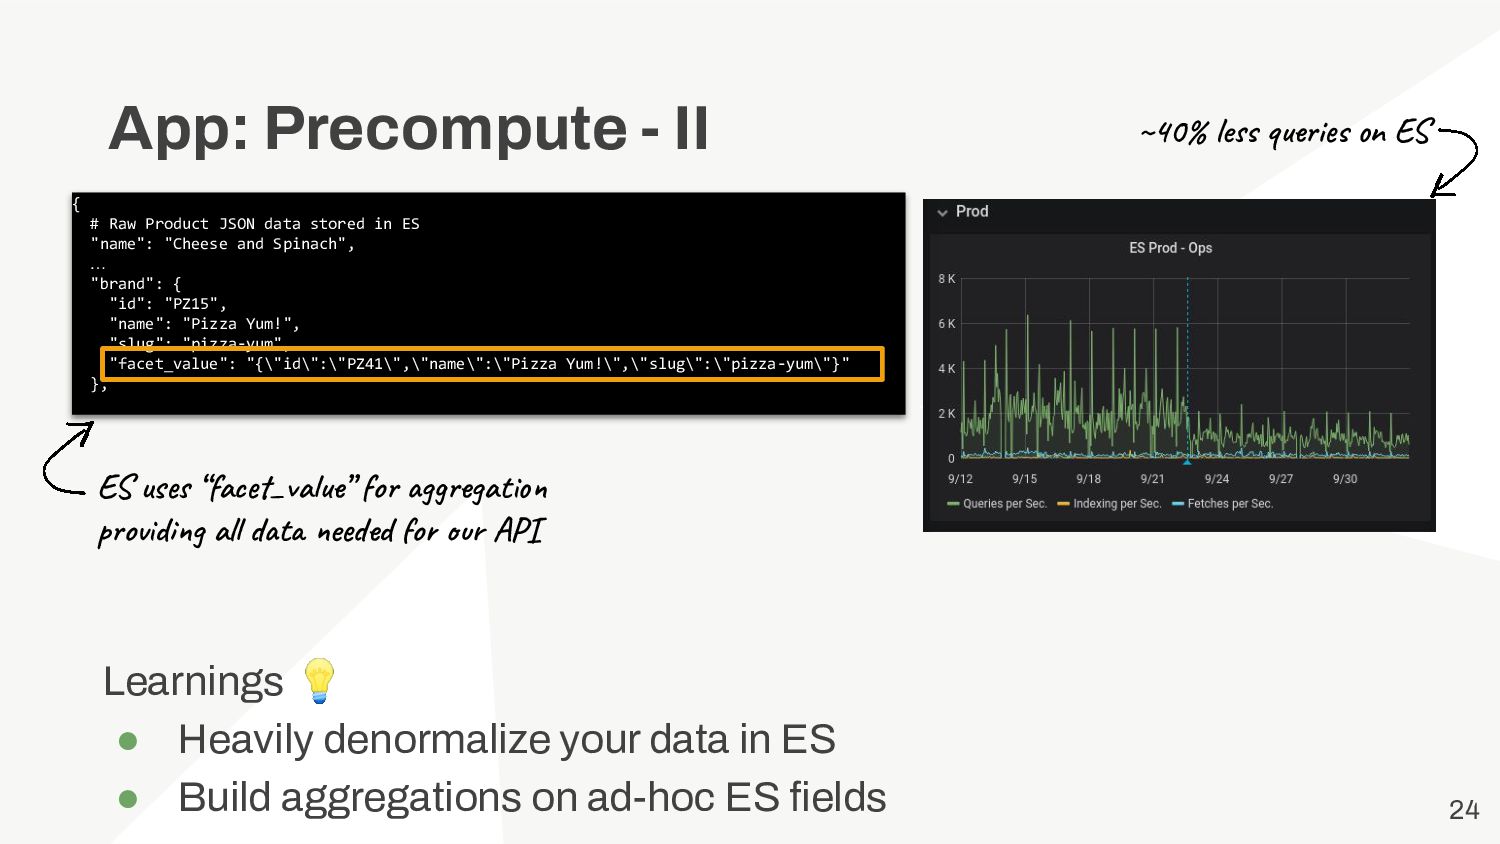
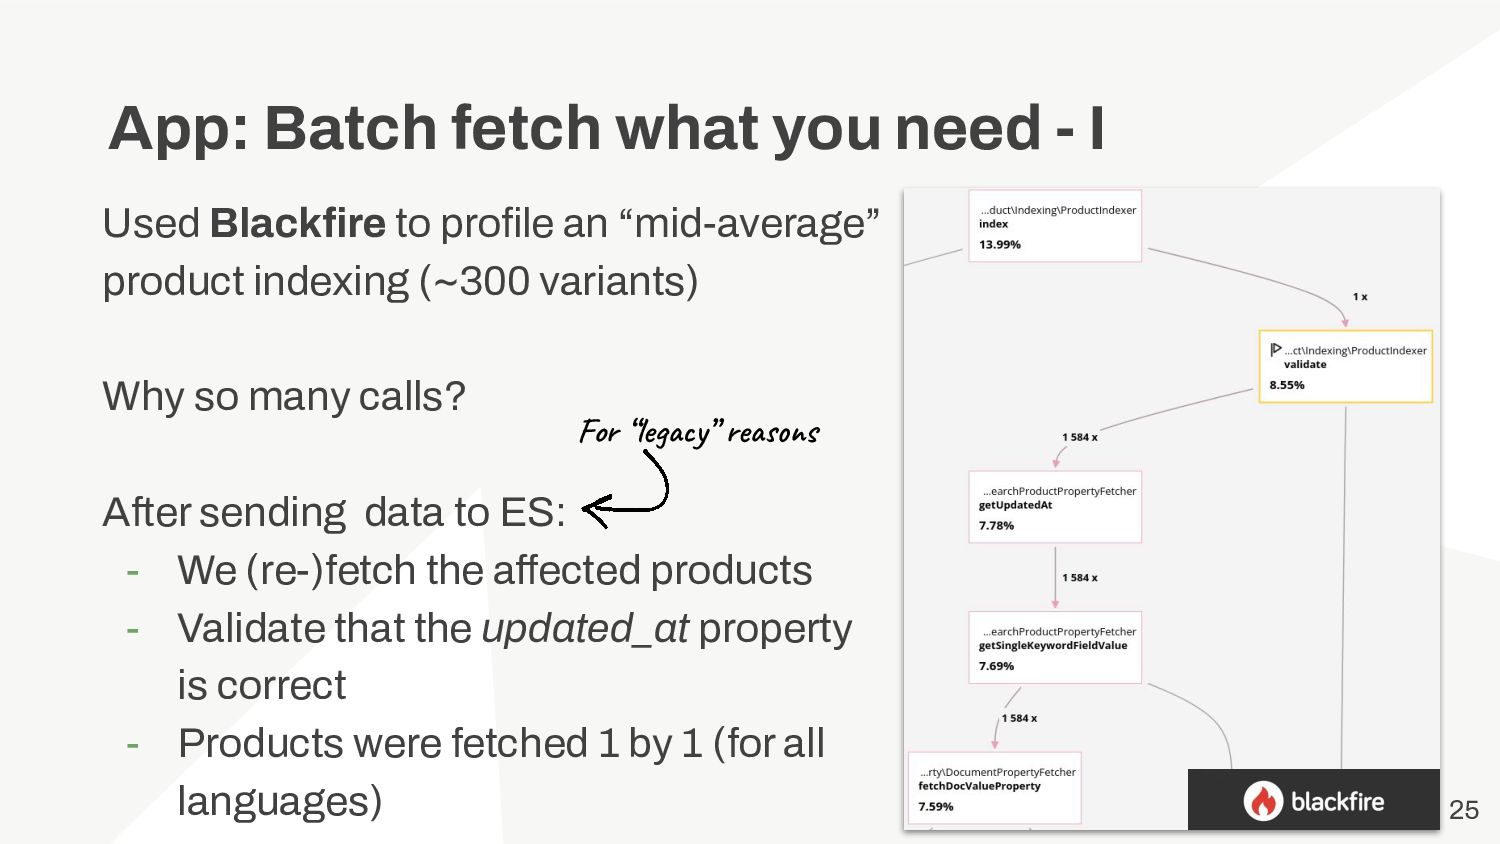
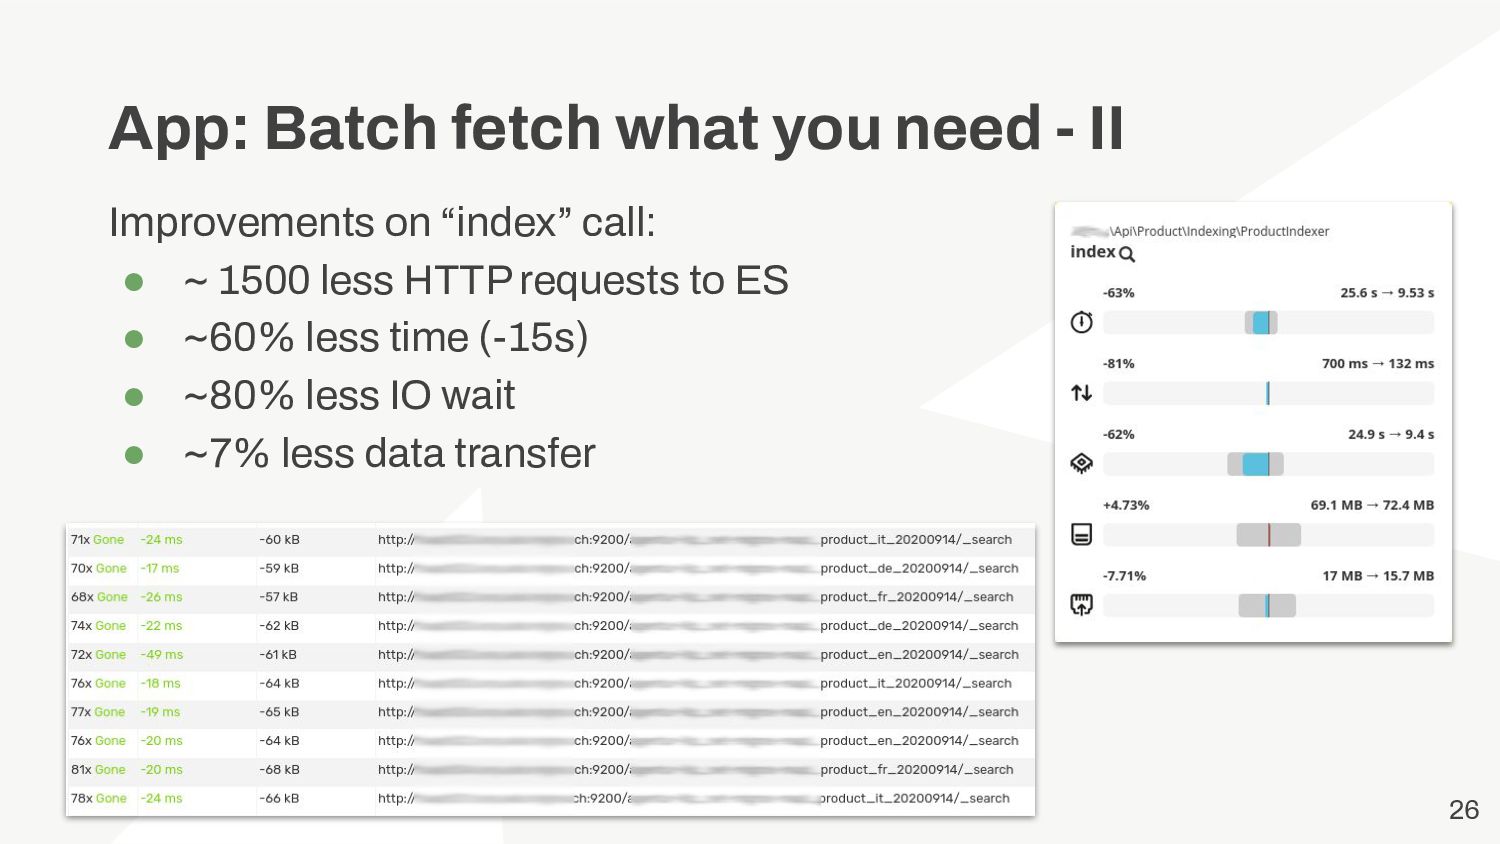
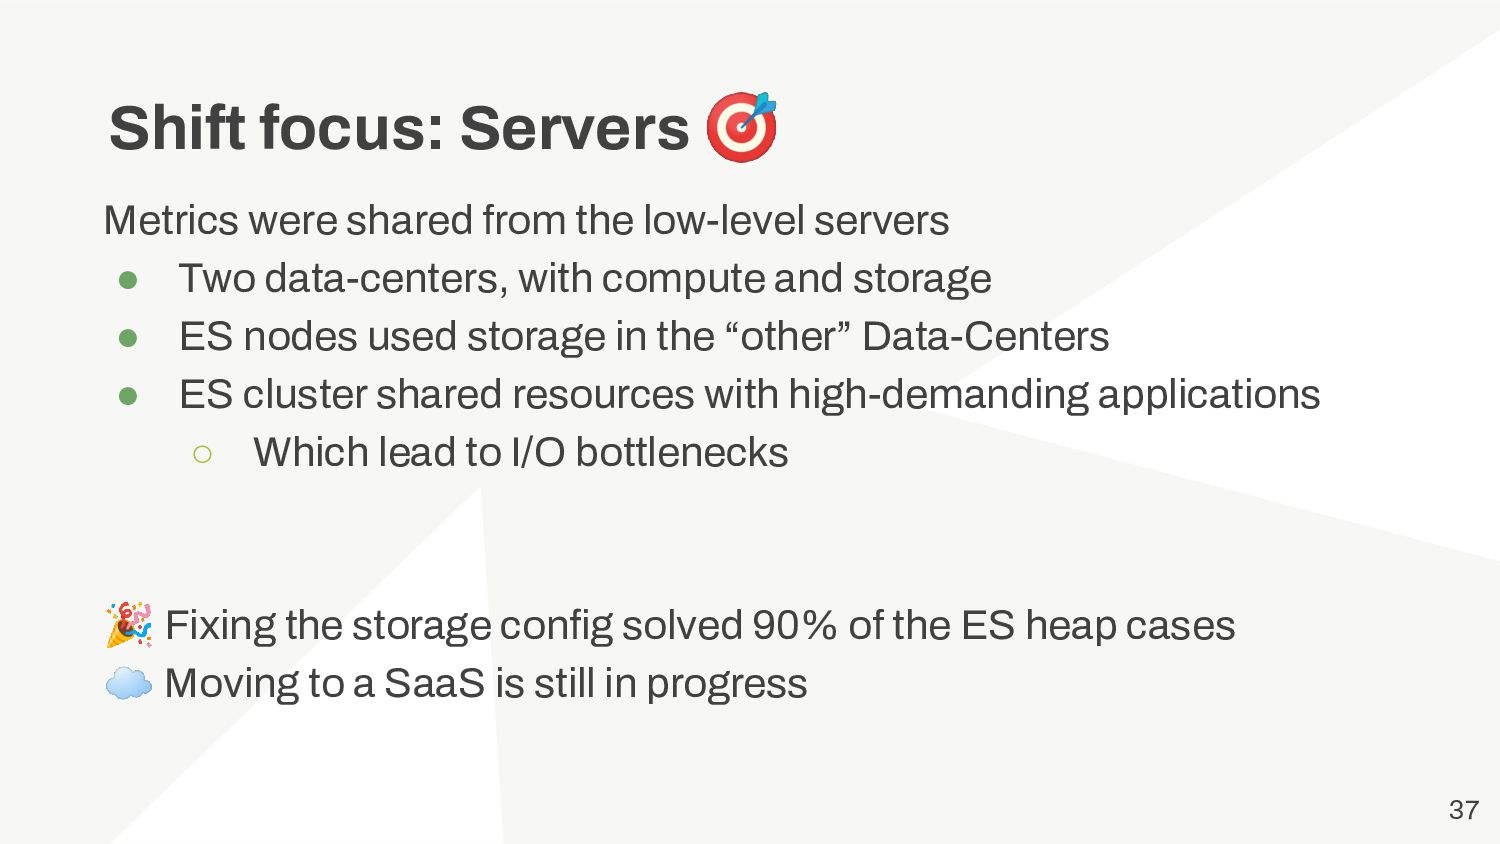
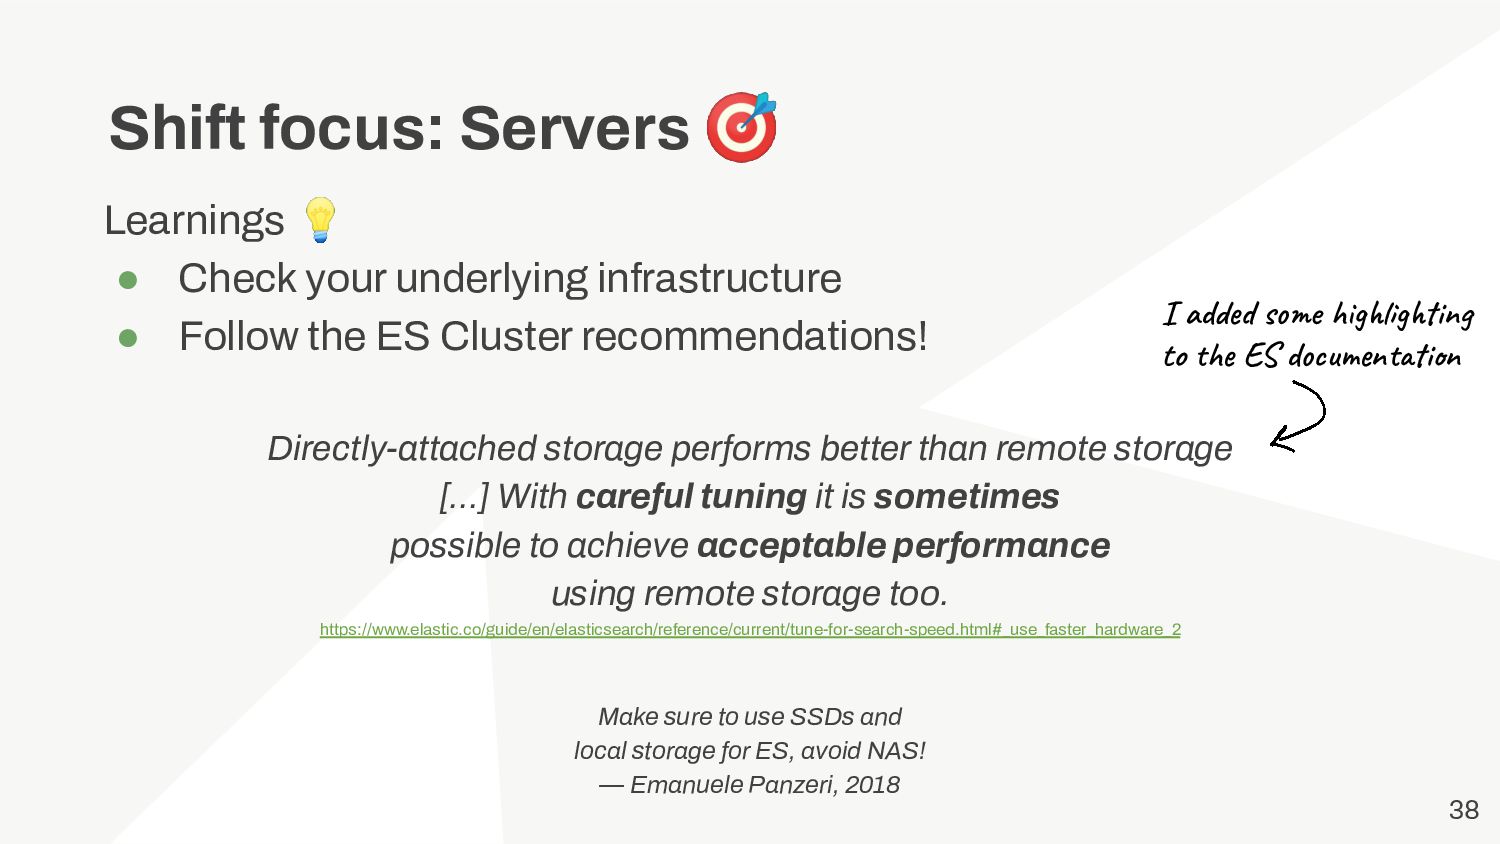
- Digging into Elasticsearch APIs and some internals

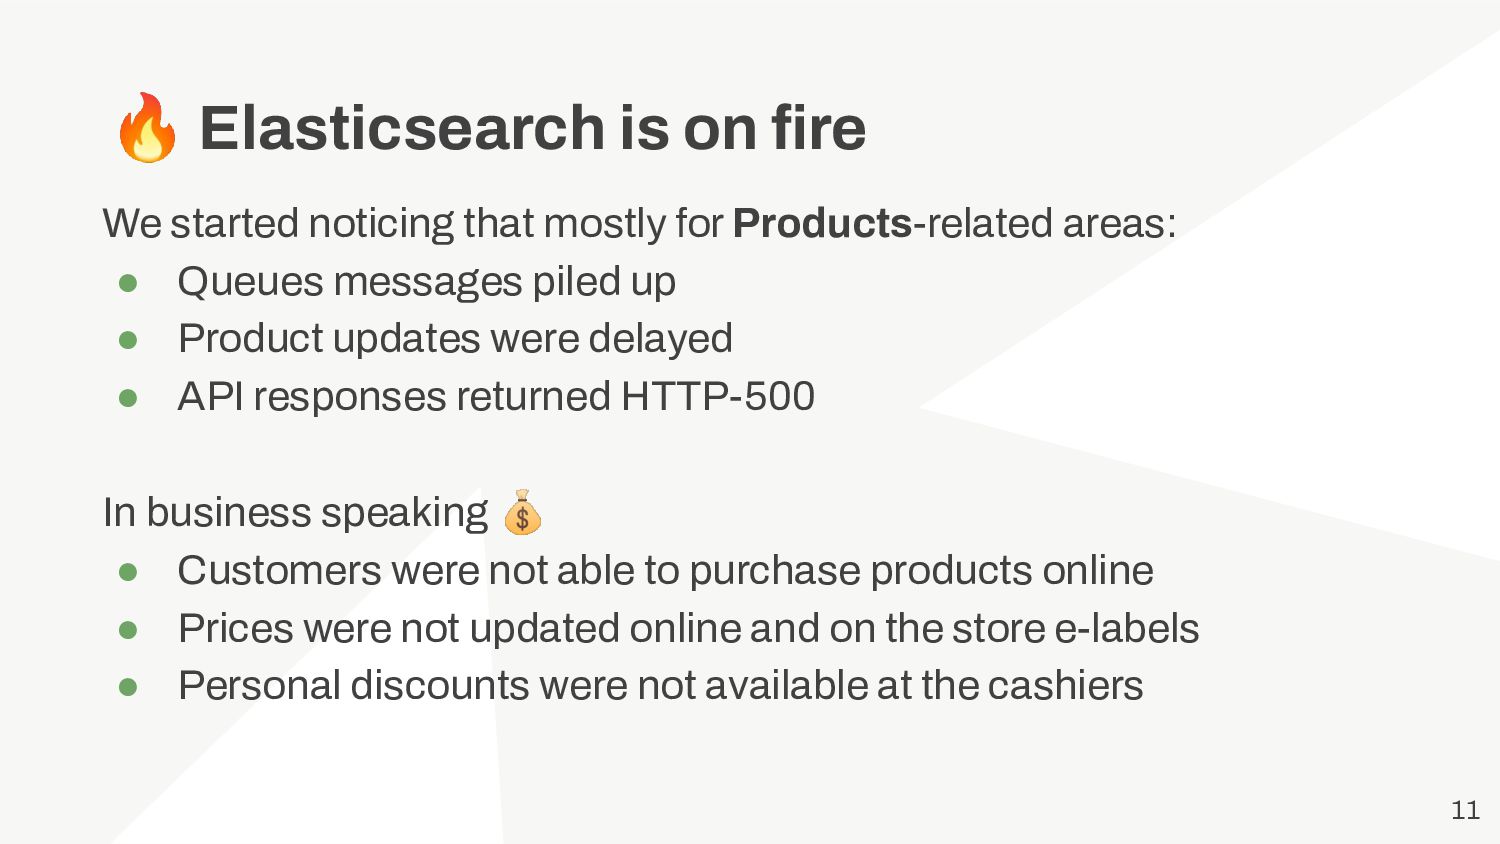
To finally find the root cause of a spike of http-500 errors in a public facing API with 2M requests.

All of that by using the Blackfire profiling features.

Avatar for Emanuele

Emanuele

June 14, 2023
Tweet

Other Decks in Programming

Transcript

  1. Hello! Emanuele Panzeri | thePanz Software Engineer at Liip -

    Zurich Elastica PHP Client maintainer github.com/thePanz @[email protected] 2
  2. Agenda • Context 🐙 • Application is on fire 🔥

    • Firefighting sessions 🚒 • Lessons learned 📖 3
  3. Application Context “We built a data kraken” — dbu @

    SymfonyCon 2022 flickr.com/photos/w-tommerdich/32823758672 4
  4. Product API built on Symfony • Uses multiple SF components

    Messenger, HttpClient, Process, Notifier, Validator, .. • Aggregates data from 30+ sources with multiple formats JSON, XML, CSV accessed from REST, XMLRPC, … • Consolidates (and clears) source information Database for local caching, Elasticsearch for aggregations and search • Exposes data via JSON REST APIs Serving ~35M requests per day (mobile, cashier registries, …) And some other weird ones too Most read-only APIs 5
  5. Data Workflow: acquisition and exposing Elasticsearch cluster ES Data Indexer

    ES Data Fetcher Symfony Rest API Symfony workers Message Queues Symfony Commands Triggered manually or by Cron-Jobs 6
  6. Data Workflow: ingestion • Data import (into MySQL, Redis) ◦

    Incoming RabbitMQ messages for data updates ◦ Data importing tasks run via Cron-jobs ◦ Data changes dispatch (internal) messages for indexing • Data indexing ◦ Entities are build by aggregating source data ◦ Denormalized objects are stored into Elasticsearch ◦ Entity-changed events trigger outgoing messages If possible we perform partial updates of ES objects 7
  7. Data Workflow: import (workers) Message Workers are managed by a

    dedicated “Autoscaler-App”: • A worker is being run on dedicated cloud instance called "task” ◦ Each task corresponds to a `bin/console messenger:consume transport-name` process being executed • Monitors the queues associated with each worker • Decides if the number of tasks are enough consume a given queue • Scales up/down the number of tasks ◦ Keeps at least 1 task ready for new messages ◦ Cap the number of tasks per transport 8
  8. • API requests are cached (when possible) on Varnish •

    Elasticsearch indexes are queried for matching data • API responses are created from ES data - Search data and build aggregations/facets - Apply dynamic data alteration before output - Reformat according to the required API version - Data exposed for the 3 national languages* (+ english) [*] German, French, and Italian. Switzerland also includes Romansh, used only by the 0.5% of the swiss population. Data Workflow: exposing via APIs Like regional parameters (eg: prices)
  9. We started noticing that mostly for Products-related areas: • Queues

    messages piled up • Product updates were delayed • API responses returned HTTP-500 In business speaking 💰 • Customers were not able to purchase products online • Prices were not updated online and on the store e-labels • Personal discounts were not available at the cashiers 🔥 Elasticsearch is on fire 11
  10. Elasticsearch errors started to appear on our logs for: -

    Indexing pipelines - delivering API Responses Which translated as: “The indexing of product 131415 required more than 29.4GB of memory” 😱 🔥 Elasticsearch is on fire update: ****************_product_de_20221208/_doc/131415 caused [parent] Data too large, data for [indices:data/write/bulk[s]] would be [31648082036/29.4gb], which is larger than the limit of [31621696716/29.4gb], real usage: [31648077680/29.4gb], new bytes reserved: [4356/4.2kb], […] Elastica\Exception\Bulk\Response\ActionException 12 The product itself is 4.2kb of JSON data
  11. On the Elasticsearch cluster, the situation was not good either

    • The cluster was unresponsive • 3 nodes were blocked, with 95% of memory used → which blocked the entire cluster to process other requests 🔥 Elasticsearch is on fire 13
  12. What happened? • No previous updates on the ES Cluster

    • No changes on the application side • Restarting the affected nodes solved the issue ◦ Until few days later 🔥 Elasticsearch is on fire 14 Restarting helped, but just for few days
  13. ES: Data Too Large? “Something else is holding on to

    excessive amounts of memory ” 🤷 https://discuss.elastic.co/t/what-does-this-error-mean-data-too-large-data-for-transport-request/209345/6 (from 2019) “Try increasing the available memory of your ES Cluster” https://www.elastic.co/guide/en/elasticsearch/reference/7.14/fix-common-cluster-issues.html#circuit-breaker-errors Did not work and the Cluster’s JVM was configured according to ES best practices 15
  14. Emergency measures • Reduce the number of parallel workers ◦

    delayed updates to prices still caused issues • Upgrade ES to latest patch version ◦ Not something you want to blindly do in those situations ◦ ⚠ ES Data not compatible when downgrading a patch version • Dev-Ops team restarting ES nodes 24/7 was not sustainable 17
  15. Next: Analyze and profile Start a focused the analysis on

    the Application • Gather logs and metrics • Avoid overloading ES with too many requests • Optimizing the data flow 18
  16. ElasticSearch Logs - I Our centralized logs kept some of

    the ES logs: • Most from high-level logging → nothing helpful • Our docker instance provided helpful information, tho! Deprecated: Do not use the _id field for aggregations, sorting, and scripting as it requires to load a lot of data in memory. https://www.elastic.co/guide/en/elasticsearch/reference/7.17/mapping-id-field.html https://github.com/elastic/elasticsearch/pull/64610 🔥 The _id field was our “default” sorting when nothing was provided! Does not sound critical 20
  17. ElasticSearch Logs - II Learnings 💡 • Use a dedicated

    ‘id’ field to reduce memory pressure on ES cluster • Make sure that *all* Logs are collected (deprecations too) ◦ ES can collect deprecations in “hidden” indexes in the cluster • Do not underestimate deprecations! 21 Helped to lower the average memory usage…
  18. App: Precompute - I 23 Analyzed the impact on ES

    of our Rest APIs - Multiple ES queries per “product” - Additional ES query per aggregation/facet Examples: - Additional information computed from ES - Extend aggregations data for API presentation { # Example API response for Products collection "facets" : { "brand": { "name": "Brands", "terms": [ { "term": "PT15", "count": 54, "name": "Best Potato", "slug": "best-potato"}, { "term": "PZ41", "count": 68, "name": "Pizza Yum!", "slug": "pizza-yum" } ]}}, "hits" : [ … ], Term and Count are provided by ES, the rest is fetched from the Brand ES index
  19. App: Precompute - II Learnings 💡 • Heavily denormalize your

    data in ES • Build aggregations on ad-hoc ES fields 24 { # Raw Product JSON data stored in ES "name": "Cheese and Spinach", … "brand": { "id": "PZ15", "name": "Pizza Yum!", "slug": "pizza-yum", "facet_value": "{\"id\":\"PZ41\",\"name\":\"Pizza Yum!\",\"slug\":\"pizza-yum\"}" }, ES uses “facet_value” for aggregation providing all data needed for our API ~40% less queries on ES
  20. App: Batch fetch what you need - I Used Blackfire

    to profile an “mid-average” product indexing (~300 variants) Why so many calls? After sending data to ES: - We (re-)fetch the affected products - Validate that the updated_at property is correct - Products were fetched 1 by 1 (for all languages) 25 For “legacy” reasons
  21. App: Batch fetch what you need - II Improvements on

    “index” call: • ~ 1500 less HTTP requests to ES • ~60% less time (-15s) • ~80% less IO wait • ~7% less data transfer 26
  22. Learnings 💡 • Batch fetch data from ES • Directly

    fetch data from the ES DocValues2 ◦ Do not ask ES to parse the JSON object • Paginate results without creating memory overhead 1 ◦ Use ES “search_after” 2 feature [1] https://www.elastic.co/guide/en/elasticsearch/reference/current/paginate-search-results.html#search-after [2] https://www.elastic.co/guide/en/elasticsearch/reference/current/doc-values.html App: Batch fetch what you need - III 27
  23. Blackfire: profile data building for Product prices (product with 5

    variants) • Product JSON data in stored in MySQL ◦ “denormalized” into PHP object with SF Serializer • We use JanePhp to build PHP Models from OpenAPI ◦ Normalizers are generated for schema objects • A highly nested structure in the JSON creates a bottleneck for denormalize() App: Do not over (de)Serialize - I 28
  24. • We know that SF Serializer is fast • But

    handling ~300 different models/normalizers might be too much :) App: Do not over (de)Serialize - II 29 We are “just” the consumers of this OpenAPI schema No chance to get a cleaner structure :(
  25. App: Do not over (de)Serialize - III 30 Improvements: •

    Cache deserialized models in Redis • Use EventDispatcher to prune the cache • +128 kB (+62.7%) network IO to Redis • ~97% less execution time (-5s) • ~70% less memory used (-11MB)
  26. App: Do not over (de)Serialize - IV 31 Learnings 💡

    • Trust the SF components, but keep an eye on performances • Try to simplify your schema models (if you can) • Clear the caches! There are only two hard things in Computer Science: cache invalidation and naming things. — Phil Karlton
  27. App: Performance gains 33 The changes introduced dramatically improved the

    application • Workers were faster ◦ Less time to consume “indexing” messages ◦ Lower memory footprint • Less ES requests per worker • Less ES queries to build API responses
  28. App: Performance gains, but… 😭 34 • More frequent memory

    spikes on the ES Cluster • Had to further reduce the max number of product-workers ◦ Before: max 50 ◦ After: max 20
  29. Shift focus: Servers and ES Cluster 36 • Self hosted

    by another company, black-box from our DevOps • Our TEST environment was able to sustain higher loads without heap issues on ES Could it be that the PROD cluster is not properly setup? — Anonymous
  30. Shift focus: Servers 🎯 37 Metrics were shared from the

    low-level servers • Two data-centers, with compute and storage • ES nodes used storage in the “other” Data-Centers • ES cluster shared resources with high-demanding applications ◦ Which lead to I/O bottlenecks 🎉 Fixing the storage config solved 90% of the ES heap cases ☁ Moving to a SaaS is still in progress
  31. Shift focus: Servers 🎯 38 Learnings 💡 • Check your

    underlying infrastructure • Follow the ES Cluster recommendations! Directly-attached storage performs better than remote storage […] With careful tuning it is sometimes possible to achieve acceptable performance using remote storage too. https://www.elastic.co/guide/en/elasticsearch/reference/current/tune-for-search-speed.html#_use_faster_hardware_2 Make sure to use SSDs and local storage for ES, avoid NAS! — Emanuele Panzeri, 2018 I added some highlighting to the ES documentation
  32. Learnings 💡 40 • On fire event: keep calm! Check

    the logs, metrics and monitoring systems • Profile your application! Some big optimizations might be quick to implement • Trust your Cloud systems Just not always
  33. [extra] Deployments + Blackfire tests 42 • We run Blackfire

    tests during the deployments • The deployment is blocked if the assertions fail # file: .blackfire.yml tests: 'Product indexing (PR-bdf156)': command: '.*app:elasticsearch:products:import.*PR-bdf156' assertions: - 'main.wall_time < 30s' - 'main.memory < 200Mb' - 'metrics.amqp.connections.count == 0' - 'metrics.doctrine.orm.flush.count < 15' - 'metrics.http.requests.count < 30' - 'metrics.elasticsearch.queries.count < 23' - 'metrics.elasticsearch.elastica.queries.count < 23' - 'metrics.sql.queries.count < 200' 'Product indexing (PR-bcf240)': command: '.*app:elasticsearch:products:import.*PR-bcf240' assertions: - 'main.wall_time < 60s' - 'main.memory < 200Mb' - 'metrics.amqp.connections.count == 0' - 'metrics.doctrine.orm.flush.count < 15' - 'metrics.http.requests.count < 190' - 'metrics.elasticsearch.queries.count < 170' - 'metrics.elasticsearch.elastica.queries.count < 170' - 'metrics.sql.queries.count < 1220'