Upgrade to Pro — share decks privately, control downloads, hide ads and more …

Maps - Boulder JS Meetup - August 2016

Avatar for Laura S Laura S
August 17, 2016

Maps - Boulder JS Meetup - August 2016

An introduction to maps on the web.

Avatar for Laura S

Laura S

August 17, 2016
Tweet

More Decks by Laura S

Other Decks in Technology

Transcript

  1. Maps In Your .JS What You Should Know As A

    Web Developer Laura Steadman @adventuresteady Boulder JS, August 17, 2016
  2. Our Path Tonight 1. Thinking About Purpose: Why do you

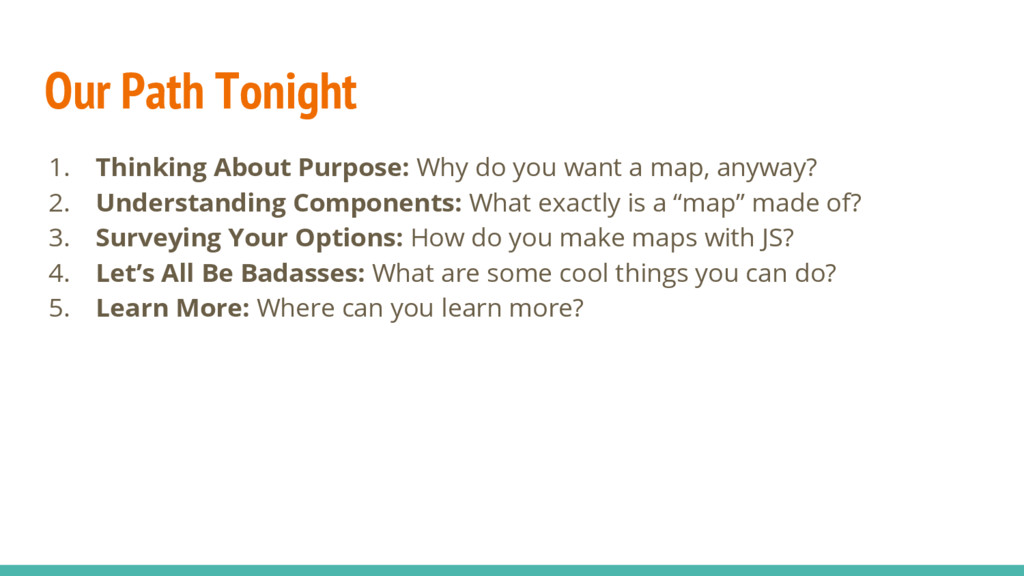
    want a map, anyway? 2. Understanding Components: What exactly is a “map” made of? 3. Surveying Your Options: How do you make maps with JS? 4. Let’s All Be Badasses: What are some cool things you can do? 5. Learn More: Where can you learn more?
  3. Thinking About Purpose: Why Do You Want a Map, Anyway?

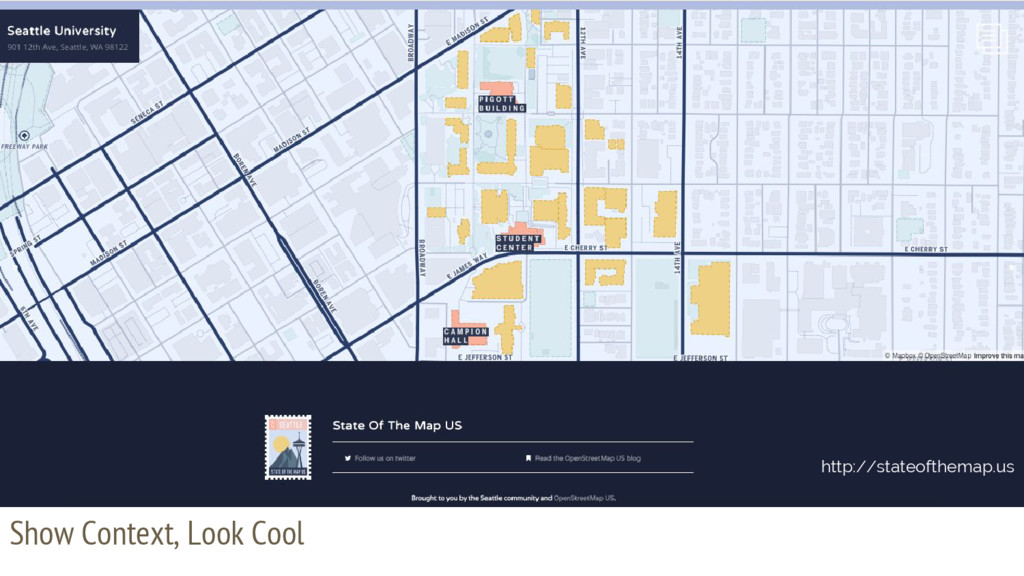
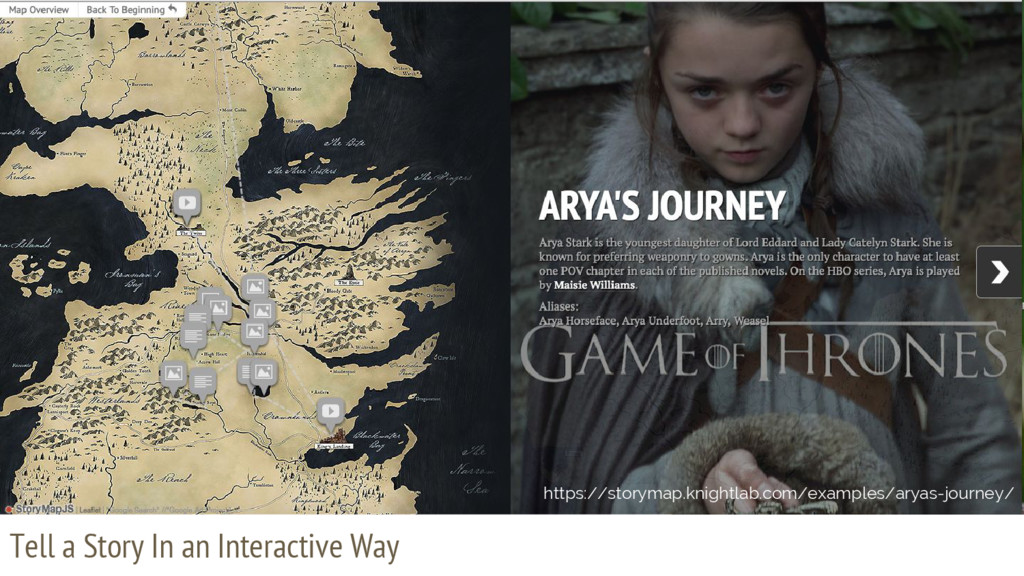
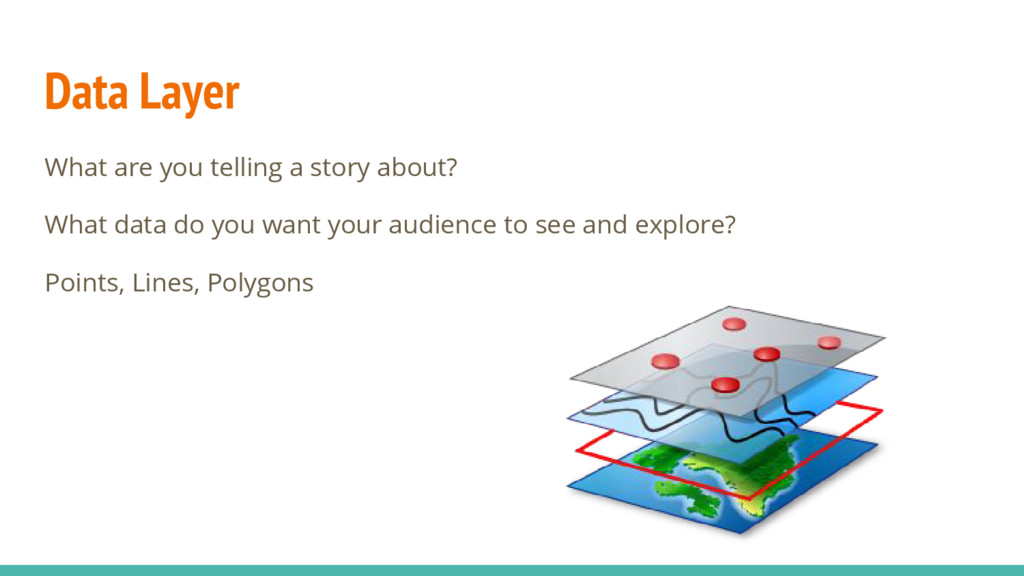
    - Maps are a type of data visualization that display spatial data. - There are lots of ways to display spatial data on the web. - Understanding what you want to convey to your audience can inform what it is you need to build.
  4. The 3 Pieces to A Web Map - Let’s Break

    It Down - Base Map (or base layer) - Data layer - UI interaction And a 4th to help you get it all done…
  5. Data Layer What are you telling a story about? What

    data do you want your audience to see and explore? Points, Lines, Polygons
  6. You need a library! How do you combine a base

    map, data, and interactions with JavaScript to make your web map?
  7. Base Maps - How Do You Get One? - Library

    defaults (e.g., Google) - Variety of providers, many free - Roll your own!
  8. Make A Custom Base Map Mapbox Studio https://www.mapbox.com/mapbox-studio See their

    Gallery for examples: https://www.mapbox.com/gallery/ https://www.mapbox.com/blog/sketchy-maps
  9. Be careful about where you get your base map from,

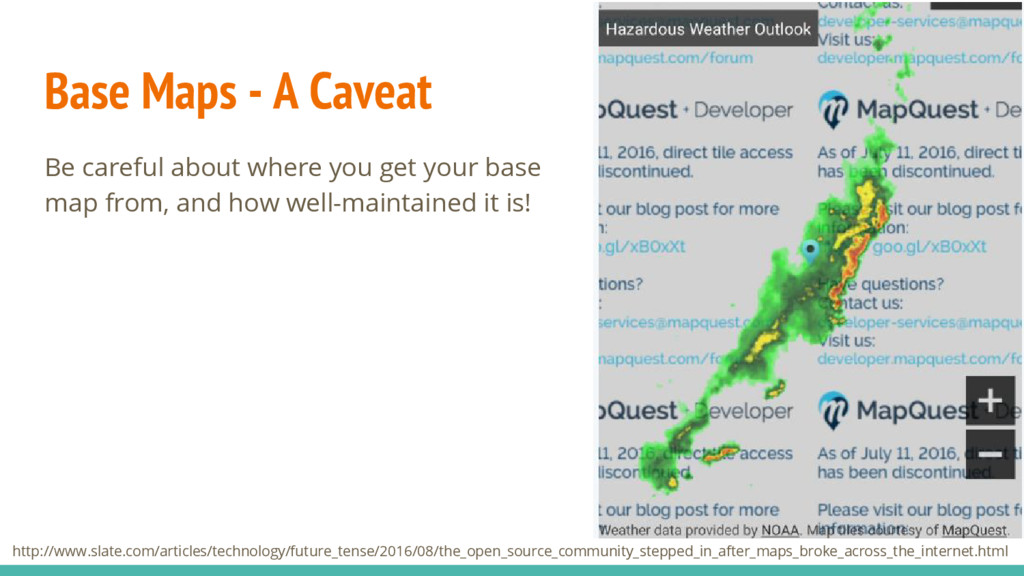
    and how well-maintained it is! Base Maps - A Caveat http://www.slate.com/articles/technology/future_tense/2016/08/the_open_source_community_stepped_in_after_maps_broke_across_the_internet.html
  10. Data - Comes in a wide variety of formats (Shapefile,

    GeoJSON, JSON, ...) - Lots of tools to process it (ogr2ogr, QGIS)
  11. Interactions - Your library will handle the basics! - Point

    pop-ups: usually just HTML - Many interactions are actually just event handlers that you’re used to (e.g., click events)
  12. Turf.js - Add Analysis to Your Maps! Client-side or via

    Node.js http://turfjs.org/ https://www.mapbox.com/bites/00087/ https://www.mapbox.com/blog/coffee-with-turf/
  13. Who Says You Need To Map in 2D? https://cesiumjs.org -

    WebGL 3D renderings https://cesiumjs.org/NewYork
  14. Resources/ Learn More https://github.com/thesteady/mapping_examples Great Tutorials Leaflet - leafletjs.com Mapbox

    - mapbox.com Meetups! MapTime Boulder / Denver GeoSpatial Amateurs (Denver) Thanks! Twitter: @adventuresteady