Upgrade to Pro — share decks privately, control downloads, hide ads and more …

Metrics monitoring at Criteo using Prometheus a...

Metrics monitoring at Criteo using Prometheus and its Remote-Adapter

Feedbacks about metrics monitoring at Criteo. Short presentation of Prometheus and how it was chosen and adopted. Then discussion about getting benefits of Prometheus features for metrics monitoring while using Graphite as long-term storage for metrics. At Criteo we developed an opensource bridge between the two TSDBs called graphite-remote-adapter.

Avatar for Thibault Chataigner

Thibault Chataigner

December 14, 2017

Other Decks in Technology

Transcript

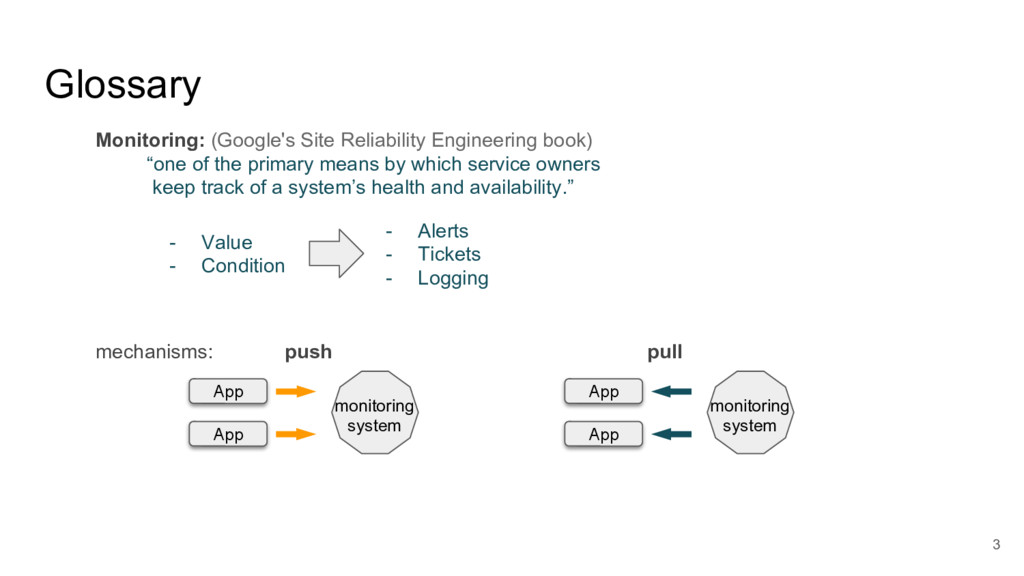
  1. 3 Glossary Monitoring: (Google's Site Reliability Engineering book) “one of

    the primary means by which service owners keep track of a system’s health and availability.” mechanisms: push pull - Alerts - Tickets - Logging - Value - Condition App monitoring system App App monitoring system App
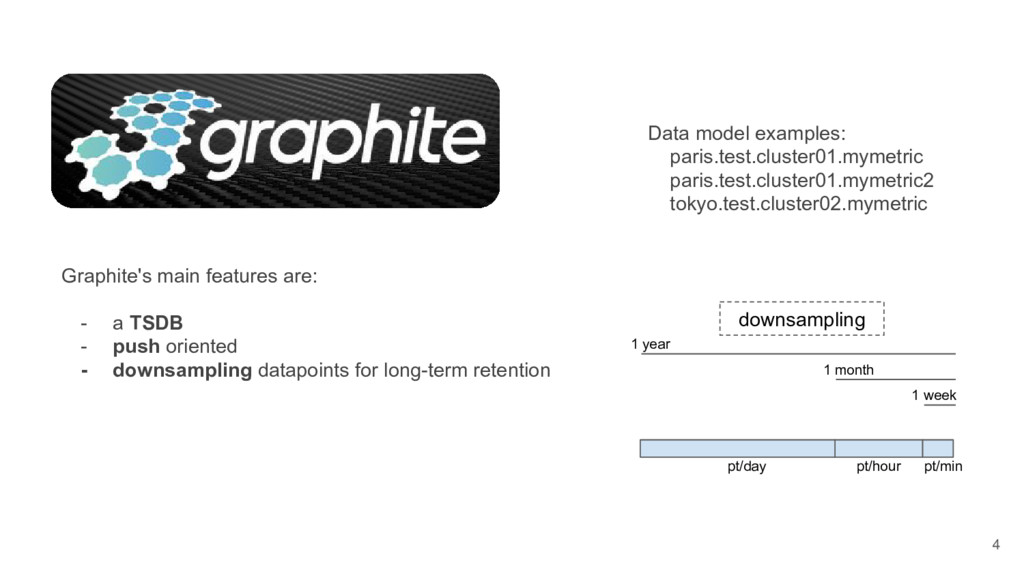
  2. Graphite's main features are: - a TSDB - push oriented

    - downsampling datapoints for long-term retention Data model examples: paris.test.cluster01.mymetric paris.test.cluster01.mymetric2 tokyo.test.cluster02.mymetric 4 1 year 1 month 1 week pt/min pt/hour pt/day downsampling
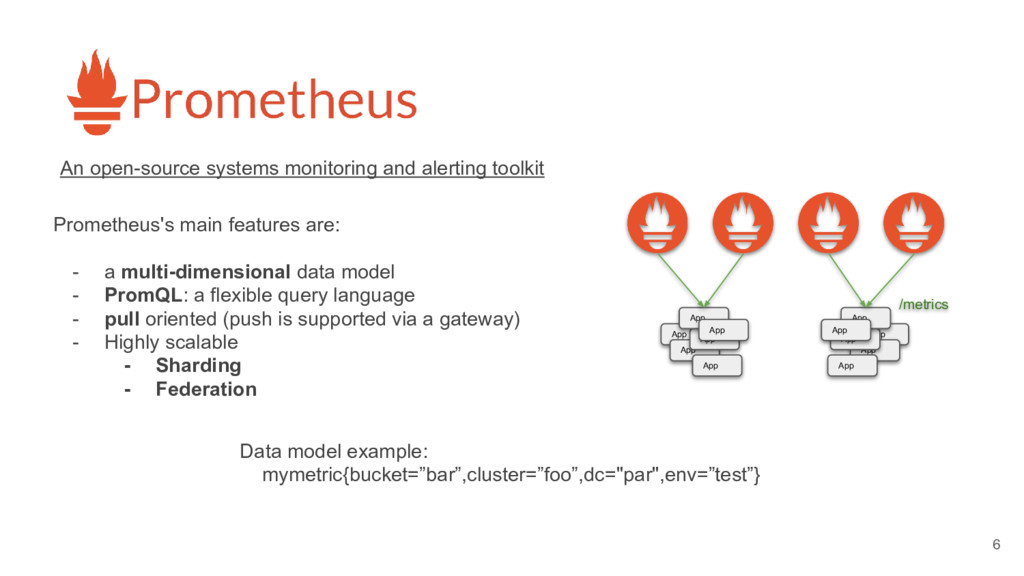
  3. An open-source systems monitoring and alerting toolkit Prometheus's main features

    are: - a multi-dimensional data model - PromQL: a flexible query language - pull oriented (push is supported via a gateway) - Highly scalable - Sharding - Federation Data model example: mymetric{bucket=”bar”,cluster=”foo”,dc="par",env=”test”} 5 App App App App App App App App App App App App
  4. An open-source systems monitoring and alerting toolkit Prometheus's main features

    are: - a multi-dimensional data model - PromQL: a flexible query language - pull oriented (push is supported via a gateway) - Highly scalable - Sharding - Federation Data model example: mymetric{bucket=”bar”,cluster=”foo”,dc="par",env=”test”} App App App App App App App App App App App App /metrics 6
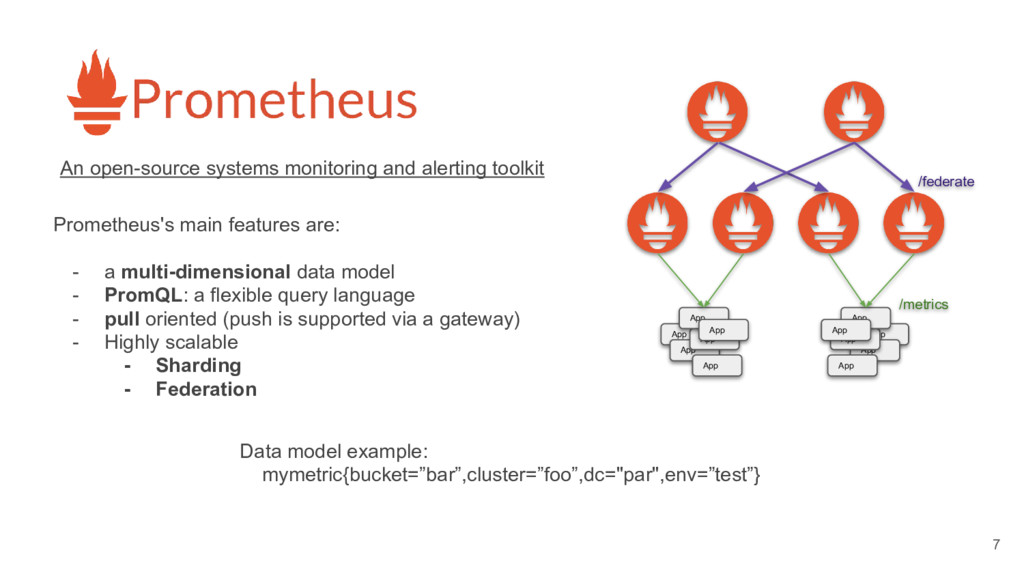
  5. An open-source systems monitoring and alerting toolkit Prometheus's main features

    are: - a multi-dimensional data model - PromQL: a flexible query language - pull oriented (push is supported via a gateway) - Highly scalable - Sharding - Federation Data model example: mymetric{bucket=”bar”,cluster=”foo”,dc="par",env=”test”} App App App App App App App App App App App App /metrics /federate 7
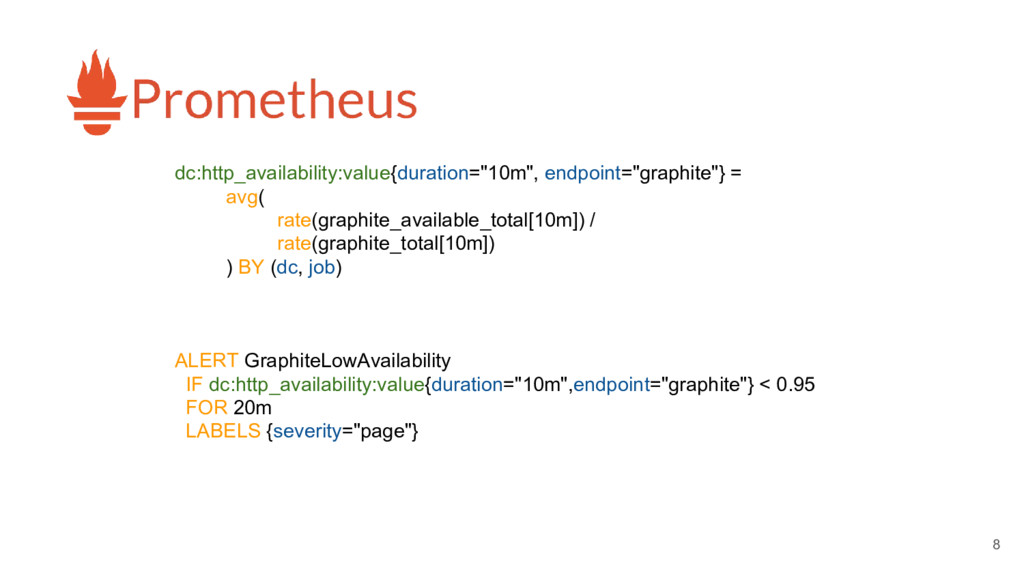
  6. 8 dc:http_availability:value{duration="10m", endpoint="graphite"} = avg( rate(graphite_available_total[10m]) / rate(graphite_total[10m]) ) BY

    (dc, job) ALERT GraphiteLowAvailability IF dc:http_availability:value{duration="10m",endpoint="graphite"} < 0.95 FOR 20m LABELS {severity="page"}
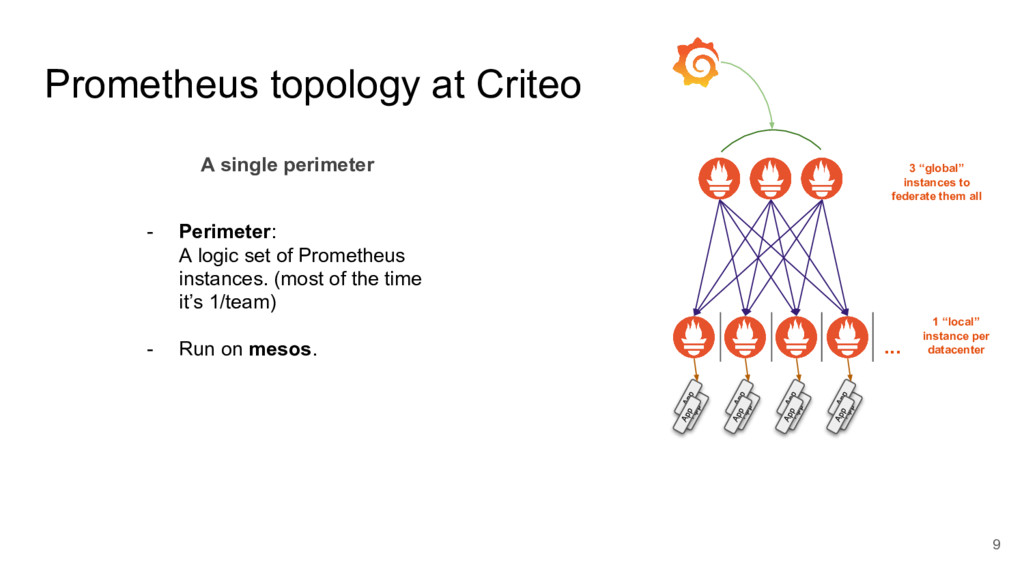
  7. Prometheus topology at Criteo A single perimeter - Perimeter: A

    logic set of Prometheus instances. (most of the time it’s 1/team) - Run on mesos. 1 “local” instance per datacenter ... 3 “global” instances to federate them all App App App App App App App App App App App App 9
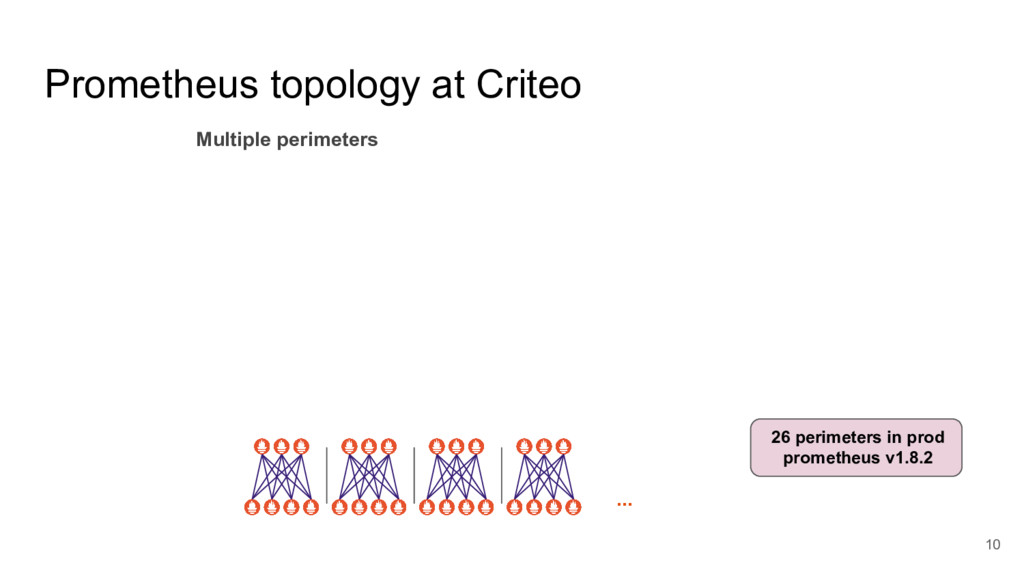
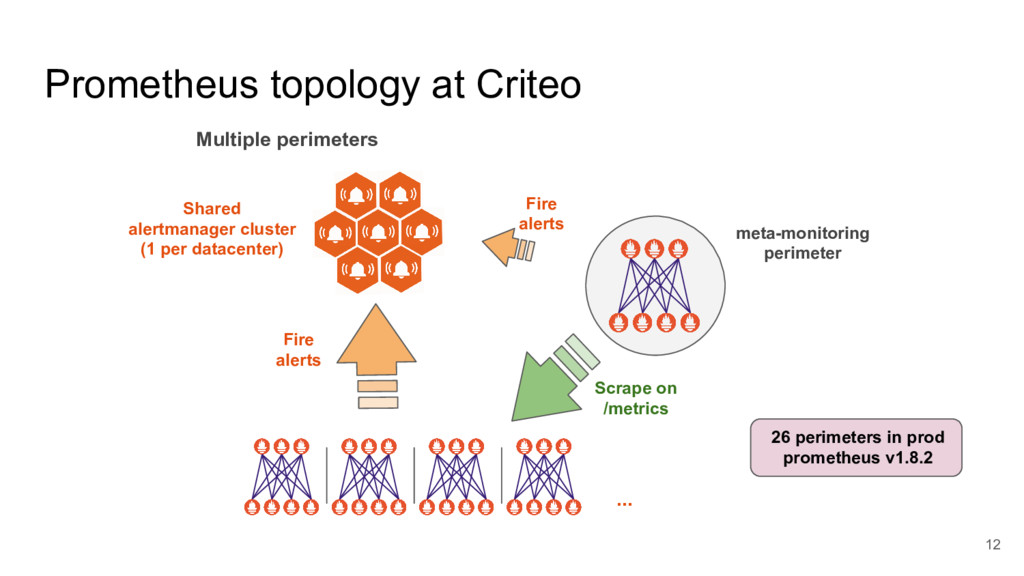
  8. Prometheus topology at Criteo 26 perimeters in prod prometheus v1.8.2

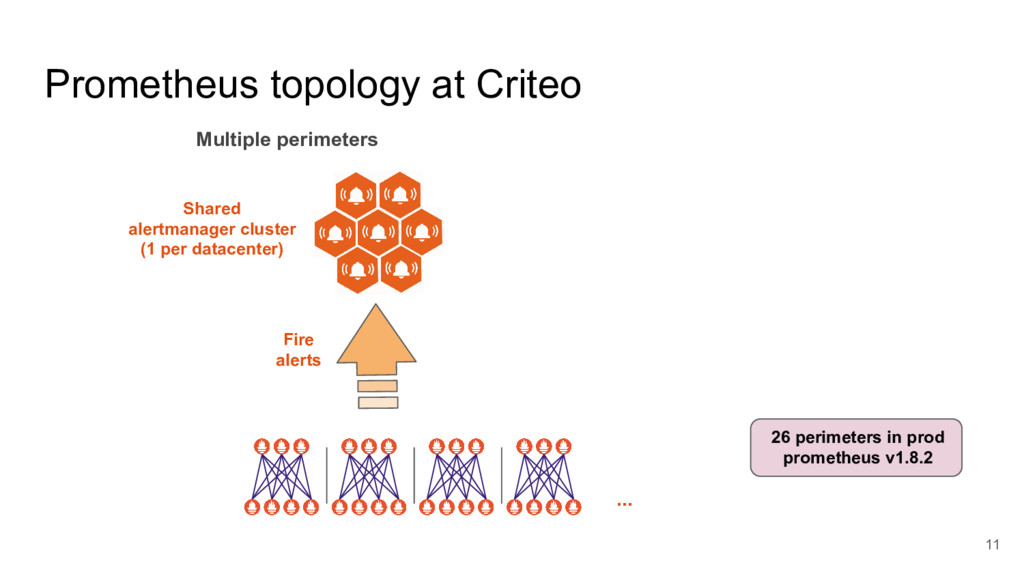
    ... Shared alertmanager cluster (1 per datacenter) Fire alerts Multiple perimeters 11
  9. Prometheus topology at Criteo 26 perimeters in prod prometheus v1.8.2

    ... Shared alertmanager cluster (1 per datacenter) Fire alerts Fire alerts Scrape on /metrics meta-monitoring perimeter Multiple perimeters 12
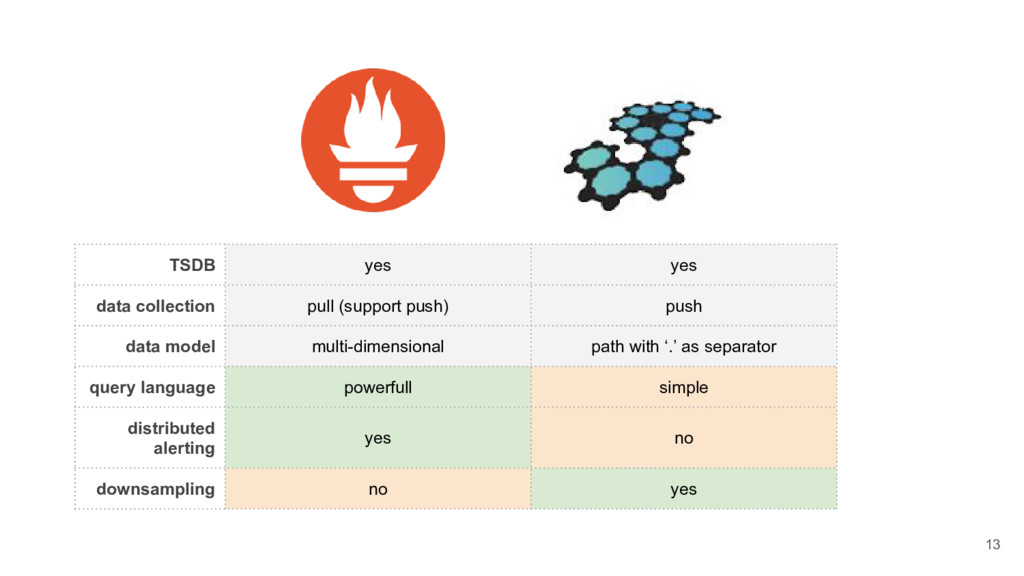
  10. TSDB yes yes data collection pull (support push) push data

    model multi-dimensional path with ‘.’ as separator query language powerfull simple distributed alerting yes no downsampling no yes 13
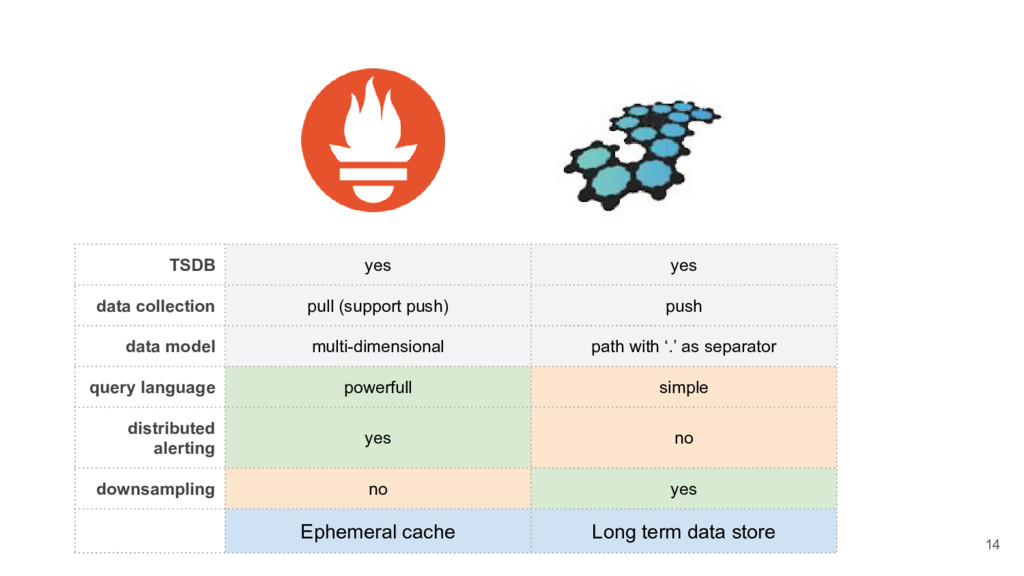
  11. TSDB yes yes data collection pull (support push) push data

    model multi-dimensional path with ‘.’ as separator query language powerfull simple distributed alerting yes no downsampling no yes Ephemeral cache Long term data store 14
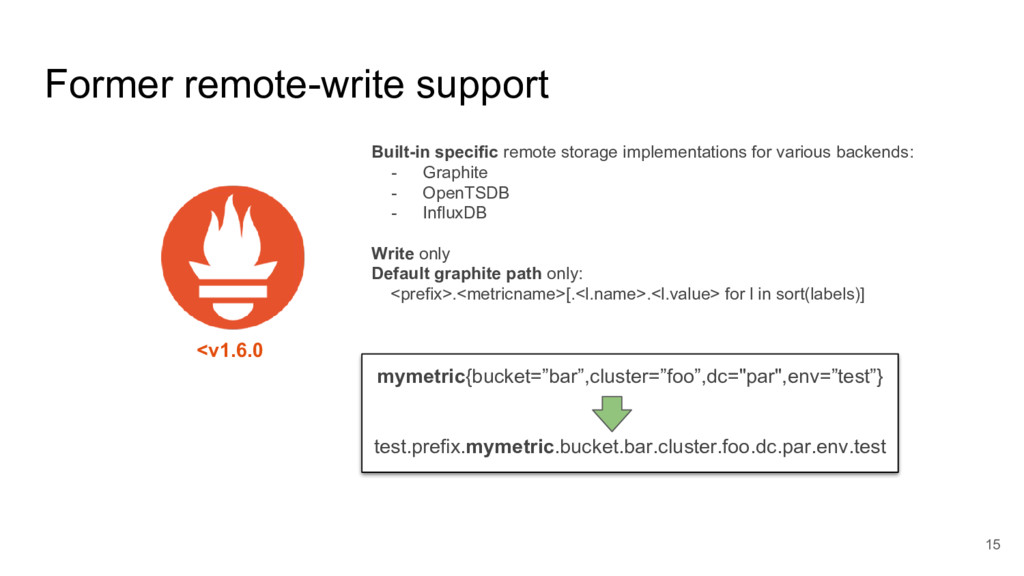
  12. Built-in specific remote storage implementations for various backends: - Graphite

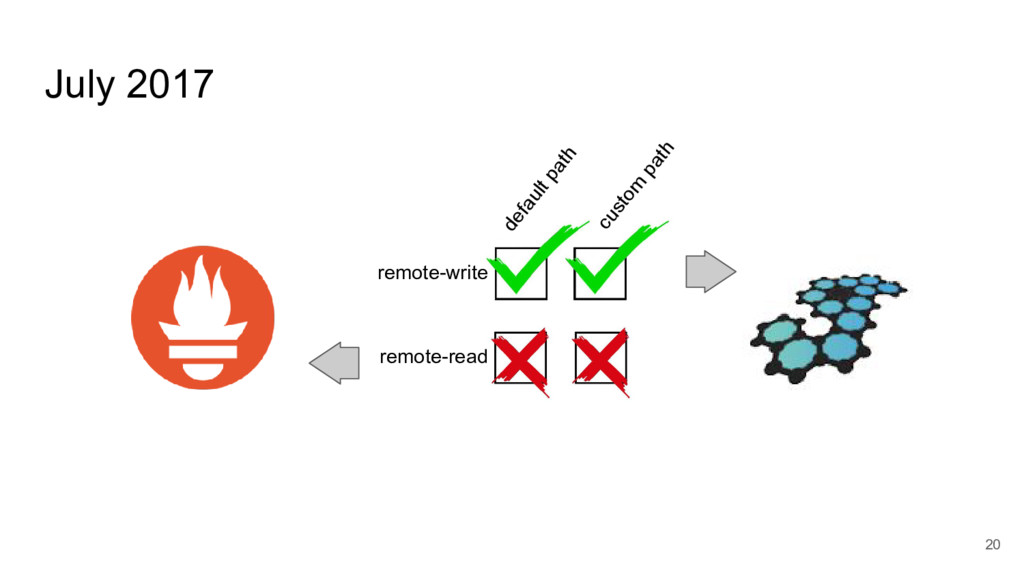
    - OpenTSDB - InfluxDB Write only Default graphite path only: <prefix>.<metricname>[.<l.name>.<l.value> for l in sort(labels)] <v1.6.0 Former remote-write support mymetric{bucket=”bar”,cluster=”foo”,dc="par",env=”test”} test.prefix.mymetric.bucket.bar.cluster.foo.dc.par.env.test 15
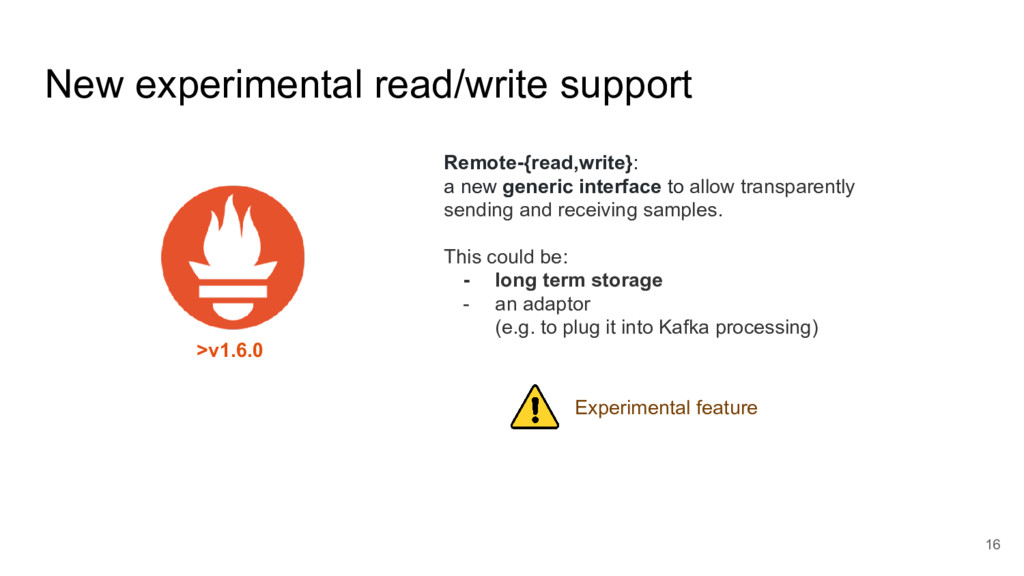
  13. Remote-{read,write}: a new generic interface to allow transparently sending and

    receiving samples. This could be: - long term storage - an adaptor (e.g. to plug it into Kafka processing) Experimental feature New experimental read/write support >v1.6.0 16
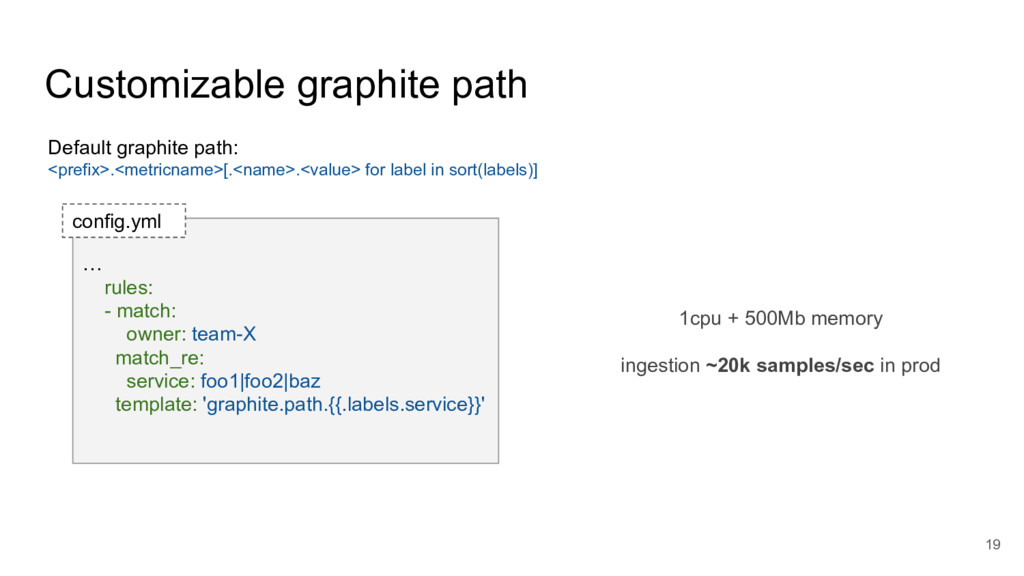
  14. Default graphite path: <prefix>.<metricname>[.<name>.<value> for label in sort(labels)] 1cpu +

    500Mb memory ingestion ~20k samples/sec in prod … rules: - match: owner: team-X match_re: service: foo1|foo2|baz template: 'graphite.path.{{.labels.service}}' Customizable graphite path config.yml 19
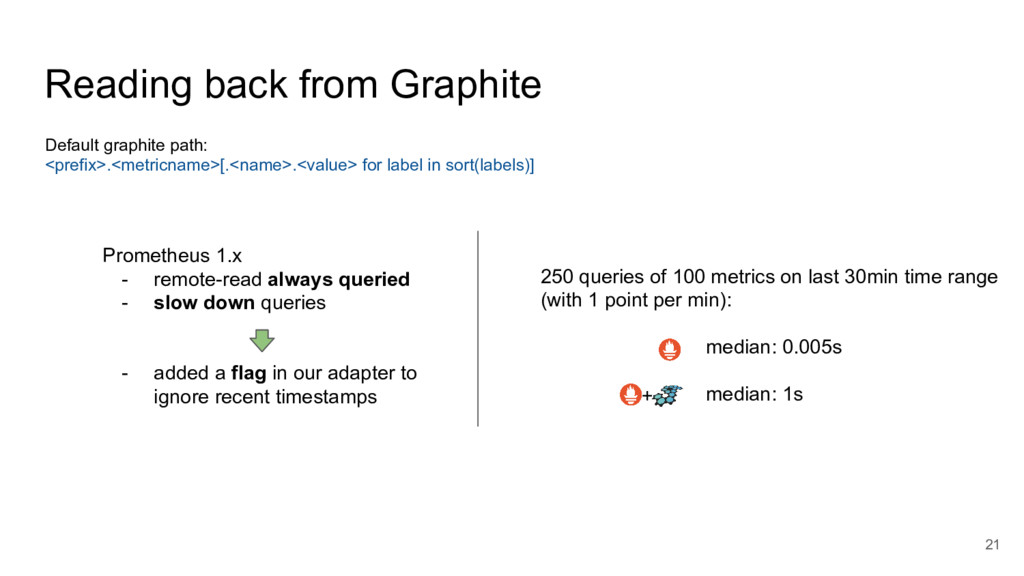
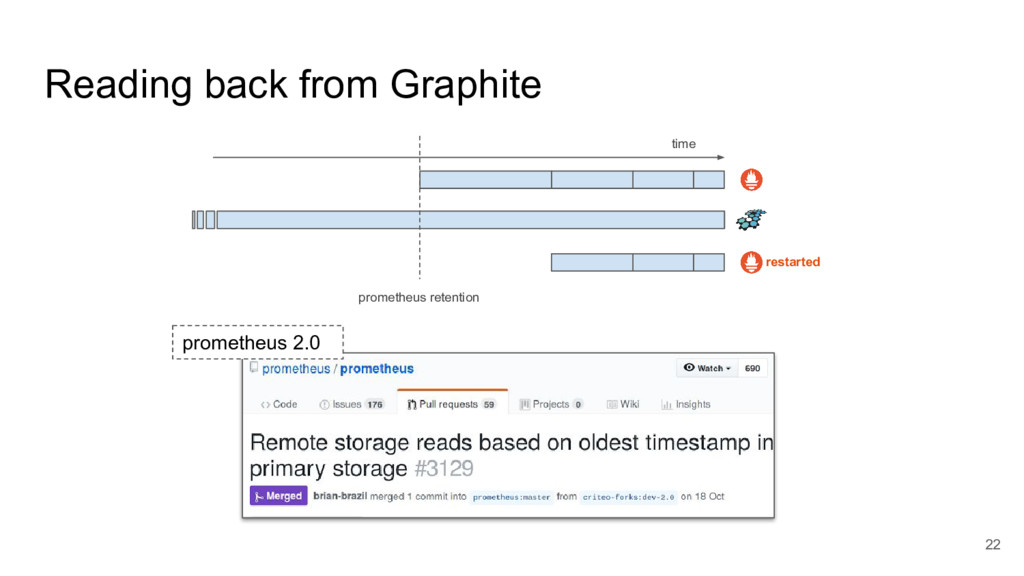
  15. Default graphite path: <prefix>.<metricname>[.<name>.<value> for label in sort(labels)] Prometheus 1.x

    - remote-read always queried - slow down queries - added a flag in our adapter to ignore recent timestamps Reading back from Graphite 21 250 queries of 100 metrics on last 30min time range (with 1 point per min): median: 0.005s median: 1s +
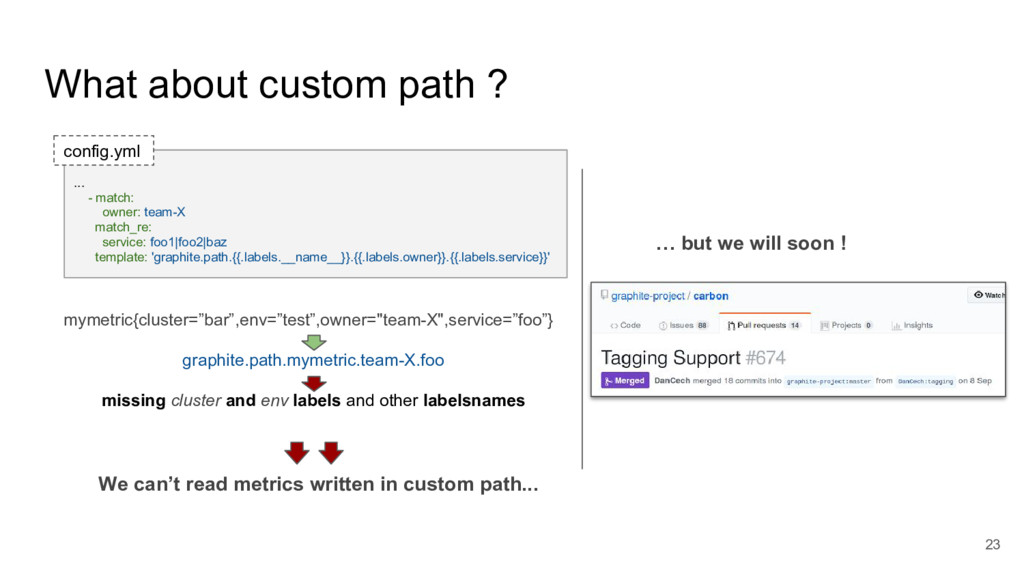
  16. example {metric=>template} where we can’t go back to labelSet …

    but we will soon ! ... - match: owner: team-X match_re: service: foo1|foo2|baz template: 'graphite.path.{{.labels.__name__}}.{{.labels.owner}}.{{.labels.service}}' config.yml mymetric{cluster=”bar”,env=”test”,owner="team-X",service=”foo”} graphite.path.mymetric.team-X.foo missing cluster and env labels and other labelsnames We can’t read metrics written in custom path... What about custom path ? 23
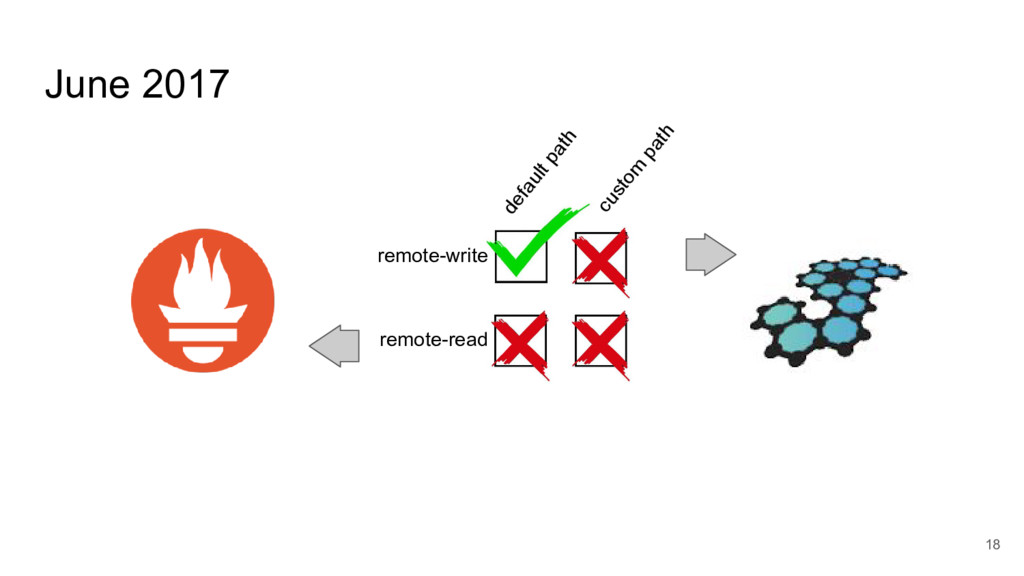
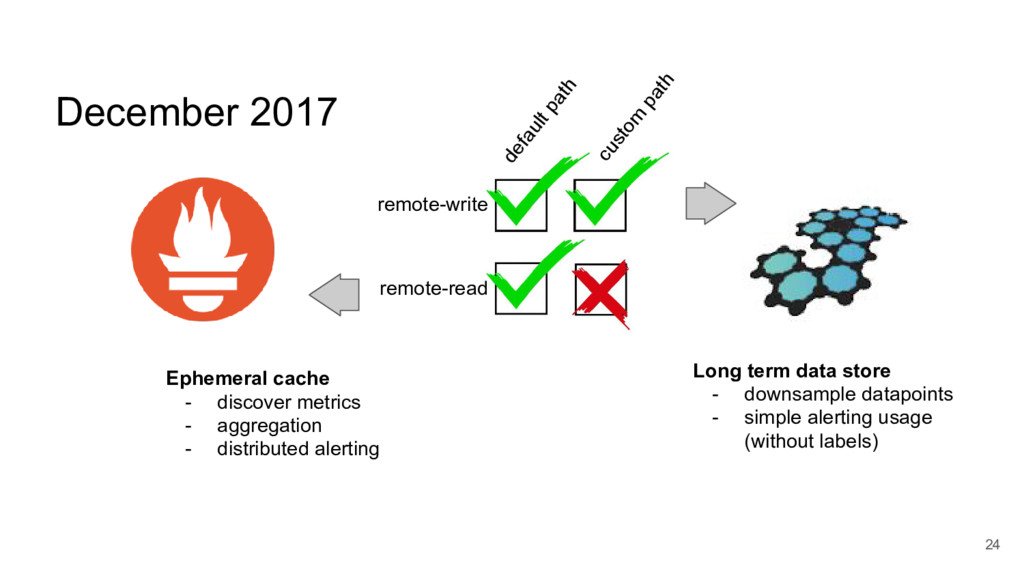
  17. default path custom path remote-write remote-read December 2017 Ephemeral cache

    - discover metrics - aggregation - distributed alerting Long term data store - downsample datapoints - simple alerting usage (without labels) 24
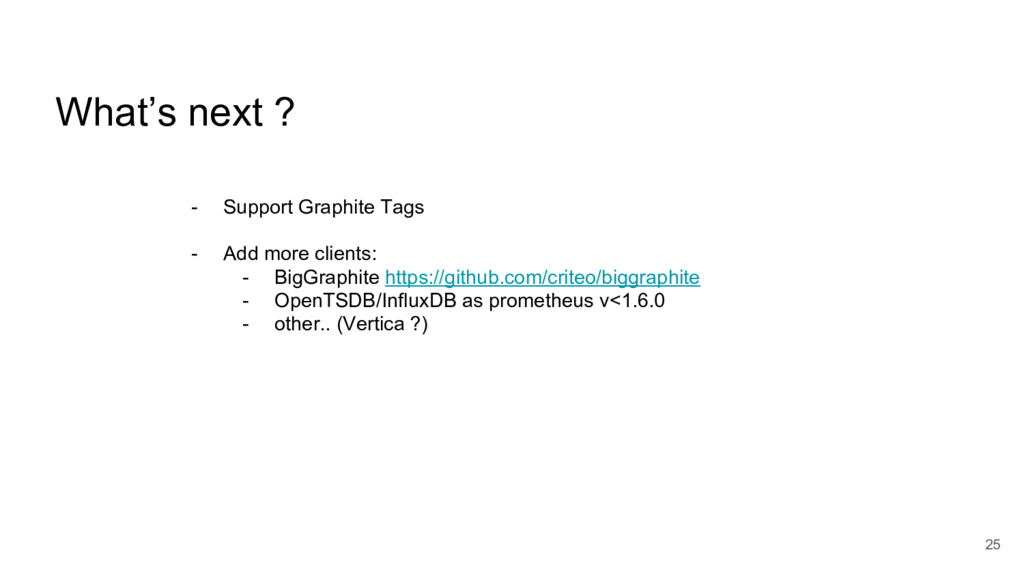
  18. - Support Graphite Tags - Add more clients: - BigGraphite

    https://github.com/criteo/biggraphite - OpenTSDB/InfluxDB as prometheus v<1.6.0 - other.. (Vertica ?) What’s next ? 25