Upgrade to Pro — share decks privately, control downloads, hide ads and more …

Towards modeling individual differences in cognitive processes using two-choice reaction time tasks

Towards modeling individual differences in cognitive processes using two-choice reaction time tasks

Tiago Cabaço

June 01, 2018
Tweet

Other Decks in Science

Transcript

  1. LIFE Fall Academy Max Planck Institute for Human Development, Berlin

    Friday, June , Tiago Cabaço Towards modeling individual differences in cognitive processes using two-choice reaction time tasks
  2. With this talk... . We can better understand observed performance

    if we use models that account for processes underlying people’s behavior. . A modeling approach focused on the mechanisms underlying behavior, is very helpful to comprehend how and why people are different from each other.
  3. behavior? In our project, we are interested in studying differences

    in performance on two-choice reaction time task (CRT). Mask Decision ? Time Stimuli + 0 1 2 0 1 2 3 Response Time density 0 1 2 3 4 5 0.00 0.25 0.50 0.75 1.00 Choice proportions
  4. behavior data? Goal Model within and between-people variability in decision-making

    performance using the CRT tasks from the COGITO study. Odd vs Even Consonant vs Vowel Symmetric vs Asymmetric X 80 trials Fast Slow ? +
  5. behavior data? Goal Model within and between-people variability in decision-making

    performance using the CRT tasks from the COGITO study. 100 sessions 101 younger 103 older adults 204 participants 80 trials / session COGITO data structure COGITO data structure
  6. behavior data? Goal Model within and between-people variability in decision-making

    performance using the CRT tasks from the COGITO study. 100 sessions 101 younger 103 older adults 204 participants 80 trials / session COGITO data structure COGITO data structure Model temporal dynamics? Model age differences? Model inter and intra- individual differences? Model decision-making performance? Modeling Challenges Modeling Challenges
  7. behavior data? Goal Model within and between-people variability in decision-making

    performance using the CRT tasks from the COGITO study. 100 sessions 101 younger 103 older adults 204 participants 80 trials / session COGITO data structure COGITO data structure Model temporal dynamics? Model age differences? Model inter and intra- individual differences? Model decision-making performance? Modeling Challenges Modeling Challenges
  8. behavior data model? Data from session - consonant vs vowel

    task (N ). consonant vs vowel fast slow 0.4 0.6 0.8 1.0 1.2 0 1 2 3 0 1 2 3 Mean response time density consonant vs vowel fast slow 0.4 0.6 0.8 1.0 0 1 2 3 0 1 2 3 Choice proportions density Age group older younger
  9. behavior data model? How to model performance in CRT? .

    Model observed performance as function of the variates and covariates in our sample. E.g., behavior ∼ f (βage + βexperimental condition) Useful for description of performance; Offers no information about the mechanisms or processes underlying behavior (i.e., decision-making processes);
  10. behavior data model? How to model performance in CRT? Use

    a model that formalizes cognitive processes and their relationship to observed behavior → cognitive models; behavior ∼ f (response processes) Focus on latent processes underlying behavior; Understand performance as a function of its underlying processes → explanation!
  11. behavior data model cognitive processes Model cognitive processes using the

    drift diffusion model (e.g., Ratcliff & McKoon, );
  12. behavior data model cognitive processes Model cognitive processes using the

    drift diffusion model (e.g., Ratcliff & McKoon, );
  13. behavior data model cognitive processes Model cognitive processes using the

    drift diffusion model (e.g., Ratcliff & McKoon, ); + α β δ τ Time stimulus Decision A Decision B Time ?
  14. behavior data model cognitive processes + α β δ τ

    Time stimulus Decision A Decision B Time ? Model parameters: Drift-rate (δ): Rate of evidence accumulation; Boundary separation (α): Amount of evidence required for a decision; Relative starting point(β): Starting point for evidence accumulation; Non-decision time(τ): Stimulus encoding and Motor response.
  15. model cognitive processes individual differences? How to model individual differences

    in cognitive processes? Partial-pooling approach (hierarchical model): response processsubject ∼ Normal(mean, SD) response processmean = mean + βage response processmean = mean + βage + βcycle effect Estimate simultaneously individual and group-level parameters. Bayesian approach: Quantify uncertainty about our parameter estimates; Use prior information about current knowledge or expectations;
  16. model cognitive processes individual differences? Current model: boundary separationsubject ∼

    Log-normal(meanBS, SDBS) + βage; use of log-normal to transform estimates to be positive; age slope βage .
  17. model cognitive processes individual differences? Current model: drift-ratesubject ∼ Normal(

    meandrift + βage +βcyclesubject , → estimates screen cycle effect per subject SDdrift); βcyclesubject ∼ Normal(meanβcycle, sigmaβcycle)
  18. model cognitive processes individual differences? Current model: starting pointsubject ∼

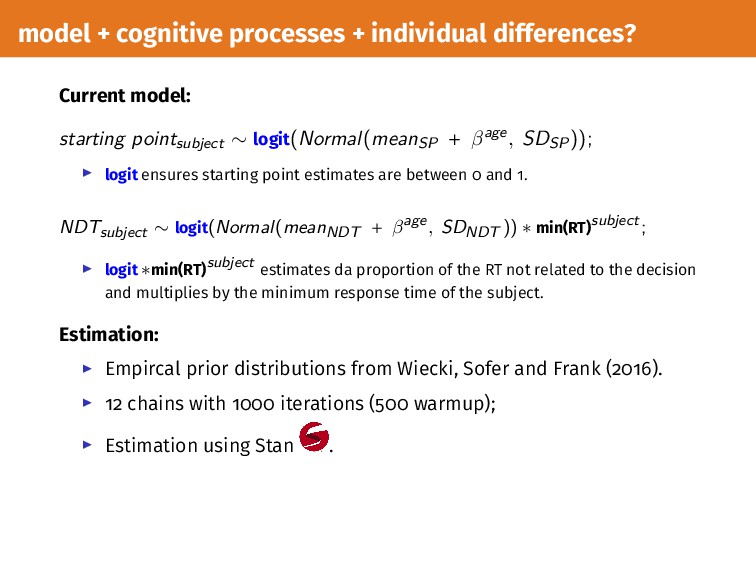
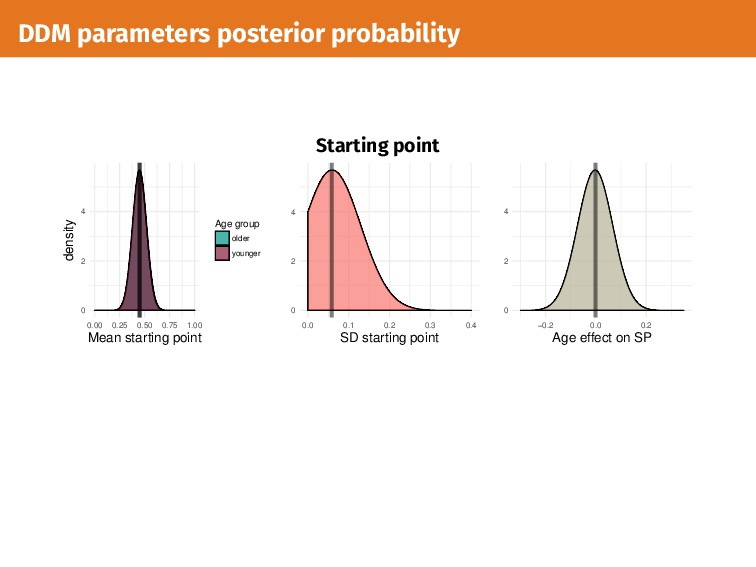
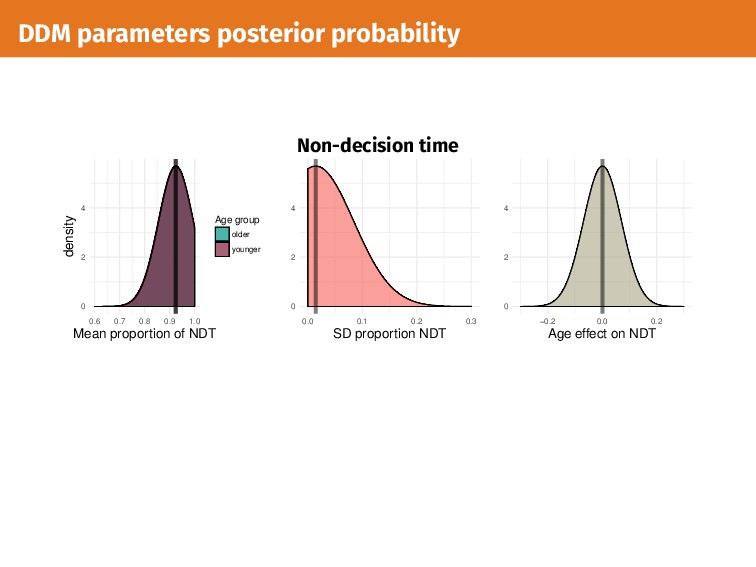
    logit(Normal(meanSP + βage, SDSP)); logit ensures starting point estimates are between and . NDTsubject ∼ logit(Normal(meanNDT + βage, SDNDT )) ∗ min(RT)subject; logit ∗min(RT)subject estimates da proportion of the RT not related to the decision and multiplies by the minimum response time of the subject. Estimation: Empircal prior distributions from Wiecki, Sofer and Frank ( ). chains with iterations ( warmup); Estimation using Stan .
  19. DDM parameters posterior probability Drift-rate 0 1 2 3 4

    1.0 1.2 1.4 1.6 1.8 Mean drift rate (fast condition) density 0 1 2 3 2.4 2.6 2.8 3.0 3.2 3.4 Mean drift rate (slow condition) Age group older younger 0 1 2 3 4 0.6 0.8 1.0 1.2 SD drift rate density 0 1 2 3 4 −0.75 −0.50 −0.25 0.00 0.25 Age effect on drift rate
  20. DDM parameters posterior probability Masking effect 0 1 2 3

    4 1.2 1.4 1.6 1.8 Mean screen cycle effect 0 1 2 3 4 0.6 0.8 1.0 1.2 SD screen cycle effect
  21. DDM parameters posterior probability Boundary separation 0 2 4 1.2

    1.4 1.6 Mean boundary separation density Age group older younger 0 2 4 0.2 0.4 0.6 SD boundary separation 0 2 4 −0.2 0.0 0.2 Age effect on BS
  22. DDM parameters posterior probability Starting point 0 2 4 0.00

    0.25 0.50 0.75 1.00 Mean starting point density Age group older younger 0 2 4 0.0 0.1 0.2 0.3 0.4 SD starting point 0 2 4 −0.2 0.0 0.2 Age effect on SP
  23. DDM parameters posterior probability Non-decision time 0 2 4 0.6

    0.7 0.8 0.9 1.0 Mean proportion of NDT density Age group older younger 0 2 4 0.0 0.1 0.2 0.3 SD proportion NDT 0 2 4 −0.2 0.0 0.2 Age effect on NDT
  24. Posterior predictive check Simulated data using posterior estimates; Comparison with

    observed data. fast slow 0.5 1.0 0.5 1.0 0.4 0.6 0.8 1.0 1.2 Mean RT fast slow 0.4 0.6 0.8 1.0 0.4 0.6 0.8 1.0 0.4 0.6 0.8 1.0 Correct proportion fast slow 0.0 0.2 0.4 0.6 0.0 0.2 0.4 0.6 0.0 0.2 0.4 0.6 Error proportion
  25. Posterior predictive check Simulated data using posterior estimates; Comparison with

    observed data. fast slow 0.5 1.0 0.5 1.0 0.4 0.6 0.8 1.0 1.2 Mean RT fast slow 0.4 0.6 0.8 1.0 0.4 0.6 0.8 1.0 0.4 0.6 0.8 1.0 Correct proportion fast slow 0.0 0.2 0.4 0.6 0.0 0.2 0.4 0.6 0.0 0.2 0.4 0.6 Error proportion Reliable estimation of individual differences in performance as a function of the underlying decision-making processes.
  26. Behavior analysis cognitive model consonant vs vowel fast slow 0.4

    0.6 0.8 1.0 1.2 0 1 2 3 0 1 2 3 Mean response time density consonant vs vowel fast slow 0.4 0.6 0.8 1.0 0 1 2 3 0 1 2 3 Choice proportions density Age group older younger
  27. Behavior analysis cognitive model 0 1 2 3 4 1.0

    1.2 1.4 1.6 1.8 Mean drift rate (fast condition) density 0 1 2 3 2.4 2.6 2.8 3.0 3.2 3.4 Mean drift rate (slow condition) Age group older younger 0 2 4 1.2 1.4 1.6 Mean boundary separation density Age group older younger 0 2 4 0.00 0.25 0.50 0.75 1.00 Mean starting point density Age group older younger 0 2 4 0.6 0.7 0.8 0.9 1.0 Mean proportion of NDT density Age group older younger Age differences accounted by different response processes: Younger adults → higher drift-rate → lower RT; Older adults → higher boundary separation → higher correct responses at the cost of speed; Requires caution due to low number of efficient samples.
  28. Discussion Using hierarchical implementation of the DDM allows for a

    mechanistic account of performance; Provides a possible explanation for individual differences in performance. However, Low number of efficient samples in some parameters; What to do with contaminant processes? What about change with time?
  29. Discussion fast slow consonant vs vowel odd vs even symetric

    vs non−symetric 0 25 50 75 100 0 25 50 75 100 0.4 0.5 0.6 0.7 0.8 0.4 0.5 0.6 0.7 0.8 0.4 0.5 0.6 0.7 0.8 Time Mean reaction time fast slow consonant vs vowel odd vs even symetric vs non−symetric 0 25 50 75 100 0 25 50 75 100 0.6 0.7 0.8 0.9 0.6 0.7 0.8 0.9 0.6 0.7 0.8 0.9 Time Choice proportion age.group older younger
  30. LIFE Fall Academy Max Planck Institute for Human Development, Berlin

    Friday, June , Tiago Cabaço Towards modeling individual differences in cognitive processes using two-choice reaction time tasks