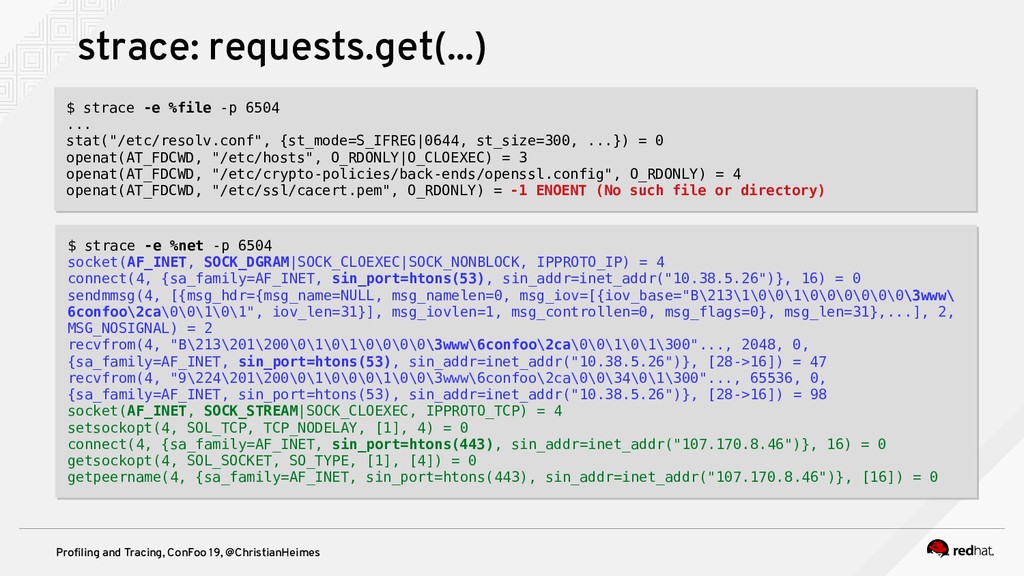
-e %file -p 6504 ... stat("/etc/resolv.conf", {st_mode=S_IFREG|0644, st_size=300, ...}) = 0 openat(AT_FDCWD, "/etc/hosts", O_RDONLY|O_CLOEXEC) = 3 openat(AT_FDCWD, "/etc/crypto-policies/back-ends/openssl.config", O_RDONLY) = 4 openat(AT_FDCWD, "/etc/ssl/cacert.pem", O_RDONLY) = -1 ENOENT (No such file or directory) $ strace -e %file -p 6504 ... stat("/etc/resolv.conf", {st_mode=S_IFREG|0644, st_size=300, ...}) = 0 openat(AT_FDCWD, "/etc/hosts", O_RDONLY|O_CLOEXEC) = 3 openat(AT_FDCWD, "/etc/crypto-policies/back-ends/openssl.config", O_RDONLY) = 4 openat(AT_FDCWD, "/etc/ssl/cacert.pem", O_RDONLY) = -1 ENOENT (No such file or directory) $ strace -e %net -p 6504 socket(AF_INET, SOCK_DGRAM|SOCK_CLOEXEC|SOCK_NONBLOCK, IPPROTO_IP) = 4 connect(4, {sa_family=AF_INET, sin_port=htons(53), sin_addr=inet_addr("10.38.5.26")}, 16) = 0 sendmmsg(4, [{msg_hdr={msg_name=NULL, msg_namelen=0, msg_iov=[{iov_base="B\213\1\0\0\1\0\0\0\0\0\0\3www\ 6confoo\2ca\0\0\1\0\1", iov_len=31}], msg_iovlen=1, msg_controllen=0, msg_flags=0}, msg_len=31},...], 2, MSG_NOSIGNAL) = 2 recvfrom(4, "B\213\201\200\0\1\0\1\0\0\0\0\3www\6confoo\2ca\0\0\1\0\1\300"..., 2048, 0, {sa_family=AF_INET, sin_port=htons(53), sin_addr=inet_addr("10.38.5.26")}, [28->16]) = 47 recvfrom(4, "9\224\201\200\0\1\0\0\0\1\0\0\3www\6confoo\2ca\0\0\34\0\1\300"..., 65536, 0, {sa_family=AF_INET, sin_port=htons(53), sin_addr=inet_addr("10.38.5.26")}, [28->16]) = 98 socket(AF_INET, SOCK_STREAM|SOCK_CLOEXEC, IPPROTO_TCP) = 4 setsockopt(4, SOL_TCP, TCP_NODELAY, [1], 4) = 0 connect(4, {sa_family=AF_INET, sin_port=htons(443), sin_addr=inet_addr("107.170.8.46")}, 16) = 0 getsockopt(4, SOL_SOCKET, SO_TYPE, [1], [4]) = 0 getpeername(4, {sa_family=AF_INET, sin_port=htons(443), sin_addr=inet_addr("107.170.8.46")}, [16]) = 0 $ strace -e %net -p 6504 socket(AF_INET, SOCK_DGRAM|SOCK_CLOEXEC|SOCK_NONBLOCK, IPPROTO_IP) = 4 connect(4, {sa_family=AF_INET, sin_port=htons(53), sin_addr=inet_addr("10.38.5.26")}, 16) = 0 sendmmsg(4, [{msg_hdr={msg_name=NULL, msg_namelen=0, msg_iov=[{iov_base="B\213\1\0\0\1\0\0\0\0\0\0\3www\ 6confoo\2ca\0\0\1\0\1", iov_len=31}], msg_iovlen=1, msg_controllen=0, msg_flags=0}, msg_len=31},...], 2, MSG_NOSIGNAL) = 2 recvfrom(4, "B\213\201\200\0\1\0\1\0\0\0\0\3www\6confoo\2ca\0\0\1\0\1\300"..., 2048, 0, {sa_family=AF_INET, sin_port=htons(53), sin_addr=inet_addr("10.38.5.26")}, [28->16]) = 47 recvfrom(4, "9\224\201\200\0\1\0\0\0\1\0\0\3www\6confoo\2ca\0\0\34\0\1\300"..., 65536, 0, {sa_family=AF_INET, sin_port=htons(53), sin_addr=inet_addr("10.38.5.26")}, [28->16]) = 98 socket(AF_INET, SOCK_STREAM|SOCK_CLOEXEC, IPPROTO_TCP) = 4 setsockopt(4, SOL_TCP, TCP_NODELAY, [1], 4) = 0 connect(4, {sa_family=AF_INET, sin_port=htons(443), sin_addr=inet_addr("107.170.8.46")}, 16) = 0 getsockopt(4, SOL_SOCKET, SO_TYPE, [1], [4]) = 0 getpeername(4, {sa_family=AF_INET, sin_port=htons(443), sin_addr=inet_addr("107.170.8.46")}, [16]) = 0
![Questions? @ChristianHeimes [email protected] [email protected] https://speakerdeck.com/tiran/](https://files.speakerdeck.com/presentations/fd9dfd246e954689bafabb2bceb5c77b/slide_63.jpg)